Tools for Malicious Activity Detection
Not sure you’re ready?
Take the ~3-minute readiness diagnostic and see where you stand.
Imagine attempting to reconstruct a bank robbery by examining only the shadows left by the perpetrators. In cybersecurity, we rarely catch an adversary in the physical act of theft; instead, we are forced to reconstruct their movements from the digital vibrations they leave behind on wires and in memory. The tools we use to capture these vibrations—from microscopic packet analyzers to macro-level log aggregators—are the lenses through which the invisible becomes visible. To defend a network, a Security Operations Center (SOC) analyst must master both the granular details of network traffic and the vast, aggregate narratives of system logs.

When an adversary moves laterally across your network or exfiltrates a database, they must obey the laws of physics governing your infrastructure: they must transmit packets. Capturing these packets gives you the absolute, ground-truth reality of the attack.
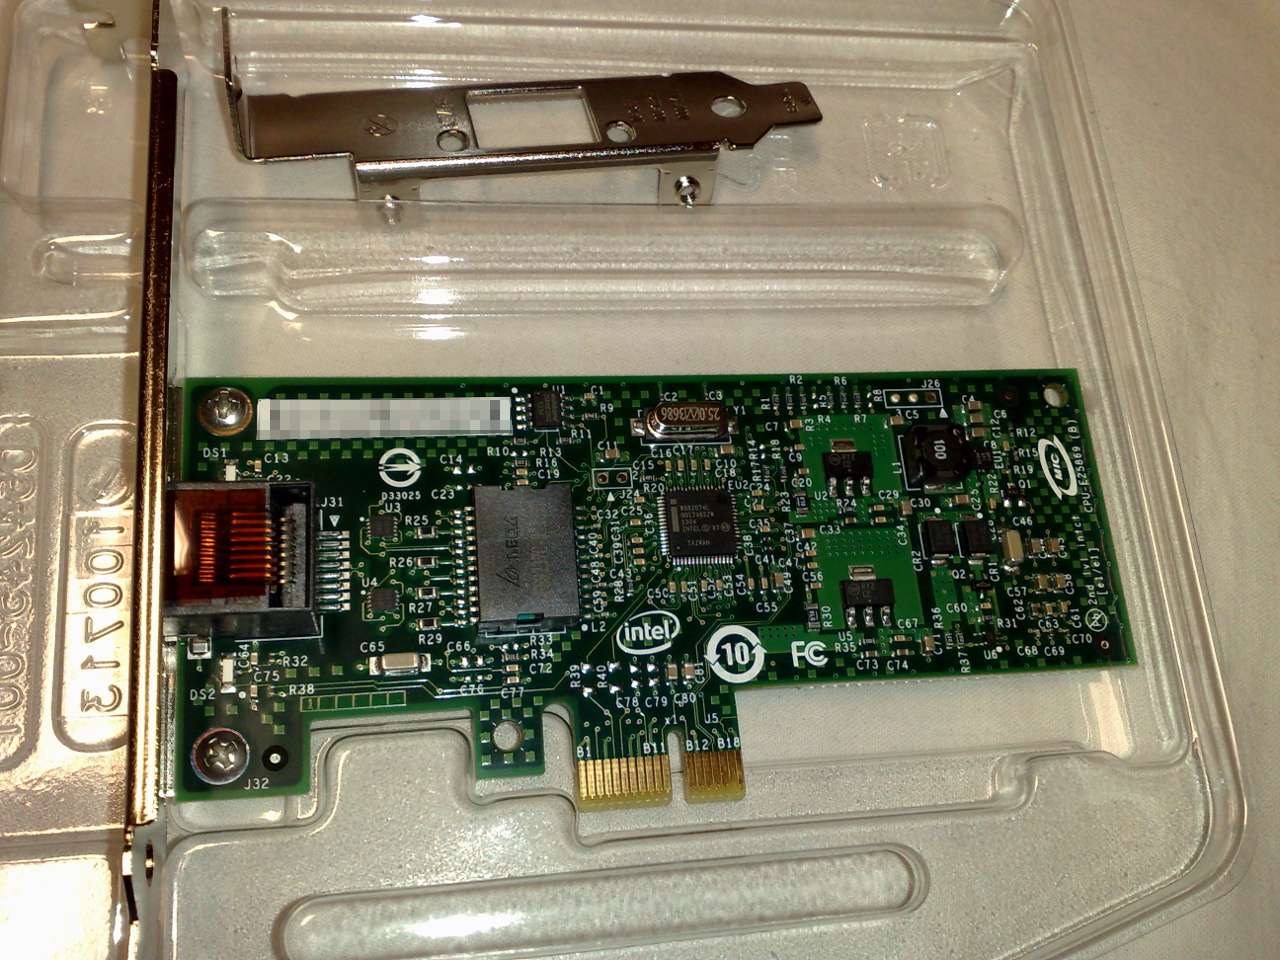
To see everything passing over a local network segment—not just the traffic addressed specifically to your machine—you must place a network interface card (NIC) into promiscuous mode. This forces the hardware to process every frame it sees on the wire, feeding it up the stack to your analysis tools.
Wireshark: The Analyst's Microscope
When you need to dissect network traffic in real time, Wireshark is the industry-standard graphical network protocol analyzer. It allows an analyst to capture, inspect, and drill down into the very bytes that make up a communication sequence. Modern versions of Wireshark save these captures using the pcapng file format by default, a flexible standard that supports advanced features like capturing from multiple interfaces simultaneously and adding metadata to the file.
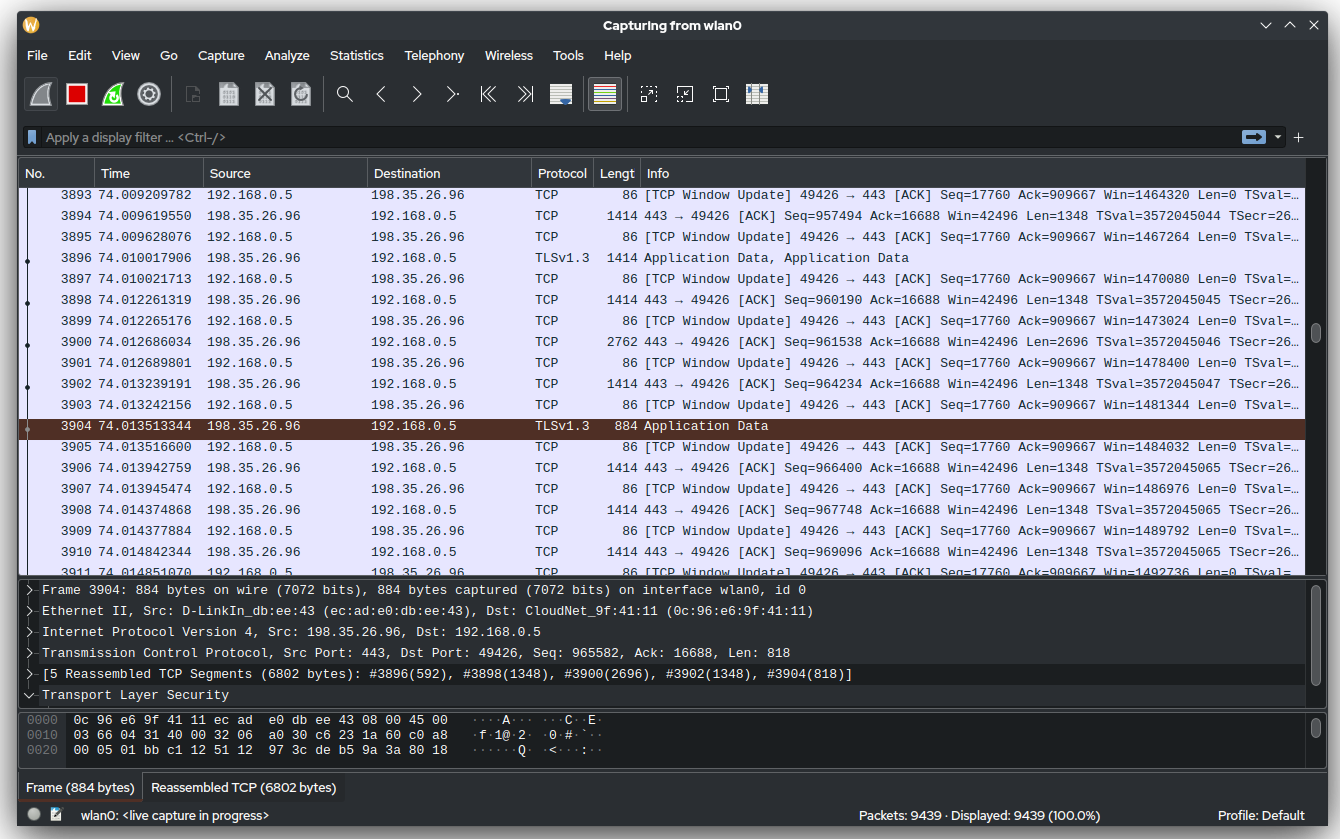
However, capturing everything creates an overwhelming amount of data. To make sense of it, analysts use filters.
Capture Filters vs. Display Filters It is crucial to understand the difference between limiting what you record and limiting what you see.
Wireshark display filters evaluate captured packets against specific criteria to show only matching traffic without altering the underlying capture file. If you clear the filter, all the original data is still there.
Two foundational display filters every analyst must know are:
ip.addr == 192.168.1.1— This isolates the view to display all packets with a source or destination IP address of 192.168.1.1.tcp.port == 80— This filters the captured traffic to show only packets using TCP port 80 (standard, unencrypted HTTP traffic).
Once you have filtered down to a suspicious communication, looking at individual packets can be like reading a book one letter at a time. To solve this, Wireshark includes the Follow TCP Stream feature. This brilliant tool reconstructs and displays the complete payload of a specific TCP session in a human-readable format, exactly as the application layer experienced it.
CLI Packet Analysis: tcpdump and TShark
SOC analysts frequently operate on headless Linux servers where graphical tools like Wireshark cannot run. In these environments, command-line tools are your lifeline.
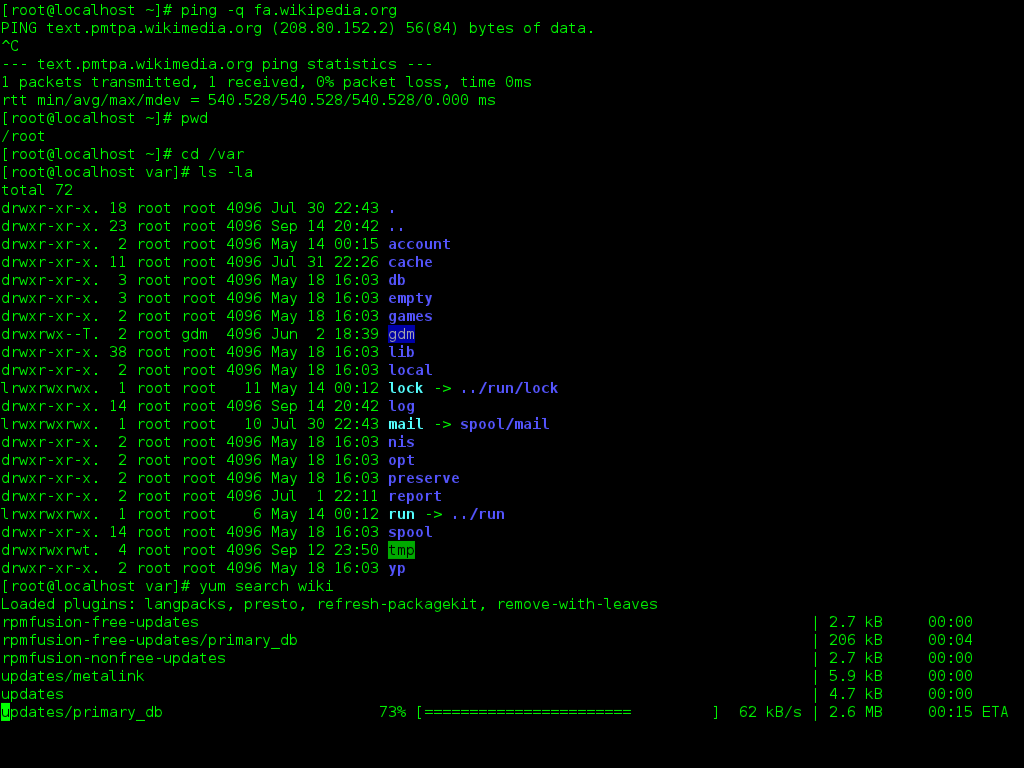
tcpdump is a veteran command-line packet analyzer used to capture and display packets transmitted over a network. Instead of display filters, tcpdump relies heavily on Berkeley Packet Filter (BPF) syntax. BPF is a deeply optimized, foundational syntax used to define capture filters that strictly limit the packets recorded by the tool at the kernel level.
To master tcpdump, you must fluidly read and write its command flags:
| Flag | Purpose | Application |
|---|---|---|
-i | Interface | Specifies the network interface on which the tool should listen (e.g., tcpdump -i eth0). |
-n | No Resolution | Prevents the resolution of IP addresses to hostnames. This is vital to speed up packet output and prevents the tool from generating its own DNS traffic while listening. |
-w | Write | Writes captured network packets to a specified file instead of displaying the packets on the screen. |
-r | Read | Reads and displays packets from a previously saved packet capture file. |
-X | Hex/ASCII | Displays packet contents in both hexadecimal and ASCII formats, crucial for spotting plaintext commands in an otherwise opaque payload. |
If you need the specific protocol-decoding power of Wireshark but are restricted to the command line, you use TShark. TShark is essentially a terminal-oriented version of Wireshark used for capturing and displaying packet data via the command line, bridging the gap between tcpdump's lightweight speed and Wireshark's deep analytical engine.
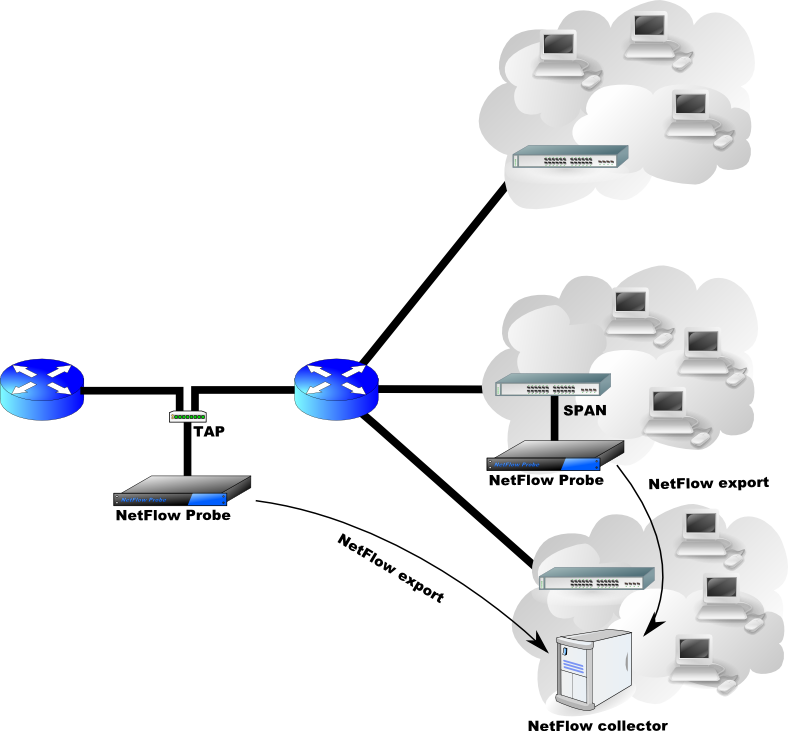
Full packet capture is expensive. Storing the payload of every packet on a 100Gbps enterprise backbone is financially and technologically prohibitive. Often, analysts do not need the content of a conversation; they just need the context—who spoke to whom, for how long, and how many bytes were transferred.
- NetFlow: Originally developed by Cisco, NetFlow data provides summarized network traffic statistics rather than full packet payloads. Think of packet capture as a wiretap, whereas NetFlow is an itemized phone bill. It is highly efficient for spotting volumetric anomalies like DDoS attacks or massive data exfiltration.
- Zeek: Moving one step deeper than NetFlow is Zeek (formerly Bro). Zeek is a passive, open-source network traffic analyzer used to generate connection logs and detect suspicious network patterns. Rather than just tracking IP addresses and bytes, Zeek explicitly extracts application-layer metadata from network traffic (like HTTP URIs, DNS queries, and SSL certificates) and stores the metadata in highly structured, tab-separated log files.
The network tells you how an adversary traveled; the endpoint tells you what they touched. Attackers ultimately want to execute code, manipulate memory, and alter files on servers and workstations.
Historically, endpoints were defended by Endpoint Protection Platforms (EPP). EPP solutions primarily focus on preventing malware infections and securing endpoints before an attack executes. They are the gatekeepers. But what happens when the adversary slips past the gate using stolen credentials or a zero-day exploit?
To hunt within the perimeter, analysts turn to Endpoint Detection and Response (EDR). EDR solutions monitor endpoint activity in real time to detect and respond to advanced threats that bypass EPP. More importantly, EDR tools provide continuous recording of endpoint telemetry (process executions, memory injections, registry modifications) to facilitate post-incident forensic investigations. If an analyst needs to know exactly what a user's machine did at 3:00 AM three weeks ago, EDR holds the answer.
For a tighter, locally focused approach, organizations utilize Host-based Intrusion Detection Systems (HIDS). A HIDS operates by analyzing operating system logs and file modifications on a single host to detect malicious activity, verifying the integrity of critical system files.
Peering into Windows: Microsoft Sysmon
To feed high-fidelity data to EDR and SIEM platforms, many organizations deploy Microsoft Sysmon (System Monitor). Sysmon is a Windows system service that logs incredibly detailed system activity directly to the Windows event log, persisting across reboots.
For the CySA+ analyst, two Sysmon Event IDs are fundamental cornerstones of threat hunting:
- Sysmon Event ID 1: Records the creation of a new process on a Windows system. It captures the exact command line executed, the parent process that launched it, and the cryptographic hashes of the executable file.
- Sysmon Event ID 3: Records network connections initiated or received by a Windows system, linking a specific executable to a specific remote IP address and port.
Data is useless without synthesis. When you have Zeek metadata from the network, Event ID 1s from Sysmon, and firewall telemetry, you must bring it together to see the whole battlefield.
This is the domain of Security Information and Event Management (SIEM) systems. A SIEM aggregates log data from multiple sources to identify potential security incidents that would be invisible if viewed in isolation.
How does the data get to the SIEM? Very often, through Syslog, a standard protocol used for sending system log or event messages to a centralized logging server. By default, the Syslog protocol uses UDP port 514 for transmitting log messages.
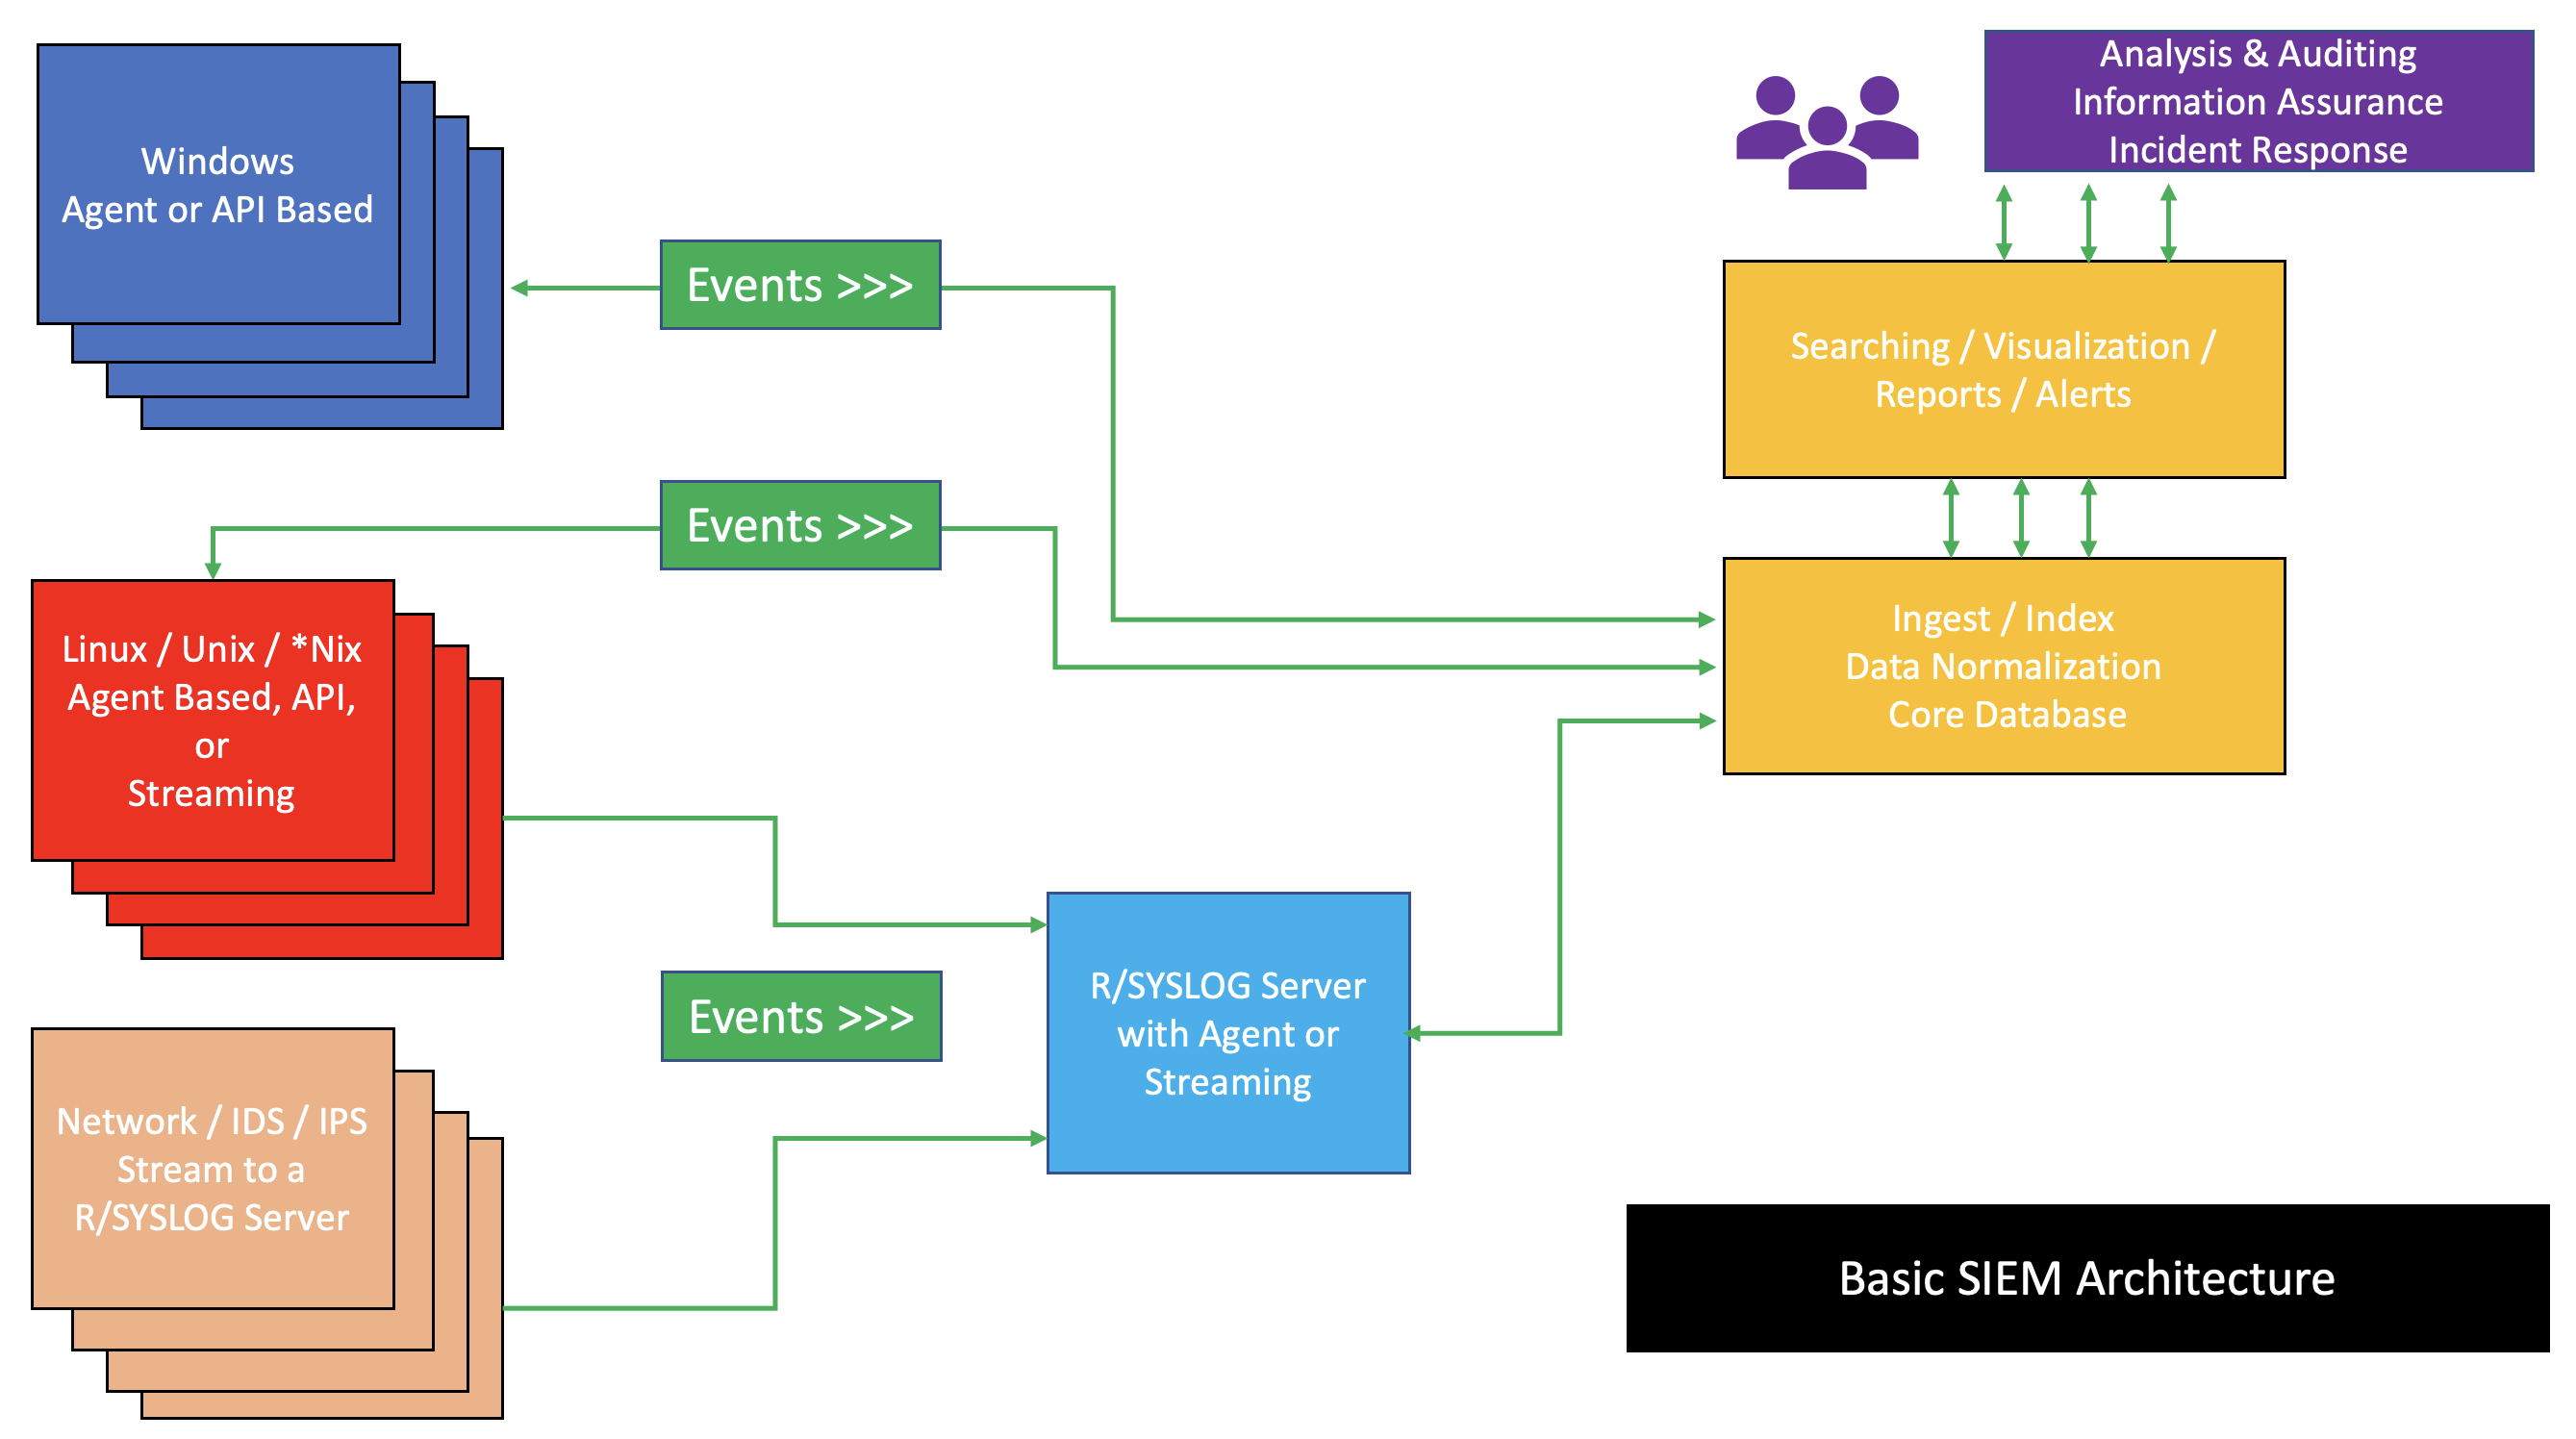
The Mechanics of SIEM Correlation
To make sense of thousands of disparate log formats, the SIEM must perform log normalization. This is the vital process that standardizes log data from diverse sources into a uniform format to facilitate efficient searching and correlation. For example, a firewall might call a target system Dest_IP, while Sysmon calls it DestinationIp. Normalization maps both to a single, searchable variable like target_ip.
Once normalized, the SIEM executes log correlation. This is the process of linking related log events from different systems to detect complex attack patterns. If a VPN login from a foreign country (VPN log) is immediately followed by a massive database query (Database log) and an outbound SSH connection (Zeek log), correlation rules flag this sequence as a high-priority incident.
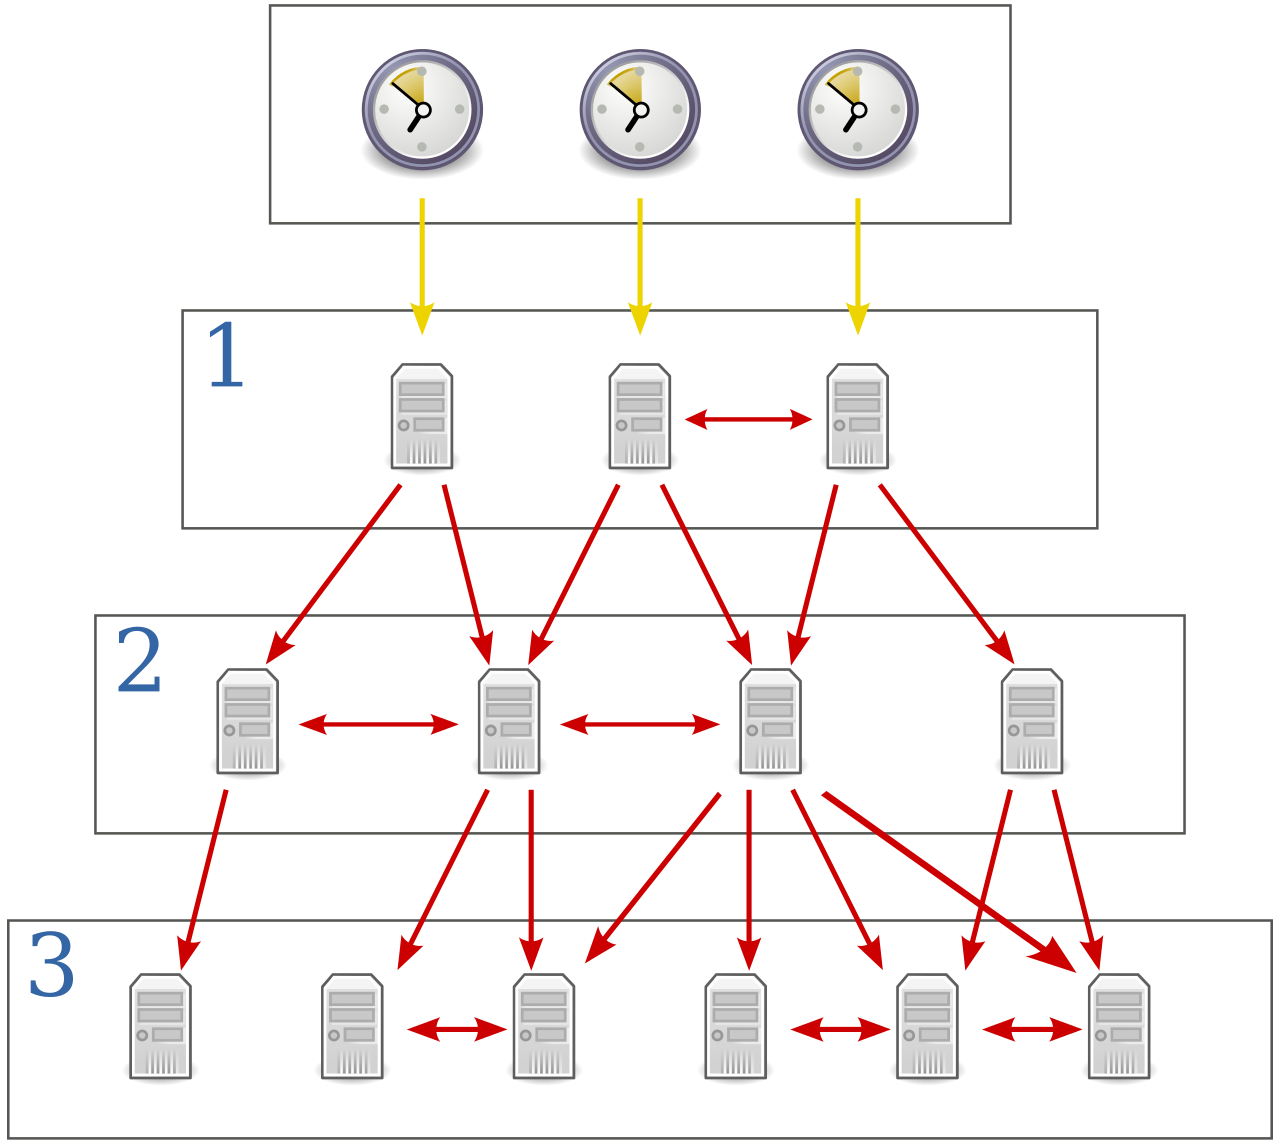
The Prerequisite for Correlation: Time Log correlation is mathematically impossible without strict temporal alignment. Therefore, time synchronization using Network Time Protocol (NTP) across all logging devices is strictly required for accurate log correlation. If your firewall's clock is five minutes faster than your domain controller's clock, the SIEM cannot confidently sequence the attack.
Managing the Evidence
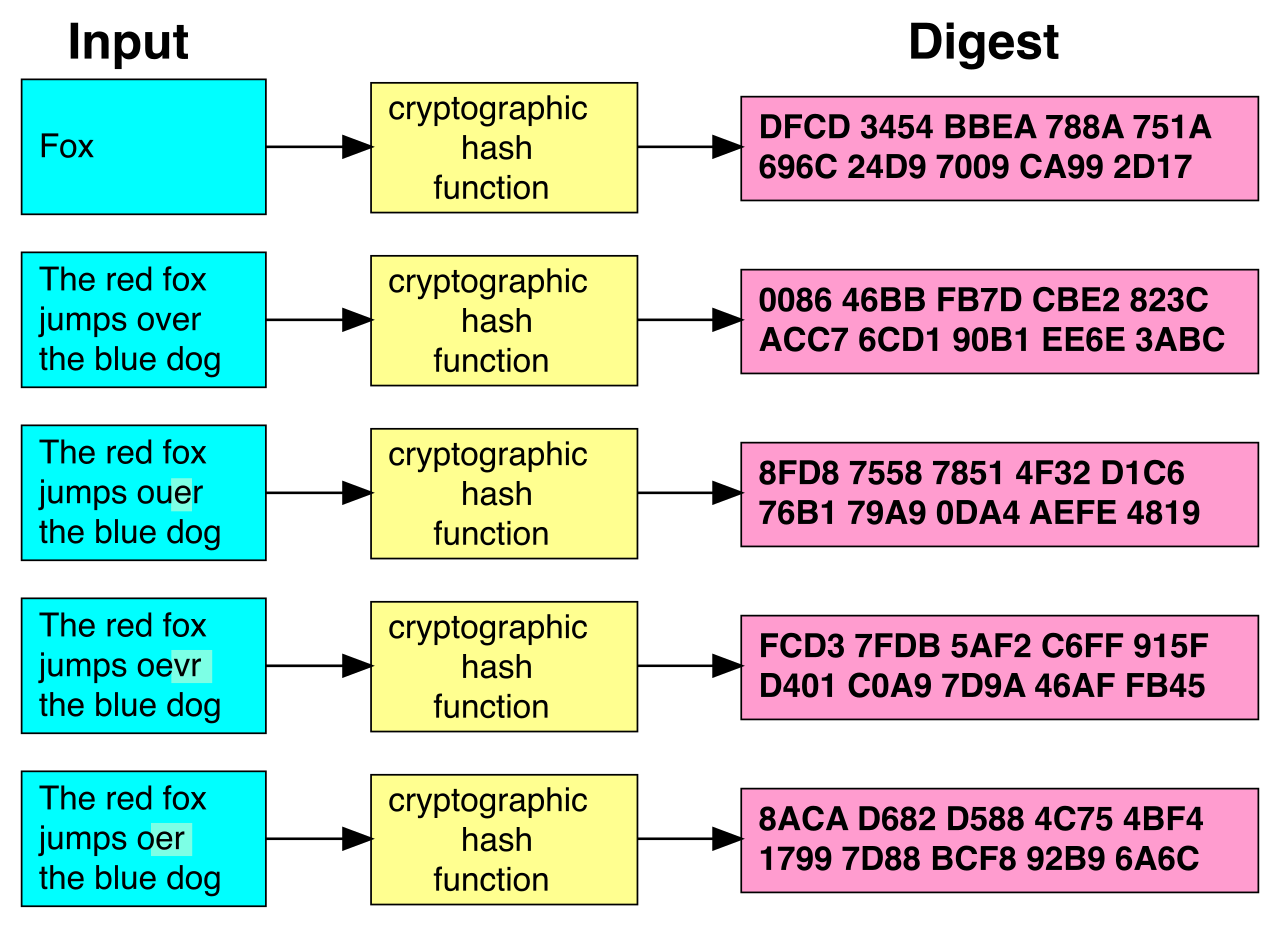
Because logs represent the definitive history of your environment, attackers often attempt to delete or alter them to cover their tracks. To combat this, security engineers utilize log hashing, a cryptographic process that verifies the integrity of log files by detecting unauthorized modifications to the stored log data.
This holistic approach to data handling is codified by the federal government. NIST SP 800-92 (Guide to Computer Security Log Management) formally defines log management infrastructure as comprising three distinct operational phases:
- Log Generation: The creation of the event data at the host or network level.
- Log Analysis and Storage: The aggregation, normalization, correlation, and secure retention of the data.
- Log Monitoring: The active, human-in-the-loop observation and automated alerting based on the analyzed data.
When you master these tools—when you can move seamlessly from the macro-level correlations of a SIEM down to the granular reality of a single Wireshark packet—you cease to be a mere observer of your network. You become its master, capable of translating the chaotic noise of digital operations into a clear, actionable narrative of defense.