Evaluate Project Status: Metrics
Not sure you’re ready?
Take the ~3-minute readiness diagnostic and see where you stand.
A pilot flying an airliner through heavy fog does not rely on peering out the cockpit window to reach their destination. Instead, they rely on a highly integrated dashboard of telemetry—altimeters, artificial horizons, and airspeed indicators—to convert the chaotic reality of the atmosphere into precise, actionable data. Managing a complex project is fundamentally no different. A project manager who relies solely on subjective feelings, qualitative updates, or "gut instinct" is flying blind. To evaluate project status effectively, we must deploy rigorous metrics that strip away ambiguity, replacing optimism or pessimism with objective, quantifiable reality.

In the discipline of project management, evaluating status is not merely a reporting exercise; it is an epistemological one. It is the science of knowing exactly where a project is, where it is heading, and what adjustments are required to successfully deliver business value.
Before we can calculate a single metric, we must understand the lifecycle of project knowledge. We do not instantly possess "status." Instead, knowledge evolves through three distinct stages of refinement.
First, we collect Work Performance Data. This comprises the raw, unanalyzed observations and measurements identified during project execution. It is the unvarnished reality of the work: “Activity A took 14 hours,” or “$4,500 was spent on software licenses this week.” In isolation, these numbers tell us nothing about success or failure.
To generate meaning, we process this raw data through the analytical lens of the project management plan, resulting in Work Performance Information. This is where context is born. If the raw data stated Activity A took 14 hours, the Work Performance Information reveals that Activity A was planned to take 8 hours, meaning the activity took 75% longer than baselined.
Finally, this information must be translated into action. Work Performance Reports are the physical or electronic representations of Work Performance Information intended to generate decisions, raise issues, or trigger corrective actions. A dashboard showing a red indicator for budget performance is a Work Performance Report that commands a sponsor’s attention and drives executive decision-making.
In predictive, plan-driven environments, the gold standard for measuring progress is Earned Value Management. Earned Value Management integrates scope, schedule, and cost baselines to assess project performance objectively. It forces us to ask three questions simultaneously: What did we plan to do? What did we actually accomplish? What did it cost to accomplish it?
The Core Triad: PV, EV, and AC
Every EVM calculation derives from three foundational metrics, evaluated at a specific point in time:
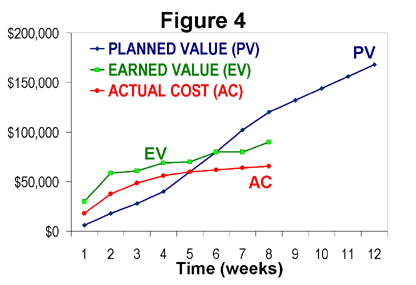
- Planned Value (PV) represents the authorized budget assigned to scheduled work. It is the financial value of the work we should have done by today.
- Earned Value (EV) is the measure of work performed expressed in terms of the budget authorized for that specific work. It is the value of the work we actually accomplished, translated into our baseline dollars.
- Actual Cost (AC) is the realized cost incurred for the work performed on an activity during a specific time period. It is what we actually spent out of pocket to achieve the Earned Value.
Consider a scenario: You are managing a server migration project. By Friday, you planned to migrate 10 servers at a baseline cost of $1,000 per server. Your Planned Value (PV) on Friday is $10,000. When Friday arrives, you discover the team has successfully migrated 8 servers. Your Earned Value (EV) is $8,000. However, due to overtime pay, the cost to migrate those 8 servers was $9,500. Your Actual Cost (AC) is $9,500.
Analyzing the Present: Variances and Indices
With our core triad established, we can calculate our exact deviation from the baseline.
Variances provide our status in absolute numerical terms (e.g., dollars or hours).
-
Schedule Variance calculates the difference between Earned Value and Planned Value.
Formula: Schedule Variance (SV) = Earned Value (EV) - Planned Value (PV)
A positive Schedule Variance indicates the project is currently ahead of schedule, while a negative Schedule Variance indicates the project is currently behind schedule.
-
Cost Variance calculates the difference between Earned Value and Actual Cost.
Formula: Cost Variance (CV) = Earned Value (EV) - Actual Cost (AC)
A positive Cost Variance indicates the project is currently under budget, whereas a negative Cost Variance indicates the project is currently over budget.
Indices, on the other hand, measure overall efficiency as a ratio. They tell us how much bang we are getting for our buck (or our time).
-
The Schedule Performance Index measures overall schedule efficiency.
Formula: Schedule Performance Index (SPI) = Earned Value (EV) / Planned Value (PV)
An SPI greater than 1.0 indicates more work was completed than planned (high efficiency). An SPI less than 1.0 means we are progressing at a fraction of our planned speed.
-
The Cost Performance Index measures overall cost efficiency.
Formula: Cost Performance Index (CPI) = Earned Value (EV) / Actual Cost (AC)
A CPI greater than 1.0 indicates a cost underrun for performance to date (we are earning value faster than we are spending cash).
Returning to our server migration:
- SV = $8,000 (EV) - $10,000 (PV) = -$2,000. (We are behind schedule).
- CV = $8,000 (EV) - $9,500 (AC) = -$1,500. (We are over budget).
- SPI = 8,000 / 10,000 = 0.8. (We are working at 80% of our planned schedule efficiency).
- CPI = 8,000 / 9,500 = 0.84. (For every dollar we spend, we are only earning 84 cents of value).
Forecasting the Future: EAC, ETC, VAC, and TCPI
Evaluating status is not just about knowing where you are; it is about predicting where you will end up.
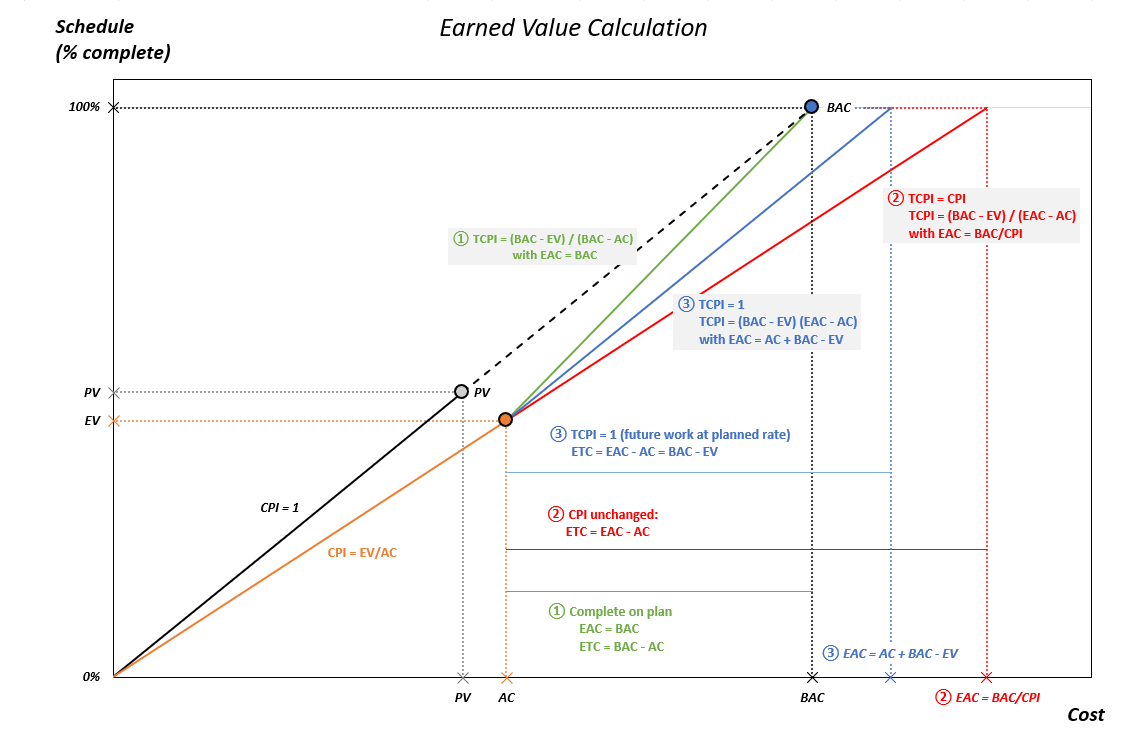
Based on current performance, we project the Estimate at Completion (EAC), which forecasts the expected total cost of completing all authorized project work. If our CPI is permanently damaged, our EAC will be higher than our original budget. From this, we calculate the Estimate to Complete (ETC), which projects the expected cost to finish all remaining project work from today forward.
To communicate the final anticipated financial outcome to stakeholders, we use Variance at Completion. This metric projects the amount of budget deficit or surplus at the end of the project.
Formula: Variance at Completion (VAC) = Budget at Completion (BAC) - Estimate at Completion (EAC)
If stakeholders are unhappy with a projected cost overrun, management may set a strict financial goal for the remainder of the project. To calculate the exact efficiency the team must maintain from today forward to hit that goal, we calculate the To-Complete Performance Index (TCPI). TCPI is essentially a required future CPI. If the TCPI is 1.2, your team must suddenly become 20% more cost-efficient than the baseline for the remainder of the project to save the budget—a difficult, if not impossible, mandate to achieve without structural changes.
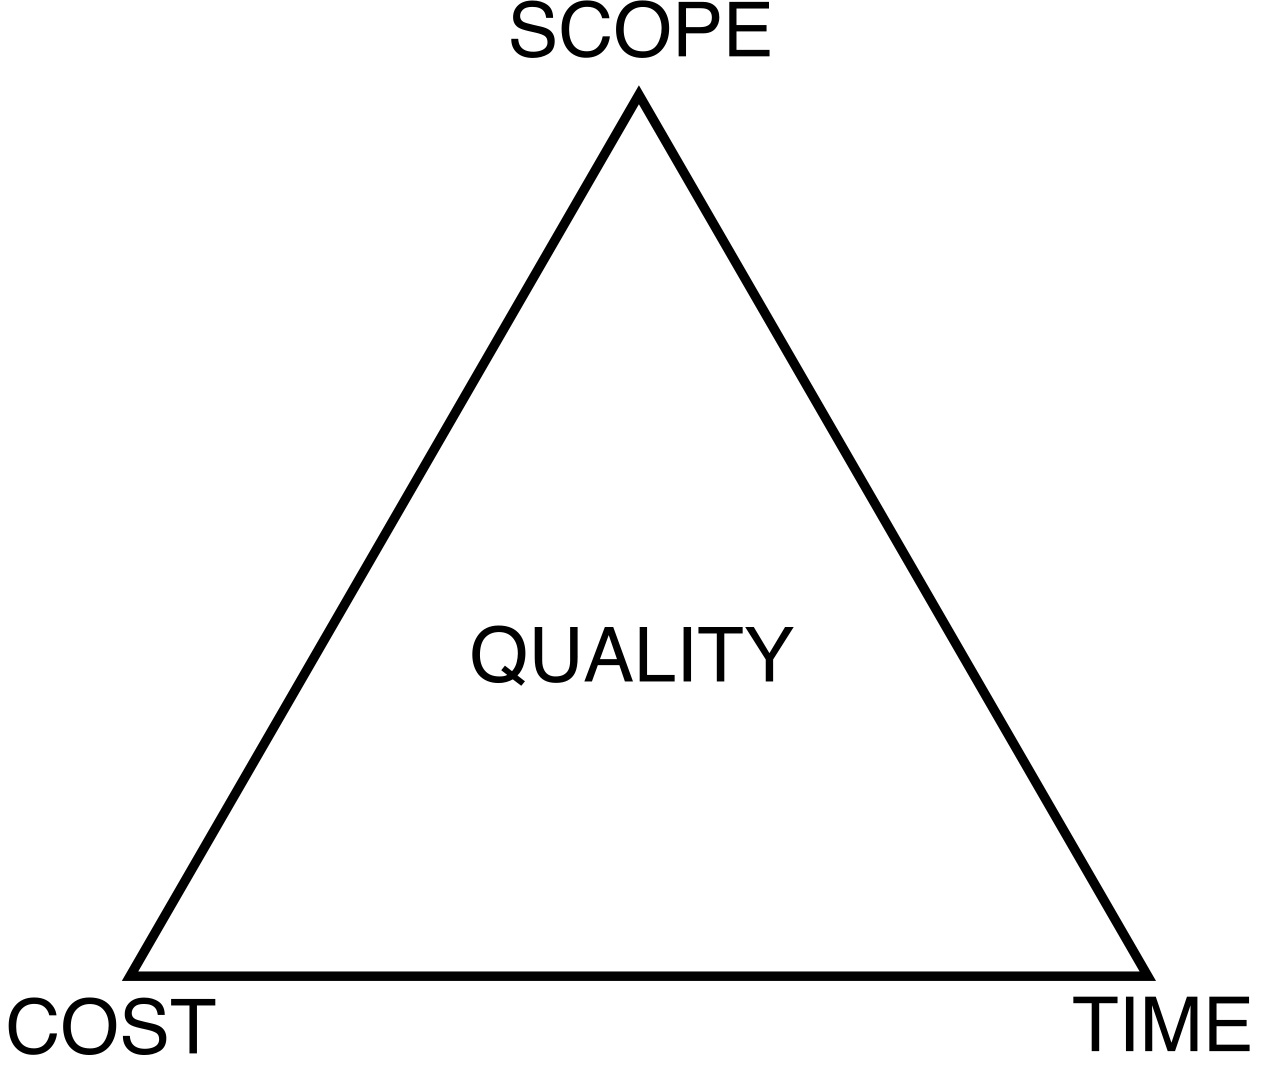
While EVM is a powerful mechanism for highly predictive projects where scope is locked, it breaks down in Agile environments. Agile flips the iron triangle: time and cost are fixed (via sprints and dedicated teams), while scope is fluid. Therefore, Agile telemetry focuses on flow, speed, and remaining work.
Sizing and Speed
Before a team can measure its speed, it must measure the weight of the work. Agile teams heavily rely on story points, which represent a relative measure of effort required to complete an agile user story. Unlike estimating in absolute hours, story points account for complexity, risk, and volume. A Fibonacci sequence (1, 2, 3, 5, 8, 13) is often used to prevent false precision.
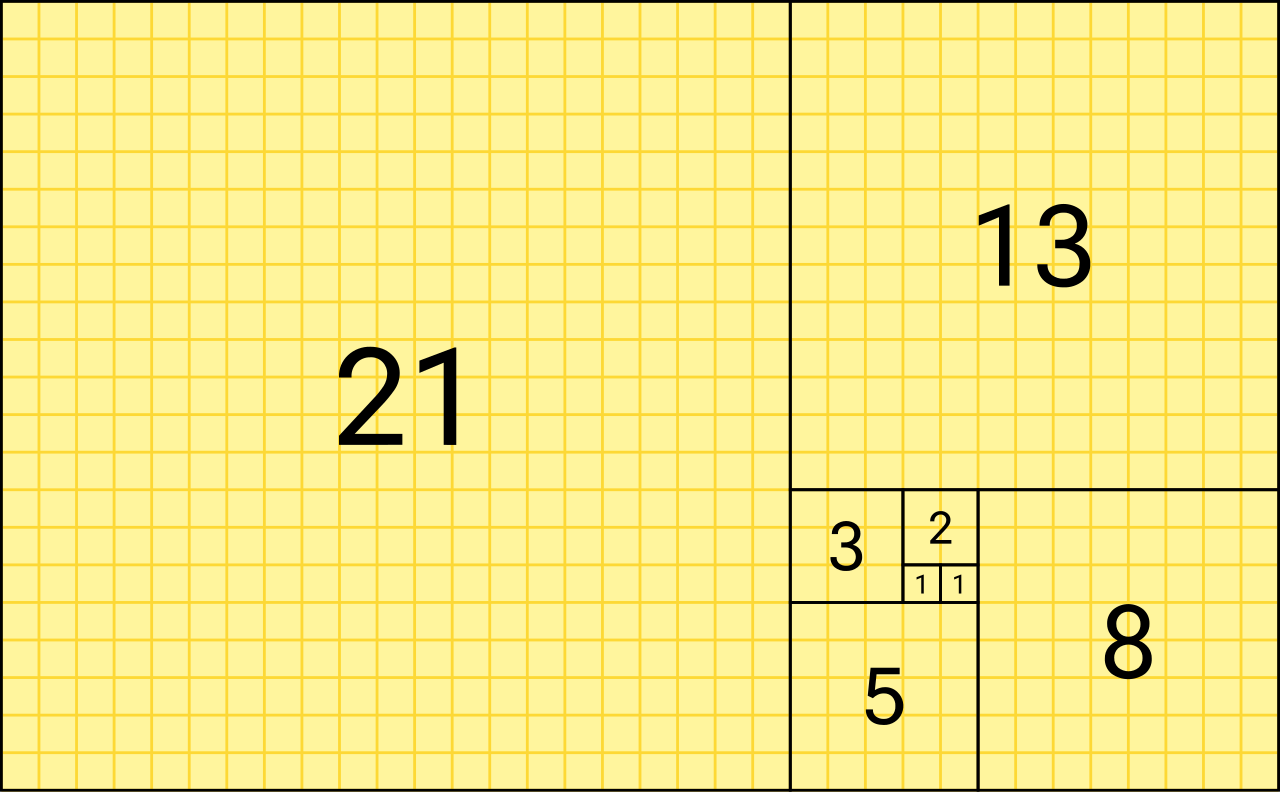
With work sized, we measure Agile velocity, the amount of work a team successfully completes during a single iteration. Agile velocity is typically measured in story points or ideal hours. If a team completes five user stories worth a total of 40 story points in Sprint 1, their velocity is 40. Over several sprints, this velocity stabilizes, providing a highly accurate, empirically derived forecasting metric for future releases.
Time and Flow
To measure the efficiency of the delivery pipeline, Agile practitioners track three vital temporal metrics:
- Lead time in agile measures the total time from a customer request to the delivery of the final product. The clock starts the moment the business asks for a feature and stops when it is in the hands of the user.
- Cycle time in agile measures the time required for a team to complete work on an item once work actively begins. The clock starts when a developer pulls a ticket from the backlog into "In Progress," and stops when development is complete.
- Throughput measures the number of items (such as features, bugs, or tickets) completed by an agile team within a specific time period (e.g., 15 tickets per week).
By shrinking Cycle time, teams inevitably increase Throughput and decrease Lead time, delivering value to the customer faster.
Visualizing the Flow
Agile metrics are practically useless if they are hidden in a spreadsheet. They must be mapped visually.
- A burn-down chart visually tracks the amount of work remaining across a project iteration. The line slopes downward, ideally hitting zero on the final day of the sprint. It answers the question: Are we on track to finish this sprint's commitment?
- Conversely, a burn-up chart visually tracks the amount of work completed toward the total project scope. It plots two lines: total work completed and total project scope. It is highly effective for release planning because it clearly reveals when the baseline scope is increasing faster than the team is delivering.
- A Cumulative Flow Diagram (CFD) shows the distribution of work items across different workflow states over time. Imagine a stacked area chart showing tickets in "Backlog," "In Progress," "Testing," and "Done." This chart is a diagnostic marvel. Bottlenecks in a Cumulative Flow Diagram appear as widening bands in specific workflow stages. If the "Testing" band on the CFD suddenly begins to thicken and widen, it mathematically proves that work is arriving at the testing stage faster than the testers can clear it. The flow has stalled.
Whether you are using predictive EVM or agile flow metrics, raw calculations require interpretation. As a project manager, you must deploy specific analytical techniques to formulate a response to the data.
Variance analysis compares baseline target metrics against actual project performance to identify deviations. We do not just report a negative Cost Variance; we analyze why it occurred (e.g., vendor price hikes, excessive rework) and determine the severity of the impact.
Trend analysis uses historical project results to predict future project performance. It looks beyond a single data point to identify a trajectory. If your Agile velocity over the last four sprints was 45, 42, 38, and 31, trend analysis raises an immediate red flag that team productivity is decaying, perhaps due to accumulating technical debt or team burnout.
Lastly, as risks materialize and variances drain your budget, you must utilize Reserve analysis. This technique evaluates the remaining project contingency reserves against remaining project risks. If you are halfway through the project but have exhausted 90% of your risk contingency budget, a severe financial vulnerability exists that must be escalated immediately.
The ultimate purpose of evaluating project status is to drive alignment and action among stakeholders. The metrics must leave the project manager's desk and enter the ecosystem.
In Agile and co-located (or virtually integrated) environments, we utilize Information radiators—highly visible displays of project metrics located in a shared team workspace. A physical kanban board, a large monitor displaying a CFD, or an automated burn-down chart are all information radiators. They require zero effort for a stakeholder to view; the information simply "radiates" into the environment, establishing total transparency.
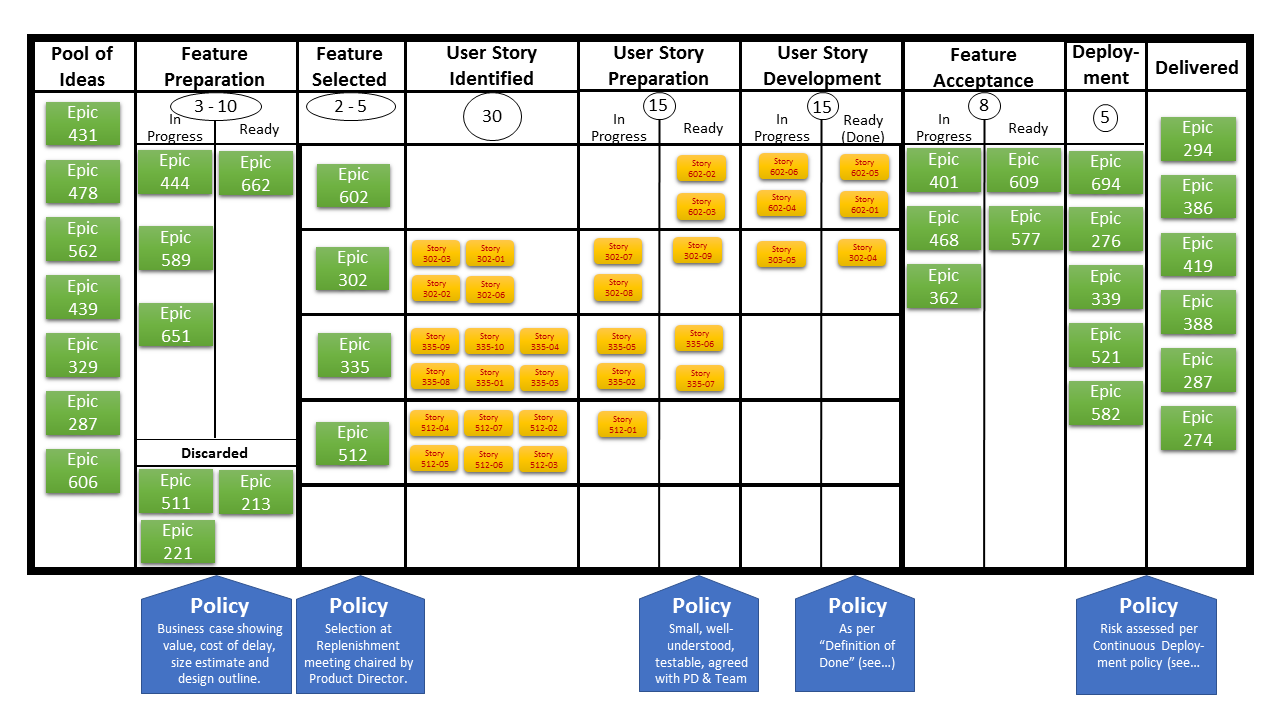
For broader stakeholder alignment, Project dashboards provide stakeholders with real-time summaries of key project performance indicators. These are highly curated, top-level views—often combining schedule SPI, cost CPI, and high-level risk trackers—allowing executives to grasp project health in seconds.
For formal, deeply contextual communication, we issue a status report. A status report formally communicates current project performance, risks, and forecasts to stakeholders. It contextualizes the Work Performance Reports, explaining the "why" behind the metrics and detailing the project manager's corrective action plan.
Finally, numbers on a page can never fully substitute for working software. In adaptive environments, Agile sprint reviews serve as a mechanism to demonstrate working software and communicate actual project progress. During this event, the team proves their progress not by showing an EVM chart or a high velocity number, but by putting verifiable, functional value into the hands of the customer.
Evaluating project status is an exercise in rigorous translation. You are translating the physical reality of human effort into raw data, analyzing that data into structured information, and synthesizing that information into compelling reports.
Whether you are calculating the Schedule Variance of a predictive pipeline or diagnosing a bottleneck on a Cumulative Flow Diagram, your objective remains identical: to unveil the truth of the project's current state. Master these metrics, and you replace the chaotic fog of project execution with the clarity, precision, and foresight required to steer any initiative to success.