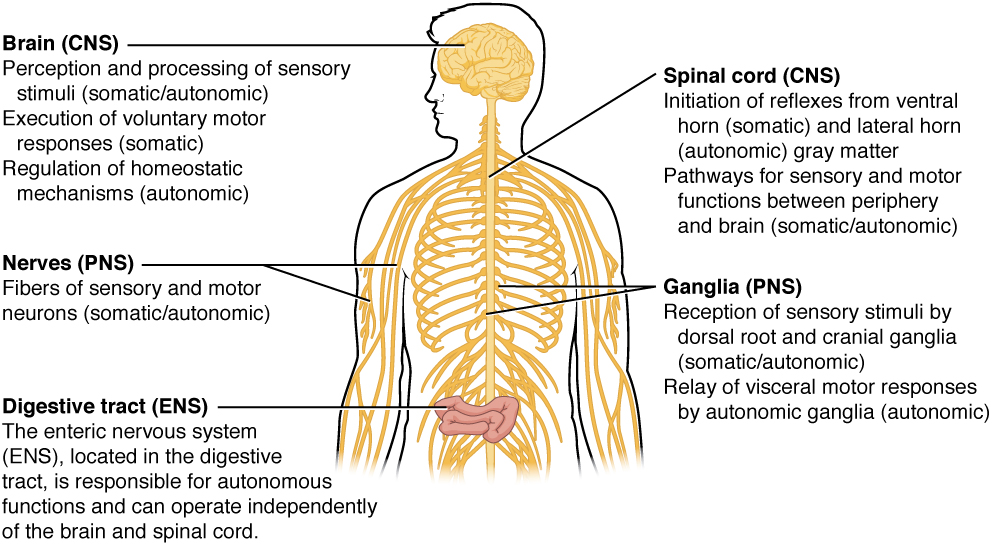
A modern enterprise operates like a biological organism. Its servers, databases, and networking components are the vital organs keeping the business alive, but for those organs to function cohesively, they require a central nervous system. Without the ability to sense a strain in capacity, measure a system's pulse, or react instantly to a critical failure, the organism is effectively flying blind. Azure Monitor serves as this central nervous system. It is the sensory architecture that allows a business—whether in IT, finance, or operations—to know precisely what is happening across its digital estate at any given microsecond.
Just as the nervous system connects and monitors the body's vital functions, Azure Monitor acts as the central sensory architecture for an enterprise's digital estate.
When an organization migrates to the cloud, visibility is no longer about walking into a server room and checking for blinking green lights. It is about capturing continuous streams of data and transforming them into actionable business intelligence.
Cloud migration shifts operational visibility away from physically inspecting server racks toward capturing continuous digital telemetry.
At its core, Azure Monitor is a comprehensive service for collecting, analyzing, and acting on telemetry data. Think of telemetry as the continuous stream of measurements transmitted from remote systems back to a central control room.
Telemetry enables centralized visibility, much like a mission control room receiving continuous diagnostic data from remote operational systems.
One of the most elegant aspects of Azure Monitor is its sheer reach and immediacy. Azure Monitor begins collecting basic resource metrics automatically upon the creation of an Azure resource. The moment an administrator spins up a virtual machine or provisions a database, Azure Monitor is already quietly taking its pulse. Furthermore, it does not discriminate by location: Azure Monitor collects telemetry data from both cloud and on-premises environments, allowing organizations to maintain a unified line of sight over hybrid infrastructures.
To make sense of the overwhelming volume of information generated by an enterprise, Azure Monitor primarily categorizes collected telemetry data into two distinct dialects: metrics and logs.
The Two Dialects of Telemetry
Understanding the difference between metrics and logs is foundational for anyone involved in cloud governance, from system engineers to project managers overseeing a product launch.
Metrics in Azure Monitor are numerical values that describe a system aspect at a specific point in time.
Imagine a heart rate monitor in an intensive care unit. It outputs a simple number: 75 beats per minute. In the cloud environment, metrics behave the same way. They might tell you that a server’s CPU usage is at 82%, or that a network connection is processing 500 megabytes per second. Because they are lightweight and numerical, metrics in Azure Monitor are highly responsive and are optimized for near real-time alerting.
Metrics behave much like heart rate monitors in an intensive care unit, providing lightweight, numerical data points optimized for near real-time alerting.
Logs in Azure Monitor contain time-stamped records of events, system changes, and errors.
If metrics are the heart rate monitor, logs are the patient’s detailed medical history. They provide context. A log entry might record that at 10:42 AM, a specific user attempted to access a database and failed due to an expired password. They contain rich, descriptive text about what happened and why.
In a sprawling enterprise, you might have hundreds of virtual machines, dozens of databases, and load balancers all generating logs simultaneously. If an engineer or security auditor had to log into each resource individually to read their records, the task would be impossible.
To solve this, Azure uses a Log Analytics workspace, which is a dedicated Azure storage environment for collecting and managing log data. Multiple distinct Azure resources can send their diagnostic logs to a single centralized Log Analytics workspace. This creates a massive, easily searchable repository of everything happening across your entire technology footprint.
Of course, a massive library is only useful if you have a way to find the specific book you need. Log Analytics is a tool within the Azure portal used to write and execute queries against Azure Monitor logs.
When analysts or IT managers need to investigate a sudden spike in website errors, they open the Log Analytics tool and interrogate the workspace. To do this, Log Analytics queries are written using the Kusto Query Language (KQL). KQL is a powerful, highly intuitive data-processing language designed to sift through millions of log records in seconds, filtering, sorting, and aggregating data to find the exact needle in the digital haystack.
Data observation without reaction is ultimately useless. If a company's e-commerce database runs out of storage space on Black Friday, looking at a dashboard an hour later is too late. The system must intervene automatically.
During high-traffic retail events like Black Friday, automated alerts and responses are critical to intervene before capacity constraints impact the business.
This is where Azure Monitor alerts proactively notify administrators when specific conditions are detected in telemetry data.
Behind the scenes, alert rules in Azure Monitor continuously evaluate incoming metrics and log data against defined thresholds. For example, an alert rule might be programmed to state: "If the metric for CPU utilization exceeds 90% for more than five minutes, sound the alarm."
But what exactly happens when that alarm sounds? Instead of hardcoding an email address into every single alert rule, Azure abstracts the response mechanism into an Action Group. An Action Group in Azure Monitor defines a reusable collection of notification preferences and automated actions.
By making Action Groups reusable, Azure drastically simplifies governance. If the lead infrastructure engineer leaves the company, you do not need to manually update 500 individual alert rules. You simply update the single "Critical IT" Action Group, and all associated alerts instantly route to the new engineer.
When triggered, Action Groups act as the muscle following the brain's command. They can execute two primary types of responses:
Notifications: Action Groups can send alert notifications to users via email, SMS, voice calls, or push notifications, ensuring stakeholders are reached wherever they are.
Automated Responses: For self-healing systems, Action Groups can trigger automated responses such as executing Azure Functions, Logic Apps, or Webhooks. This means a system can automatically reboot a frozen server or scale up compute power without human intervention.
Up to this point, Azure Monitor has been tracking the infrastructure—the servers, the network, the databases. But what about the software running on top of that infrastructure? A server might have plenty of memory and processing power, but if the web application's code is poorly written, the user experience will still be terrible.
Even with robust underlying server hardware, application-level bugs can severely degrade the user experience, highlighting the need for Application Performance Management tools.
To bridge this gap, Microsoft provides Application Insights, which is an Application Performance Management (APM) feature built into Azure Monitor.
While core Azure Monitor looks at the hardware and platform, Application Insights is used to monitor the performance, availability, and usage of live web applications. It gets inside the code, acting as a diagnostic tool for software developers and product managers alike. Because modern enterprises use diverse technology stacks, Application Insights supports applications built on multiple platforms including .NET, Node.js, Java, and Python.
Why Application Insights Matters to the Business
Application Insights is not just a tool for developers hunting down bugs; it is a critical business instrument. It offers three profound capabilities:
Automated Anomaly Detection: Application Insights automatically detects web application performance anomalies. By learning the normal baseline of your application, it can proactively warn your team if a sudden code update causes the checkout page to load a fraction of a second slower than usual.
Distributed Tracing: Modern applications are rarely single blocks of code. A user clicking "Purchase" might trigger a web frontend, an inventory microservice, a payment gateway, and a shipping database. Application Insights provides distributed tracing to track user requests across multiple backend application components. It draws a visual map of the transaction, instantly revealing exactly which microservice caused a bottleneck.
User Behavior Analysis: Beyond performance, Application Insights helps developers analyze user behavior and web application usage patterns. It answers questions critical to product managers and sales teams: Which features are users clicking the most? Where are they abandoning the application? Are they using the new dashboard we spent thousands of dollars developing?
By unifying infrastructure metrics, deeply searchable logs, automated alerts, and code-level application telemetry, Azure Monitor fundamentally transforms how an organization understands its own digital existence. It turns chaotic, silent systems into a coherent, self-reporting, and self-healing engine.