Imagine managing a fleet of commercial aircraft. You do not simply put planes in the sky and blindly hope they fly efficiently and safely; you rely on sophisticated onboard diagnostics to optimize fuel consumption, and you constantly monitor air traffic control for sudden weather delays or airspace closures. Running a cloud computing environment demands the exact same rigor. When an organization adopts Microsoft Azure, they instantly inherit a massively complex infrastructure. Rather than guessing how to reduce a bloated monthly invoice, or wondering whether an application outage is caused by a bad line of code or a localized data center failure, cloud professionals rely on centralized telemetry. In Azure, this continuous flow of diagnostic intelligence is channeled through two primary tools: Azure Advisor and Azure Service Health.
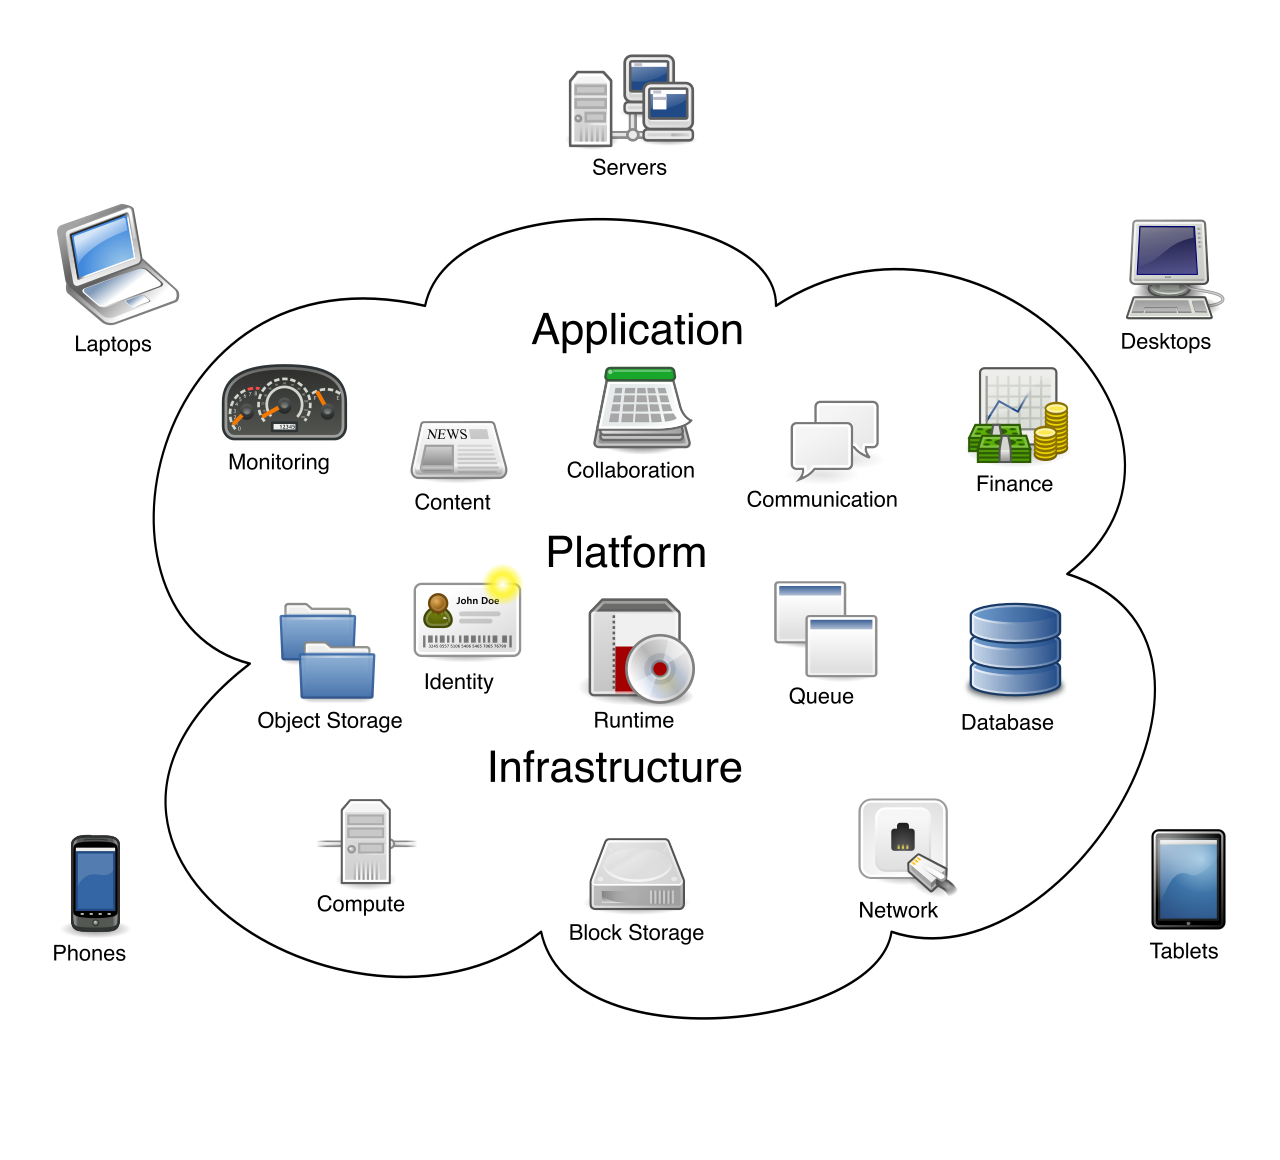
In cloud computing, users manage services abstractly rather than addressing the individual hardware and networking components that make up the provider's underlying data center infrastructure.
When you deploy virtual machines, databases, or networking components in the cloud, you are making architectural decisions. Are those decisions optimal? Without measurement, you cannot know.
Azure Advisor is a free service built into Azure that provides personalized recommendations to optimize Azure deployments. It functions as an automated cloud consultant. Instead of relying on static checklists, Azure Advisor actively analyzes resource configuration and usage telemetry to generate actionable optimization recommendations tailored specifically to your environment.
To make sense of this massive influx of telemetry, Azure Advisor groups its optimization recommendations into five distinct categories. Whether you are a financial controller seeking to protect the budget or a security engineer hardening the perimeter, there is a pillar dedicated to your operational goals:
Advisor Category
Focus Area
Why It Matters to Your Business
Cost
Identifies idle or underutilized resources to help organizations reduce overall Azure spending.
A project manager or finance stakeholder can easily see if a massive, expensive virtual machine is sitting idle on a weekend, allowing them to right-size the resource and save money.
Security
Integrates directly with Microsoft Defender for Cloud to highlight potential security vulnerabilities.
Recommends solutions to improve the availability and business continuity of critical Azure applications.
Ensures your architecture can survive a localized hardware failure by suggesting redundancy strategies, like placing virtual machines into Availability Sets.
Performance
Suggests architectural changes to improve the speed and responsiveness of Azure resources.
Recommends optimizations like upgrading to a higher database tier or implementing a Content Delivery Network (CDN) to reduce latency for your end users.
Operational Excellence
Provides best practices for process improvement and resource manageability.
Alerts you to invalid alert rules or suggests using Azure Policy to enforce compliance, ensuring your cloud governance remains strictly organized.
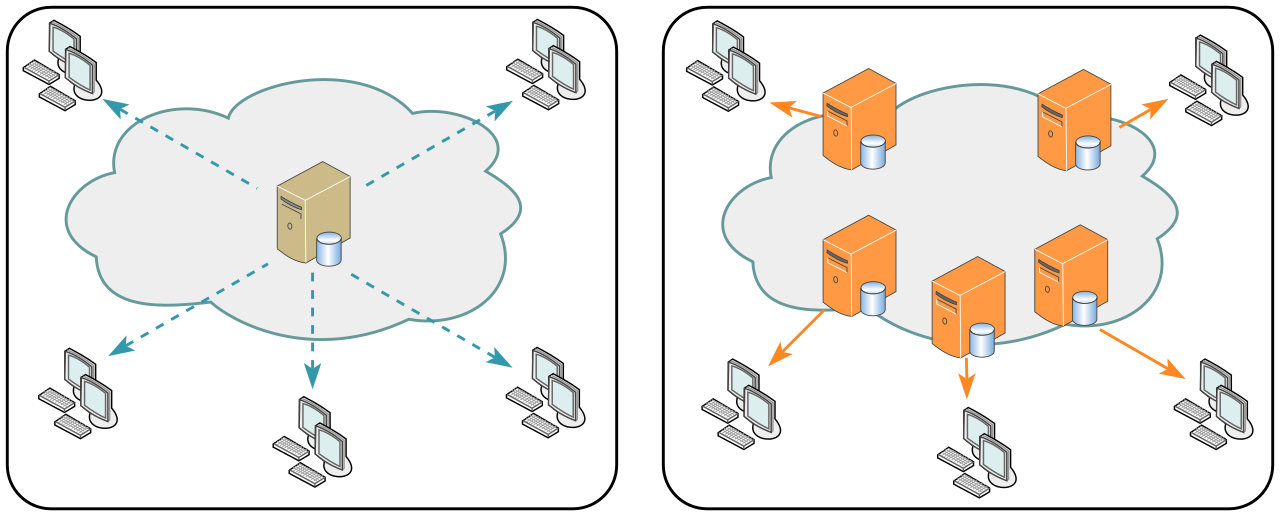
Implementing a Content Delivery Network (CDN) optimizes performance by distributing traffic across multiple regional nodes, reducing latency compared to a single-server architecture.
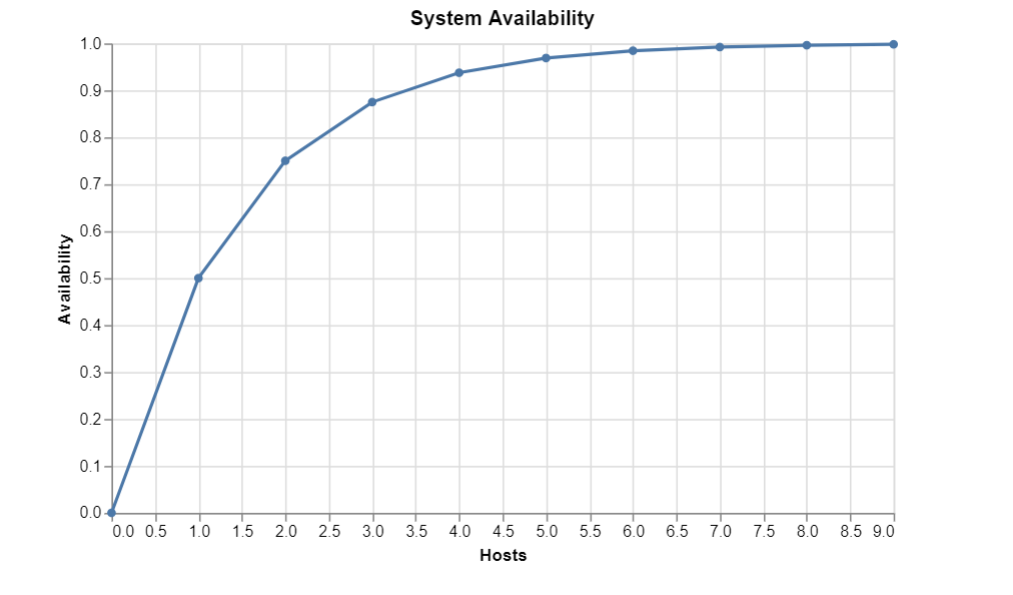
Redundancy strategies, such as deploying multiple independent host instances in parallel, dramatically increase overall system reliability and ensure high availability if a localized hardware failure occurs.
The Prioritization Problem: Having a list of fifty recommendations is overwhelming. To solve this, Azure Advisor calculates an Advisor Score. This scoring mechanism helps administrators prioritize recommendations based on the potential impact of the proposed changes. You address the highest-impact scores first.
Furthermore, cloud environments are nuanced. A "security vulnerability" in a heavily isolated, temporary testing lab might be a calculated risk you are willing to take. Therefore, administrators can manually postpone or dismiss specific Azure Advisor recommendations. Doing so filters out the noise and allows you to customize the compliance score for the target environment, ensuring your dashboard strictly reflects meaningful, actionable data.
Azure Advisor helps you look inward at your own architectural choices. Azure Service Health, conversely, helps you look outward at the physical Microsoft data centers running your code.
Despite the sheer scale and resilience of the cloud, hardware occasionally degrades, fiber-optic cables get severed, and platform outages occur. Azure Service Health is a suite of tracking experiences that provides personalized guidance when Azure service issues affect user resources.
Azure Service Health provides outward visibility into physical infrastructure disruptions that affect the cloud platform, such as hardware degradation or severed fiber-optic cables.
To help you pinpoint exactly how an incident impacts your business, the Azure Service Health suite consists of three distinct tracking dashboards, zooming from a macro, global view all the way down to a micro, resource-specific view:
1. Azure Status (The Macro View)
Azure Status provides a broad global view of the health of all Azure services across all Azure regions. If you hear a rumor that "the cloud is down on the East Coast," this public-facing page is your first stop to see if Microsoft is experiencing a massive, region-wide outage.
2. Service Health Dashboard (The Personalized View)
While Azure Status shows the whole world, the Service Health dashboard tracks ongoing service incidents that specifically affect the Azure services and regions a user is currently utilizing. If a database service goes down in Europe, but your company only operates in North America, your Service Health dashboard will remain clear.
Crucially, the Service Health dashboard is not just for emergencies; it also provides notifications for upcoming planned maintenance events that could impact a user's specific Azure environment. This allows IT and project management teams to plan their own downtime windows well in advance.
3. Resource Health (The Micro View)
The Resource Health dashboard displays the current health status of individual Azure resources within a user's subscription (for example, a single, specific Virtual Machine).
Platform Issue vs. User Error: This dashboard answers one of the most critical questions in IT troubleshooting: "Is it my fault, or Microsoft's fault?" The Resource Health dashboard helps determine if a specific resource failure is due to an underlying Azure platform issue (such as a physical server failing in the data center) or a user configuration error (such as a developer accidentally breaking the operating system).
Taking Automated Action
Information is only valuable if you can act on it. You do not have time to sit and stare at a dashboard waiting for a service disruption. Administrators can configure Azure Service Health alerts to proactively notify stakeholders.
For human intervention, administrators can configure these alerts to send notifications via email or SMS when an Azure service incident occurs. For advanced technical teams, alerts can be configured to trigger automated incident response actions via webhooks during service disruptions. If a region goes down, a webhook can automatically instruct your systems to reroute web traffic to a healthy backup region or immediately generate a high-priority ticket in your IT service management software.
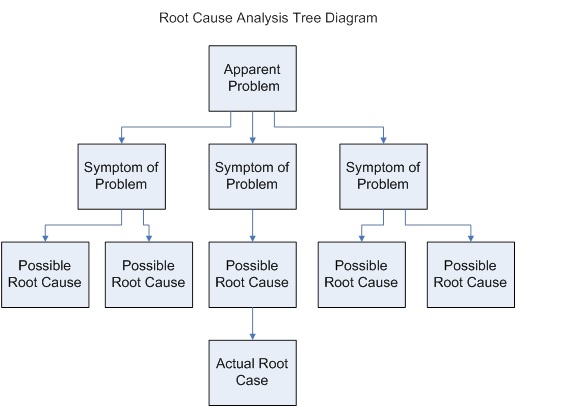
Finally, when the dust settles from a major incident, transparency is required. Executives and clients will demand to know what happened. To satisfy this, Azure Service Health provides official Root Cause Analysis (RCA) reports after a widespread Azure service incident is resolved. You can download these RCA reports and hand them directly to your stakeholders, proving exactly what failed, how Microsoft fixed it, and what steps are being taken to prevent a recurrence.
Root Cause Analysis (RCA) diagrams help stakeholders trace an incident systematically from its outward symptoms down to the fundamental underlying failure.