Debuggers, Multipurpose, and Cloud Tools
Not sure you’re ready?
Take the ~3-minute readiness diagnostic and see where you stand.
To defend a complex system, one must be able to observe its mechanics in motion, shifting perspectives from the microscopic behavior of CPU registers to the vast, ethereal logic of cloud APIs. A Security Operations Center (SOC) analyst cannot rely solely on the abstraction of alerts and dashboards. To understand the true nature of an intrusion or a vulnerability, the analyst must interrogate the environment directly. This interrogation requires specialized instruments to freeze binary execution, probe network surfaces, and audit infrastructure as code. By mastering debuggers, multipurpose scanning frameworks, and cloud assessment tools, an analyst bridges the gap between theoretical vulnerability and practical, observable reality.

When a suspicious executable is found on a workstation, or a system crashes under the weight of an unseen exploit, you are no longer dealing with networks or logs. You are dealing with raw machine instruction. To understand this level of the machine, we use a debugger, which is a software tool used to test and analyze the execution flow of another program.
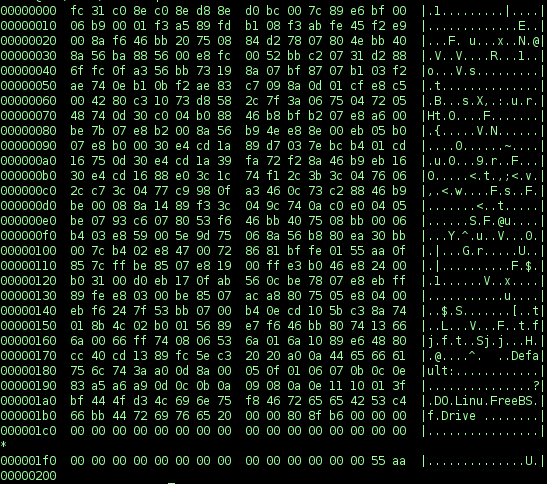
If you imagine a compiled program as a complex clockwork mechanism spinning at billions of cycles per second, a debugger is the tool that allows you to freeze time. Debuggers allow analysts to pause program execution at specific memory addresses using breakpoints. By setting a breakpoint just before a suspicious function is called, the analyst forces the CPU to halt. Once the program is paused, stepping through code in a debugger allows an analyst to observe CPU register changes instruction by instruction. You are watching the tumblers of the machine's lock fall into place, revealing exactly how a program manipulates memory, processes input, or unpacks a hidden payload.
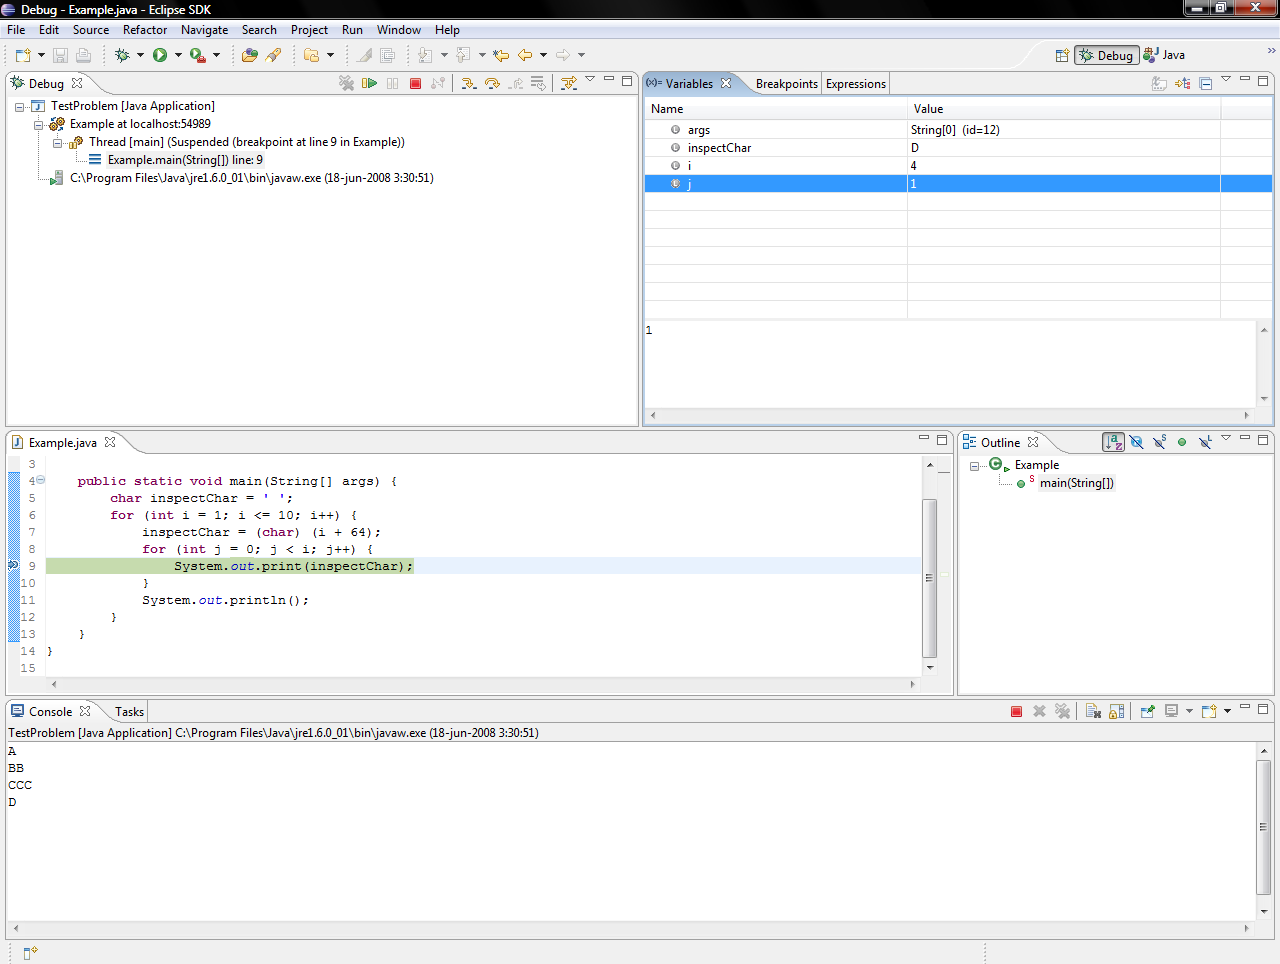
In the context of incident response and threat intelligence, security analysts use debuggers to reverse engineer malware and analyze exploit payloads. When an attacker uses obfuscation to hide their code from antivirus software, a debugger allows the analyst to capture the code in memory after it has unpacked itself but before it executes its malicious objective.
Depending on the environment and the target, analysts rely on highly specialized debuggers:
| Debugger | Primary Use Case and Environment |
|---|---|
| GDB (GNU Debugger) | A command-line debugger commonly used for analyzing compiled programs on Linux environments. It is the gold standard for Unix-like systems, allowing analysts to trace execution paths in C, C++, and Rust binaries. |
| WinDbg | A multipurpose debugger used to analyze Windows crash dumps and kernel-mode execution. When a sophisticated rootkit causes a Blue Screen of Death (BSOD), WinDbg is the tool used to analyze the resulting memory dump to find the exact driver or memory violation that caused the crash. |
| OllyDbg | A 32-bit assembler level analyzing debugger used primarily for binary code analysis. It excels at reverse engineering 32-bit Windows binaries where the original source code is unavailable, featuring an intuitive interface for tracing assembly instructions. |
Analyst Application: You do not need to be a full-time reverse engineer to benefit from understanding debuggers. Knowing how to read the register state at the moment of a crash helps a SOC analyst determine if a service failure was a random software bug or a deliberate buffer overflow attempt.
Stepping back from the microscopic view of binary execution, analysts must evaluate the macroscopic network. We map the attack surface using multipurpose frameworks—tools designed to interrogate hosts at scale and validate the real-world impact of discovered flaws.
Network Discovery with Nmap
Nmap is an open-source multipurpose tool used for network discovery and security auditing. While it is famous for basic port scanning, its true power lies in its ability to interrogate services. Analysts evaluate Nmap output to identify open ports, running services, and specific software versions on a target host. Knowing a port is open is trivia; knowing exactly what daemon is listening is actionable intelligence.
To extract this intelligence, analysts rely on specific execution flags:
- Nmap OS fingerprinting is invoked using the
-Ocommand-line flag. By analyzing how a target responds to malformed TCP/IP packets, Nmap can deduce the underlying operating system. - Nmap service version detection is invoked using the
-sVcommand-line flag. This forces Nmap to grab banners and exchange data with the listening service to pinpoint the exact software release (e.g., discovering an outdated Apache 2.4.49 server rather than just "port 80 open").
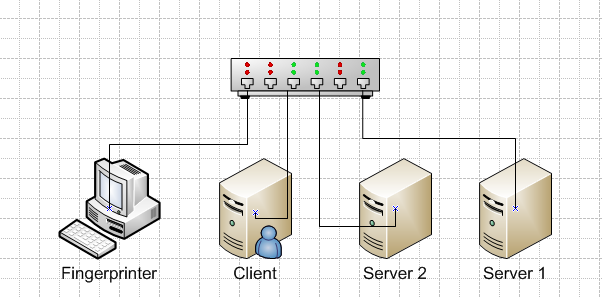
Beyond basic enumeration, Nmap can dynamically interact with hosts. The Nmap Scripting Engine (NSE) allows users to write and share scripts to automate vulnerability detection. Instead of manually testing a service, an analyst can deploy an NSE script designed to check for a specific CVE. Consequently, analyzing Nmap Scripting Engine (NSE) script output helps security analysts confirm the presence of specific vulnerabilities on a scanned host without needing a heavy, commercial vulnerability scanner.
Vulnerability Validation with Metasploit
Discovering a vulnerability is only half the battle; validating its exploitability is what drives prioritization in a SOC. Metasploit is an open-source multipurpose penetration testing framework used to develop and execute exploit code against a remote target.
However, firing live exploits on a production network is often too risky for everyday operations. Because of this, vulnerability management teams use Metasploit auxiliary modules to scan for and verify vulnerabilities without exploiting the target. Auxiliary modules act like a detective rattling a doorknob—they check if the door is unlocked without actually stepping inside the house.
When an exploit is necessary during a sanctioned penetration test or red team exercise, Security Operations Center (SOC) analysts analyze Metasploit output to confirm whether a reported vulnerability is practically exploitable in a specific environment. A vulnerability scanner might flag a missing patch, but if network segmentation or an endpoint detection tool blocks the exploit chain, the practical risk is lowered.
If an exploit is successful, the framework must deploy a payload. Metasploit Meterpreter is an advanced, dynamically extensible payload that provides interactive control over a compromised system. Unlike a standard remote shell, Meterpreter resides entirely in memory (evading basic disk-based forensics) and allows the operator to migrate between processes, dump password hashes, and pivot into internal networks.
To manage the massive amount of data generated during these operations, the Metasploit framework uses a backend database to store and organize scan results, hosts, and vulnerability data. By connecting to a PostgreSQL database, an analyst can query which machines on a subnet are vulnerable to a specific exploit, turning scattered scan data into organized, relational intelligence.
The physical network and the binary application are bounded environments. The cloud, however, is a sprawling web of Application Programming Interfaces (APIs), Identity and Access Management (IAM) roles, and virtualized resources. You cannot attach a debugger to an Amazon S3 bucket, nor can you easily Nmap a serverless Lambda function. Instead, cloud security requires auditing the configuration logic itself.
API-Driven Auditing: Scout Suite and Prowler
To assess the cloud, we must speak its language: APIs.
Scout Suite is an open-source multi-cloud security auditing tool. Because modern enterprises rarely rely on a single vendor, Scout Suite supports auditing for major cloud providers including Amazon Web Services (AWS), Microsoft Azure, and Google Cloud Platform (GCP).
Rather than sending packets to IP addresses, Scout Suite interacts with cloud provider application programming interfaces (APIs) to gather configuration data and highlight security risks. It pulls down the routing tables, IAM policies, and storage configurations, parsing them for logical flaws. Once the data is gathered, Scout Suite generates a local HTML report detailing the security posture of an assessed cloud environment. This report is highly visual, allowing teams to quickly drill down into specific failures. Crucially, security analysts use Scout Suite output to identify overly permissive Identity and Access Management (IAM) policies in cloud environments, such as developers who have been granted wild-card (*) administrative rights.
While Scout Suite is excellent for visual reporting, continuous monitoring often requires a more rigid, compliance-driven approach. Prowler is an open-source command-line tool used to perform cloud security best practices assessments. What sets Prowler apart is its alignment with industry standards: Prowler automatically evaluates cloud environment configurations against the Center for Internet Security (CIS) benchmarks.
To do this securely, Prowler utilizes temporary cloud provider credentials to run read-only API calls that enumerate resources and check security controls. This guarantees the tool cannot inadvertently alter the environment it is auditing. Analysts use Prowler output to rapidly detect publicly accessible cloud storage buckets and unencrypted data stores—two of the most common causes of catastrophic cloud data breaches.
Because modern SOCs rely on central dashboards, standalone reports are often insufficient. To integrate these findings into the daily workflow, Prowler supports exporting assessment results in formats including CSV, JSON, and HTML for ingestion into Security Information and Event Management (SIEM) tools. This allows cloud configuration drifts to trigger the same SOC alerts as a malware execution on an endpoint.
Cloud-Specific Deep Dives: Cloudsplaining and Pacu
As cloud environments grow, IAM becomes the new perimeter. If an attacker compromises an identity, they do not need to exploit software—they simply log in.
To combat this, analysts use highly specialized tools. Cloudsplaining is an Amazon Web Services (AWS) Identity and Access Management (IAM) security assessment tool. While tools like Prowler look at broad infrastructure, Cloudsplaining zeroes in on the complex JSON documents that define AWS permissions. Cloudsplaining parses IAM policies to identify violations of least privilege, such as unintentional resource exposure or privilege escalation risks. It maps out exactly which roles can pass permissions to other roles, effectively highlighting the "attack paths" hidden within administrative policies.
Finally, just as Metasploit validates network vulnerabilities, analysts need a way to validate cloud monitoring. Pacu is an open-source Amazon Web Services (AWS) exploitation framework designed for offensive security testing in cloud environments. Think of it as the Metasploit of AWS. Pacu modules allow analysts to test the effectiveness of cloud security monitoring by simulating privilege escalation and data exfiltration attacks.
Why This Matters: If your SOC has written an alert to detect an attacker copying an entire S3 bucket to an external account, you must prove the alert works. Using Pacu, an analyst can safely simulate that exact exfiltration API call. If the SIEM does not sound the alarm, the analyst knows the monitoring strategy has failed before a real adversary ever strikes.
By mastering this spectrum of tools—from the memory-level precision of GDB to the network reality of Nmap and Metasploit, all the way to the API-level oversight of Scout Suite and Pacu—an analyst gains absolute visibility. You transition from a passive observer of alerts to an active interrogator of the digital environment.