Vulnerability Assessment Tools
Not sure you’re ready?
Take the ~3-minute readiness diagnostic and see where you stand.
To defend a digital environment, one must first understand its physical and logical topography. A network is not an abstract cloud; it is a sprawling, interconnected metropolis of routing tables, listening daemons, and application states. For a Security Operations Center (SOC) analyst, the ability to rapidly map this infrastructure, interrogate its defenses, and visualize its vulnerabilities is the difference between blindly reacting to an alert and surgically dismantling an attack sequence. Vulnerability assessment tools serve as our surveying instruments, allowing us to quantify the exposure of our network perimeters, trace the footprints of adversaries, and ruthlessly audit the resilience of our web applications before a threat actor exploits them.
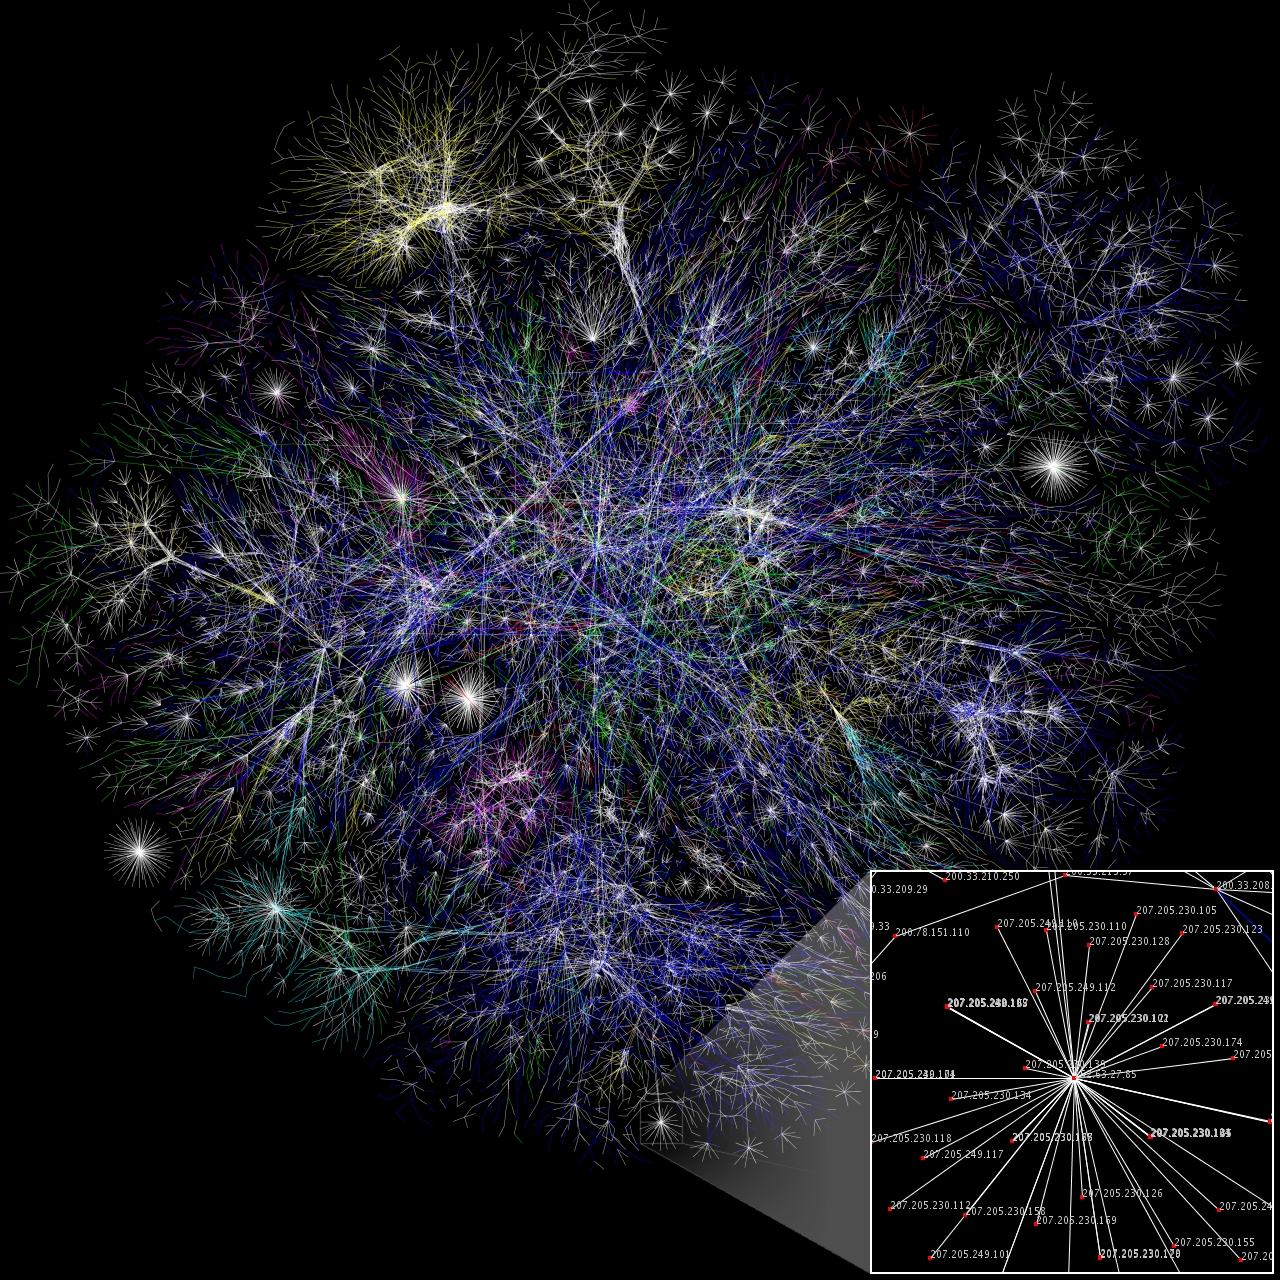
Before we can patch a vulnerability or isolate a compromised host, we must know what exists. Network mapping and scanning tools are designed to systematically probe IP spaces, deciphering what devices are alive and what services they offer to the world.
Nmap: The Analyst’s Scalpel
At the core of network reconnaissance is Nmap. When we execute an Nmap scan, we are not simply asking a machine if it is turned on; we are firing precise combinations of TCP, UDP, and SCTP packets at target ports and analyzing the microscopic nuances of the returned packets.
Nmap classifies the ports it probes into highly specific states. When Nmap identifies a port as open, it means an application is actively accepting TCP connections, UDP datagrams, or SCTP associations on that port. This is the ultimate goal of an attacker—a listening service that can be interacted with.
Conversely, Nmap identifies a port as closed when the port receives and responds to probe packets, but no application is listening on that port. Think of this as walking up to a building and knocking on the door: someone answers and explicitly tells you, "No one is home." The machine is alive, but the specific avenue is sealed.
The most ambiguous state is when Nmap identifies a port as filtered. This occurs when packet filtering—such as a firewall, router rules, or host-based security—prevents probes from reaching the port entirely, meaning Nmap cannot determine the port state. The packets are simply dropped into a black hole, leaving you blind to what lies behind the filter.
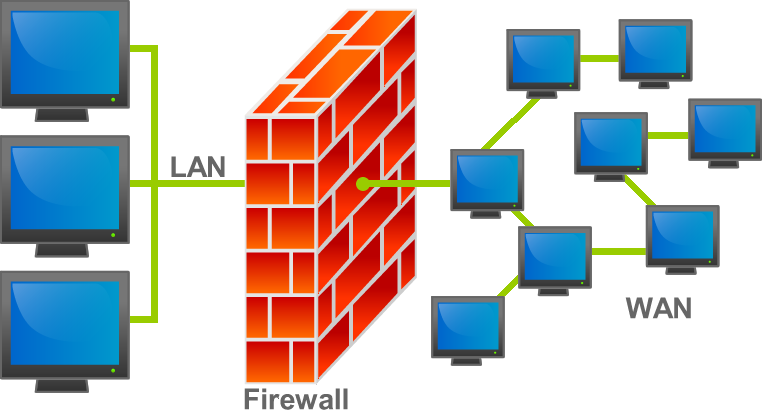
Why this matters for SOC Analysts: Understanding these states dictates your incident response. If an alert fires for an exploit attempt against a specific host, but your scan shows the targeted port is closed, the attack failed by definition. If the port is filtered, your firewall caught it. If it is open, you must immediately pivot to log analysis to see if the exploit succeeded.
Furthermore, analyzing the results of a massive network sweep requires versatile output formats. Nmap provides human-readable normal output using the -oN flag, giving you a clean terminal display to read on the fly. However, human readability does not scale. Nmap provides Extensible Markup Language (XML) output using the -oX flag. Analyzing Nmap Extensible Markup Language (XML) output allows security analysts to automate the parsing of network scanning results using custom scripts—for example, piping scan results directly into a Python script to update your SIEM's asset inventory. Finally, Nmap provides greppable output designed for command-line text processing tools using the -oG flag, allowing an analyst to swiftly use tools like [awk](https://en.wikipedia.org/wiki/AWK) or [grep](https://en.wikipedia.org/wiki/grep) to extract specific IP addresses hosting vulnerable services.
Angry IP Scanner: The Broad Survey
When you do not need the deep, surgical precision of Nmap, but rather a rapid census of a vast subnet, you turn to the Angry IP Scanner. Angry IP Scanner is a cross-platform network scanner designed to quickly discover live hosts and open ports within a specified IP range.
Speed is its primary virtue. Angry IP Scanner uses multi-threading to parallelize network probes for faster scanning of large subnets. Instead of waiting for one host to respond before moving to the next, it sends hundreds of concurrent probes, dramatically accelerating the discovery phase during an active incident.
The Angry IP Scanner output includes the IP address, ping response time, hostname, and a list of open ports for each discovered host. It utilizes a highly intuitive visual system in its graphical user interface:
- A red dot indicates that a scanned IP address is unresponsive to ping requests.
- A blue dot indicates that a scanned IP address is alive and responded to ping requests, but no queried ports were found open.
- A green dot indicates that a scanned IP address is alive and has open ports.
During a malware outbreak, an analyst can sweep a /16 subnet with Angry IP Scanner, filter strictly for "green dot" hosts showing port 445 (SMB) open, and instantly prioritize machines for isolation.
Once we step beyond our internal perimeter, we enter the realm of Open-Source Intelligence (OSINT). Incident responders frequently uncover malicious IP addresses, suspect domains, or phishing emails. To understand the threat, we must visualize how these disparate artifacts connect.
Maltego is an open-source intelligence and graphical link analysis tool used for gathering and connecting information for investigative tasks. Instead of rows in a spreadsheet, Maltego visualizes data as an entity relationship graph.
In Maltego, an entity represents a specific piece of information such as an IP address, domain name, email address, or person. To bridge the gap between these entities, we use transforms. In Maltego, transforms are scripts that query external data sources (like WHOIS databases, DNS records, or threat intelligence feeds) to find relationships between a selected entity and other entities.
When you run a transform on a suspect domain, Maltego queries the internet and generates new entities on your screen. Maltego nodes connected by lines represent direct relationships discovered through the execution of data transforms.
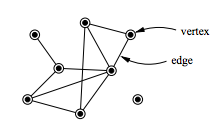
The Analyst's Application: Security analysts use Maltego graphs to visually map out the infrastructure and organizational structure of potential threat actors. If you trace a phishing email (Entity A) to a domain (Entity B), run a transform to find the registered IP (Entity C), and discover that IP hosts twenty other malicious domains, you have just mapped an adversary's entire command-and-control infrastructure.
Networks are only half the battle. Today, the most devastating breaches originate at Layer 7—the application layer. To assess these, we rely on dynamic application security testing (DAST) tools like Burp Suite and OWASP Zed Attack Proxy (ZAP). These tools act as automated interrogators, bombarding a web application with malicious payloads to observe how it reacts.
Burp Suite Professional
Burp Suite Professional includes an automated web vulnerability scanner that crawls and audits web applications. It maps the application's attack surface and systematically tests every input field, cookie, and header.
When conducting an automated scan, the Burp Suite Issue Activity tab displays real-time results of automated web application scanning tasks. To make the data actionable, Burp Suite categorizes discovered vulnerabilities by severity using the labels High, Medium, Low, and Information. A 'High' severity issue in Burp Suite indicates a vulnerability that allows an attacker to compromise the application or access sensitive data—such as a remote code execution or authentication bypass.
However, severity alone is insufficient. Scanners must also express their certainty. Burp Suite categorizes discovered vulnerabilities by confidence using the labels Certain, Firm, and Tentative. A 'Tentative' confidence rating in Burp Suite indicates that the scanner found evidence of a vulnerability without absolute confirmation. For instance, if the scanner observes a time delay after injecting a payload, it might tentatively flag a blind SQL injection, but the delay could simply be network latency.
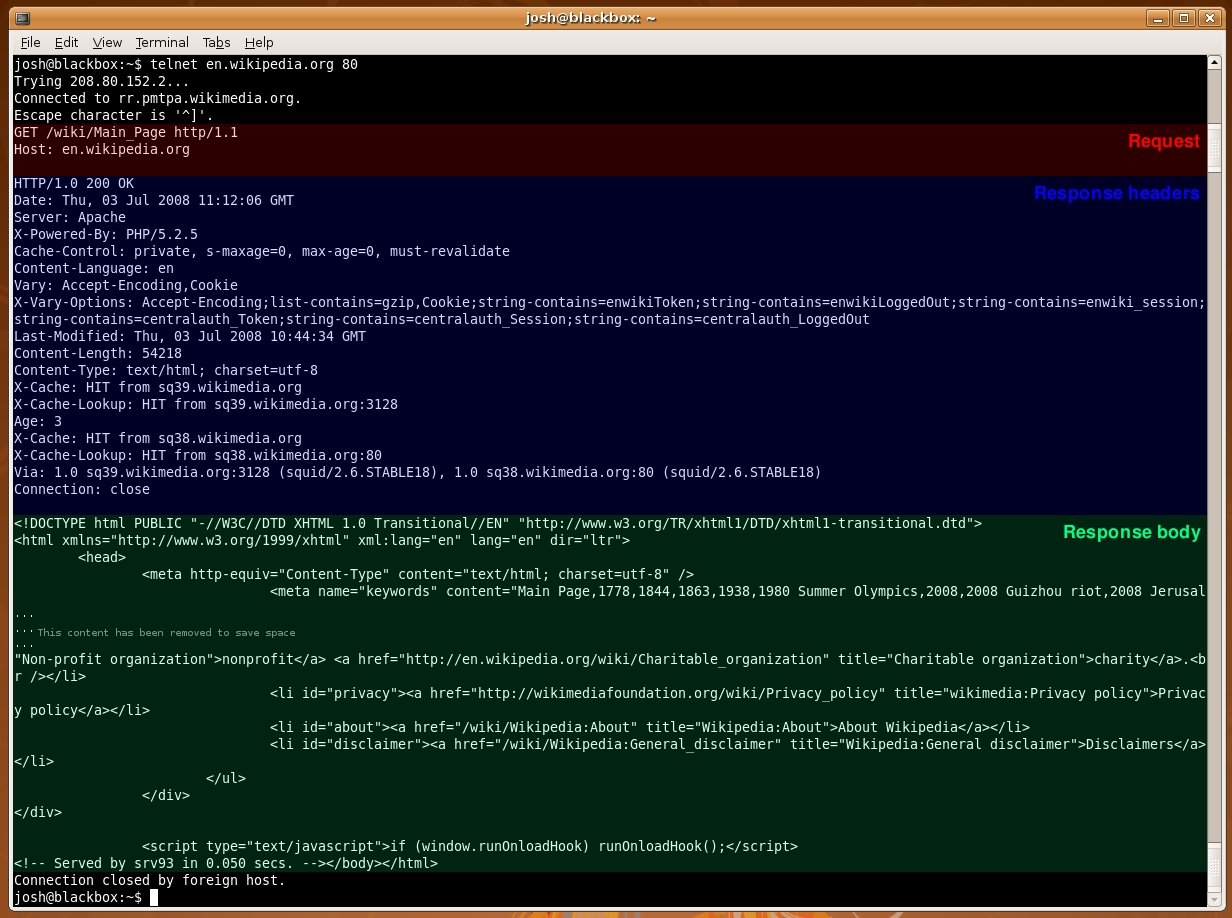
Crucially, when validating these findings, analysts are not left guessing. Burp Suite scanner results include the exact HTTP request that triggered the vulnerability alongside the corresponding HTTP response from the server, allowing the analyst to verify the mechanics of the flaw directly.
OWASP Zed Attack Proxy (ZAP)
A powerful alternative is OWASP Zed Attack Proxy (ZAP), an open-source web application security scanner designed to find vulnerabilities in web applications.
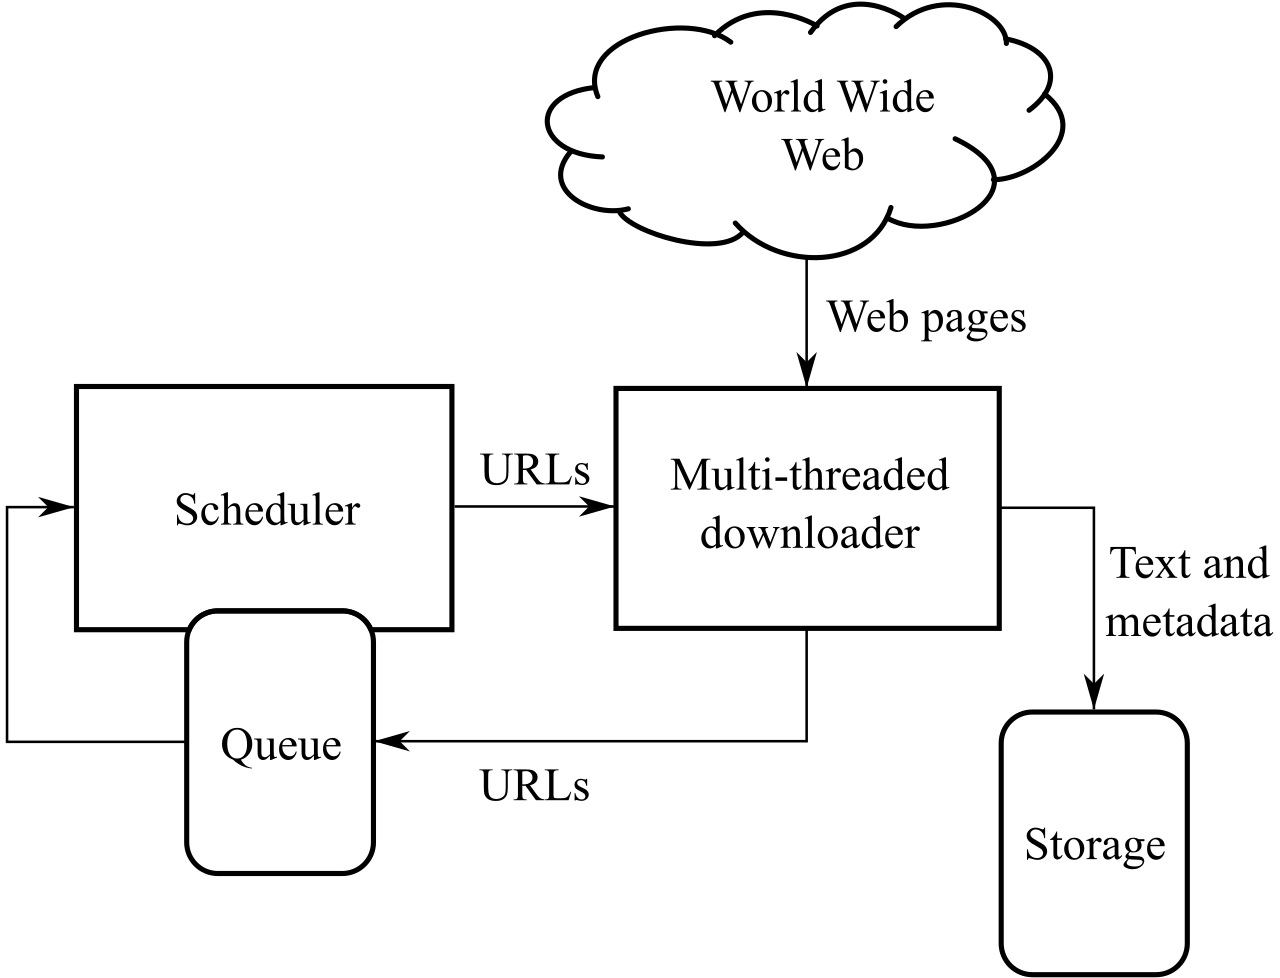
To understand the structure of the target, OWASP Zed Attack Proxy uses a spidering tool to automatically discover links, URLs, and pages within a target web application. It navigates the site like an algorithmic user, compiling a comprehensive sitemap.
ZAP operates using two distinct methodologies:
- Passive scanning in OWASP Zed Attack Proxy analyzes HTTP traffic between the browser and the web application without modifying the requests. It simply watches the flow of data, looking for missing security headers, exposed sensitive data, or misconfigured cookies.
- Active scanning in OWASP Zed Attack Proxy modifies HTTP requests to inject malicious payloads and observe the web application responses. This is the aggressive phase where XSS strings and SQL commands are hurled at the server.
The OWASP Zed Attack Proxy Alerts tab displays a categorized list of all potential vulnerabilities discovered during scanning. ZAP uses a highly visual, color-coded flag system to denote risk:
- OWASP Zed Attack Proxy flags an alert with a red flag icon to indicate a High Risk vulnerability.
- OWASP Zed Attack Proxy flags an alert with an orange flag icon to indicate a Medium Risk vulnerability.
- OWASP Zed Attack Proxy flags an alert with a yellow flag icon to indicate a Low Risk vulnerability.
- OWASP Zed Attack Proxy flags an alert with a blue flag icon to indicate an Informational alert.
When active scanning yields results, understanding the underlying vulnerability is paramount.
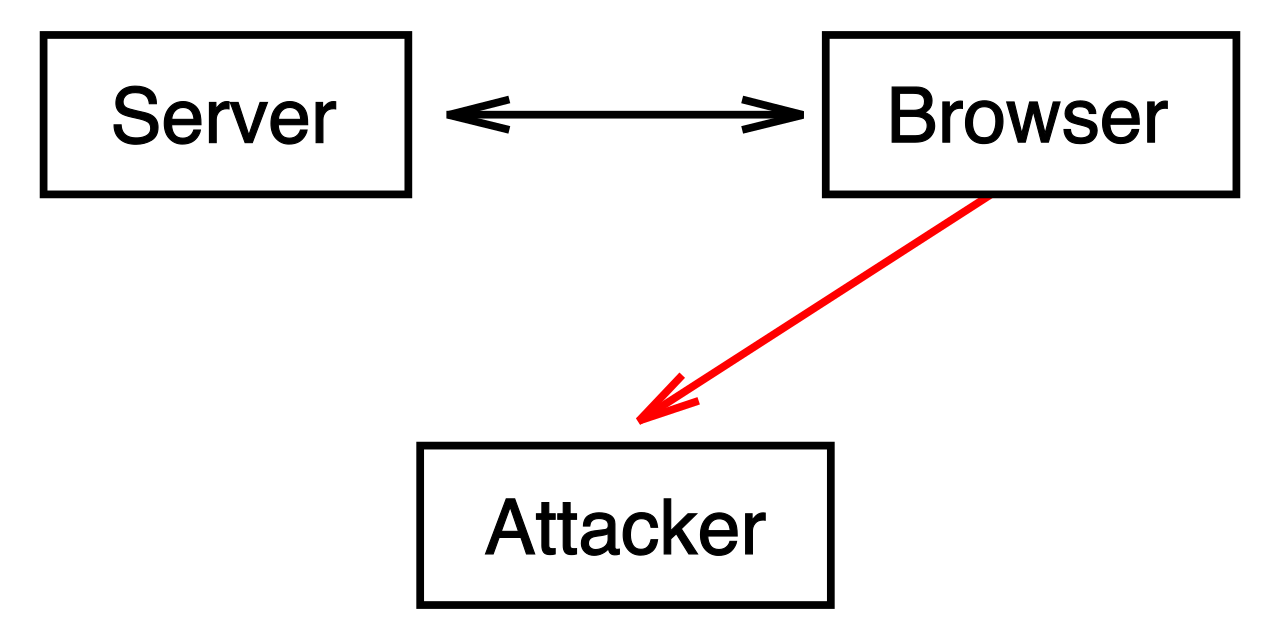
Consider Cross-Site Scripting (XSS). Web application scanner output detailing reflected Cross-Site Scripting indicates that user input is immediately returned in an HTTP response without sanitization. If the scanner injects <script>alert(1)</script> into a search bar, and the server blindly echoes that script back into the HTML of the results page, the browser will execute it.
Similarly, web application scanner output detailing SQL injection indicates that user input successfully altered a backend database query. The scanner achieves this by injecting SQL syntax operators (like ' OR 1=1 --) and observing if the application returns database errors, altered data sets, or structural changes to the page.
The Limits of Automation: The Analyst's Burden
While scanners are incredibly powerful, they are fundamentally imperfect machines. They suffer from two distinct failure modes:
- False positives occur when a vulnerability scanner incorrectly flags benign behavior as a security vulnerability. A scanner might flag an input field as vulnerable to XSS simply because it saw the word
scriptin the response, even if the application safely encoded the output. - False negatives occur when a vulnerability scanner fails to detect an existing security vulnerability. The flaw is there, but the scanner's payloads weren't quite right to trigger it, leaving you with a dangerous blind spot.
Because of this inherent unreliability, security analysts must manually verify web application scanner results to filter out false positives and confirm actual risks. You must look at the exact HTTP request and response, replicate the attack manually, and prove the exploitability of the finding.
Finally, one must recognize the ultimate boundary of automated tools. Web application vulnerability scanners struggle to accurately detect logic flaws or access control vulnerabilities without manual configuration. A scanner does not understand the business logic of an application. It does not know that User A should not be able to view User B's banking details; it only sees that a webpage loaded successfully with a [200 OK](https://en.wikipedia.org/wiki/List_of_HTTP_status_codes) status. Discovering these contextual vulnerabilities requires the human mind—an analyst who understands not just how the application is built, but how it is meant to be used.
Mastering these tools is not about trusting their outputs blindly; it is about leveraging their immense computational power to map the terrain, highlight anomalies, and direct your human intuition to the exact point where the defense fractures.