Incident Detection and Analysis
Not sure you’re ready?
Take the ~3-minute readiness diagnostic and see where you stand.
A seismologist does not see the tectonic plates grinding beneath the earth's crust; they see the tremors. They look at scattered data points across an array of distributed sensors that, when pieced together, reveal the shape of an invisible, catastrophic force. As a security operations analyst, your reality is fundamentally the same. You rarely physically watch an adversary compromise a domain controller in real time. Instead, you observe the digital tremors—the dropped packets, the mismatched protocols, the subtle alterations in user behavior. The art of incident detection and analysis is the art of reading these scattered tremors perfectly to reconstruct the earthquake before the building falls.

Before we can detect an incident, we must rigorously define what an incident actually is. The National Institute of Standards and Technology provides the canonical framework for this.
NIST SP 800-61 Revision 2 defines an incident as a violation or imminent threat of violation of computer security policies, acceptable use policies, or standard security practices.
Notice the phrase "imminent threat." An incident is not just a breached database; a localized ransomware infection spreading toward your core servers is an incident because the violation of policy is imminent.
Handling these events requires a structured methodology. Detection and Analysis is the second phase of the NIST incident response lifecycle (following Preparation). It is arguably the most complex phase because it requires differentiating the signal of an attack from the immense background noise of normal network operations.
Within this phase, we look for two distinct temporal signals: precursors and indicators.
- A precursor is a sign that an attacker may launch an incident in the future. Think of this as the reconnaissance phase: a web application vulnerability scanner probing your external IP range, or a threat actor boasting about targeting your organization on a dark web forum.
- An indicator is a sign that an incident may have occurred or may currently be occurring on a network. If an antivirus alert triggers, or a system suddenly crashes, you are looking at an indicator.
When an indicator is verified as malicious, it becomes a crucial piece of forensic data. Indicators of Compromise (IoCs) are forensic artifacts that provide evidence of a potential security breach. They are the breadcrumbs the adversary leaves behind. We generally categorize these into three tiers of fidelity.
1. Deterministic Indicators
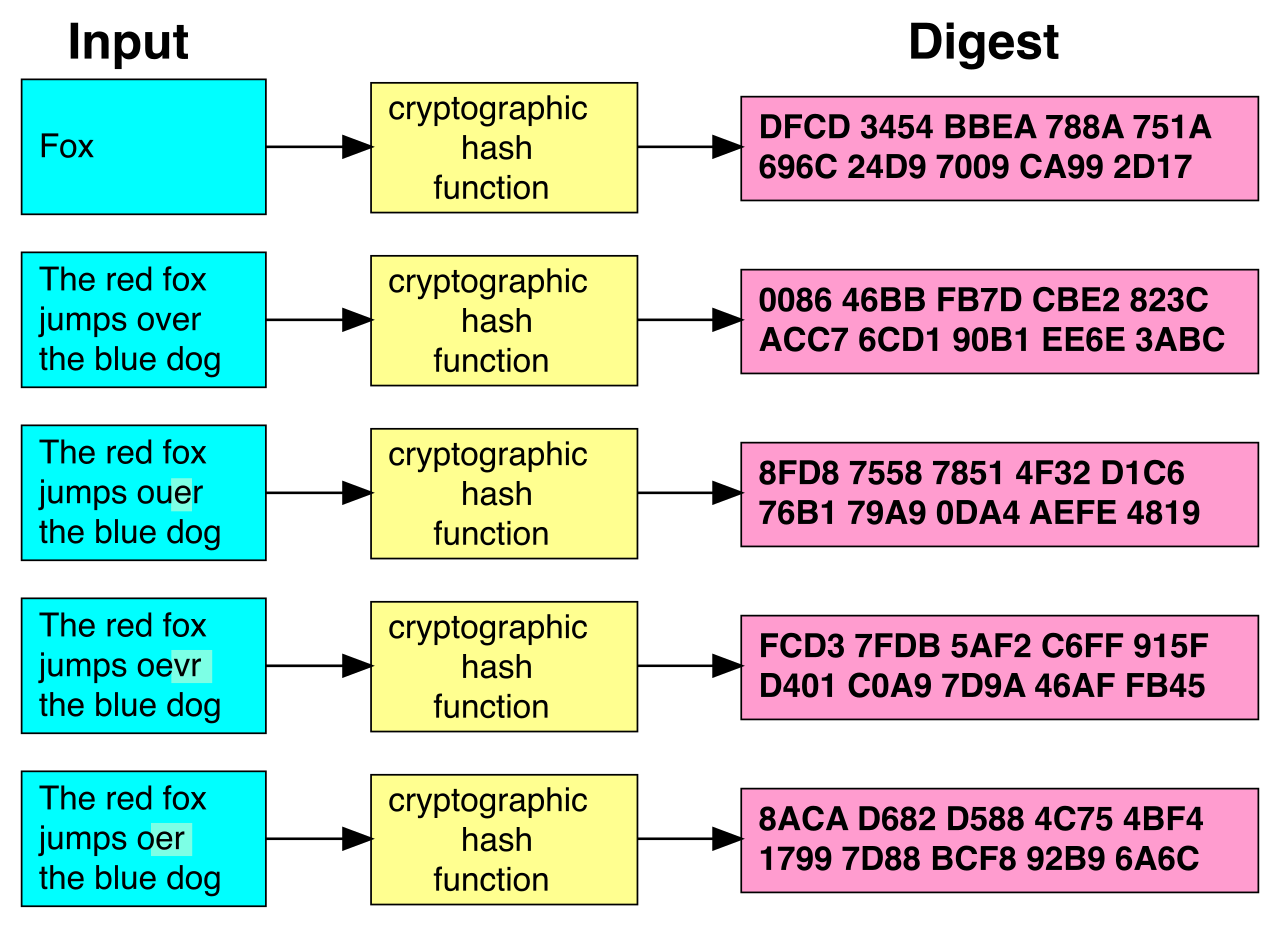
At the foundation, we have undeniable mathematical proofs. Cryptographic file hashes matching known malware signatures serve as deterministic Indicators of Compromise. If you pull an SHA-256 hash off an endpoint and it perfectly matches a known Emotet payload, there is no ambiguity. The file is malicious.
2. Network-Based Indicators
Attackers must communicate with their infrastructure, which inevitably leaves network artifacts. For example, unusual outbound network traffic to unexpected geographic locations acts as a network-based Indicator of Compromise. If a human resources workstation in Ohio suddenly initiates a massive outbound transfer to an IP block in North Korea at 3:00 AM, the network is speaking to you.
Furthermore, attackers often try to hide this communication by blending in. You must look closely at application layers. A mismatched application protocol running on a non-standard port indicates potential command and control communication. If you see SSH traffic traversing port 80 (usually reserved for unencrypted HTTP), the adversary is attempting to bypass perimeter port restrictions by disguising their remote access tool.
3. Behavioral Indicators
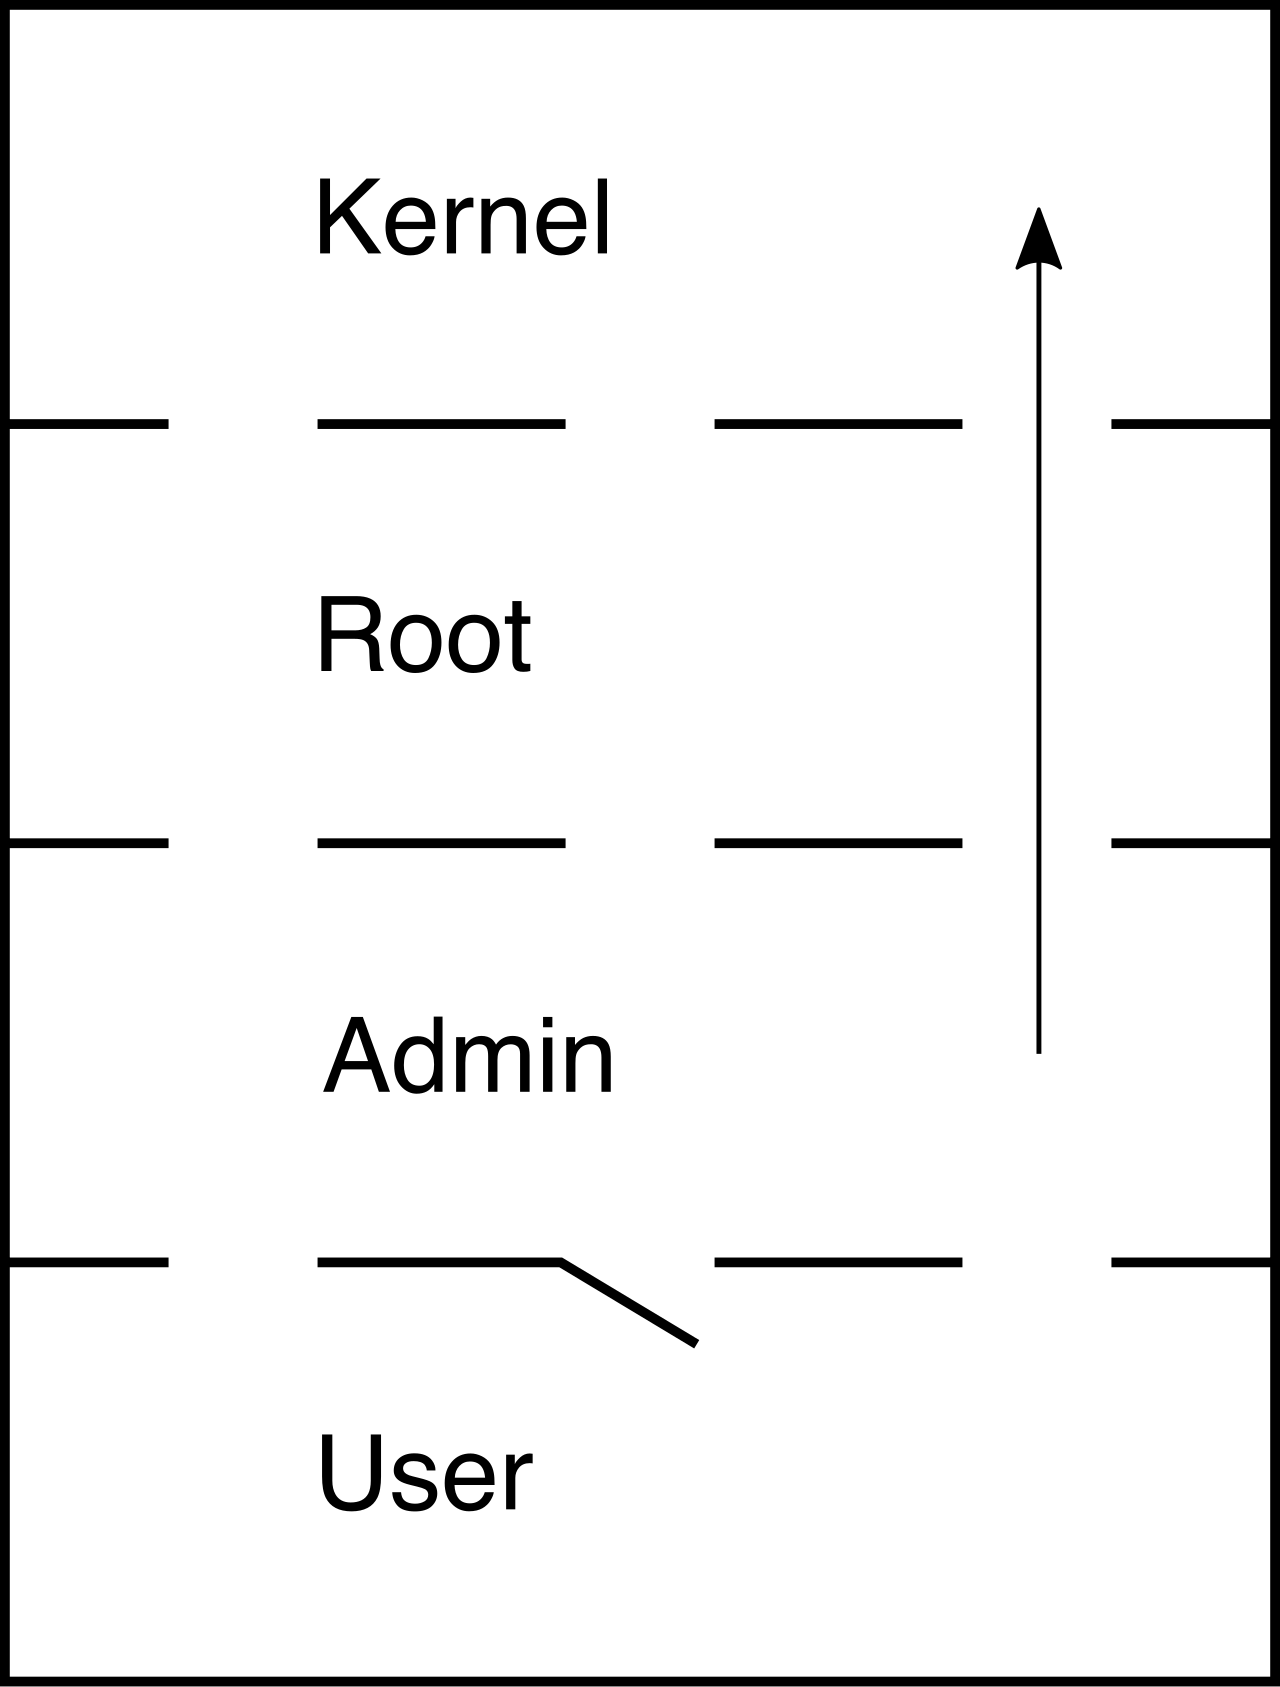
Adversaries can change file hashes easily, and they can route traffic through local VPNs, but changing their fundamental behavior is much harder. Behavioral Indicators of Compromise include abnormal user login times and unexpected privilege escalation events. A service account designed to run a local backup script suddenly attempting to add itself to the Domain Admins group is a behavioral IoC.
Standardizing the Threat Lexicon
To ensure security teams globally can share these findings, we use standardized languages and frameworks:
- The OpenIOC framework is an extensible XML-based format used for describing Indicators of Compromise. It allows security tools to consume and search for these artifacts systematically.
- STIX (Structured Threat Information eXpression) is a standardized language used for conveying data about cybersecurity threats and Indicators of Compromise. STIX is often paired with TAXII (the transport mechanism) to automate threat intelligence sharing.
- To understand the meaning behind these IoCs, we map them to behavior. The MITRE ATT&CK framework is a globally accessible knowledge base of adversary tactics and techniques based on real-world observations. If you find an IoC, MITRE ATT&CK tells you why the adversary used it and what they will likely do next.
To analyze log data during an incident, you must first collect it. The modern network generates terabytes of telemetry daily.
At the center of your operations is the SIEM. A Security Information and Event Management (SIEM) system centralizes log data from multiple sources for correlation and analysis. The SIEM is your central brain. But a brain needs nerve endings.
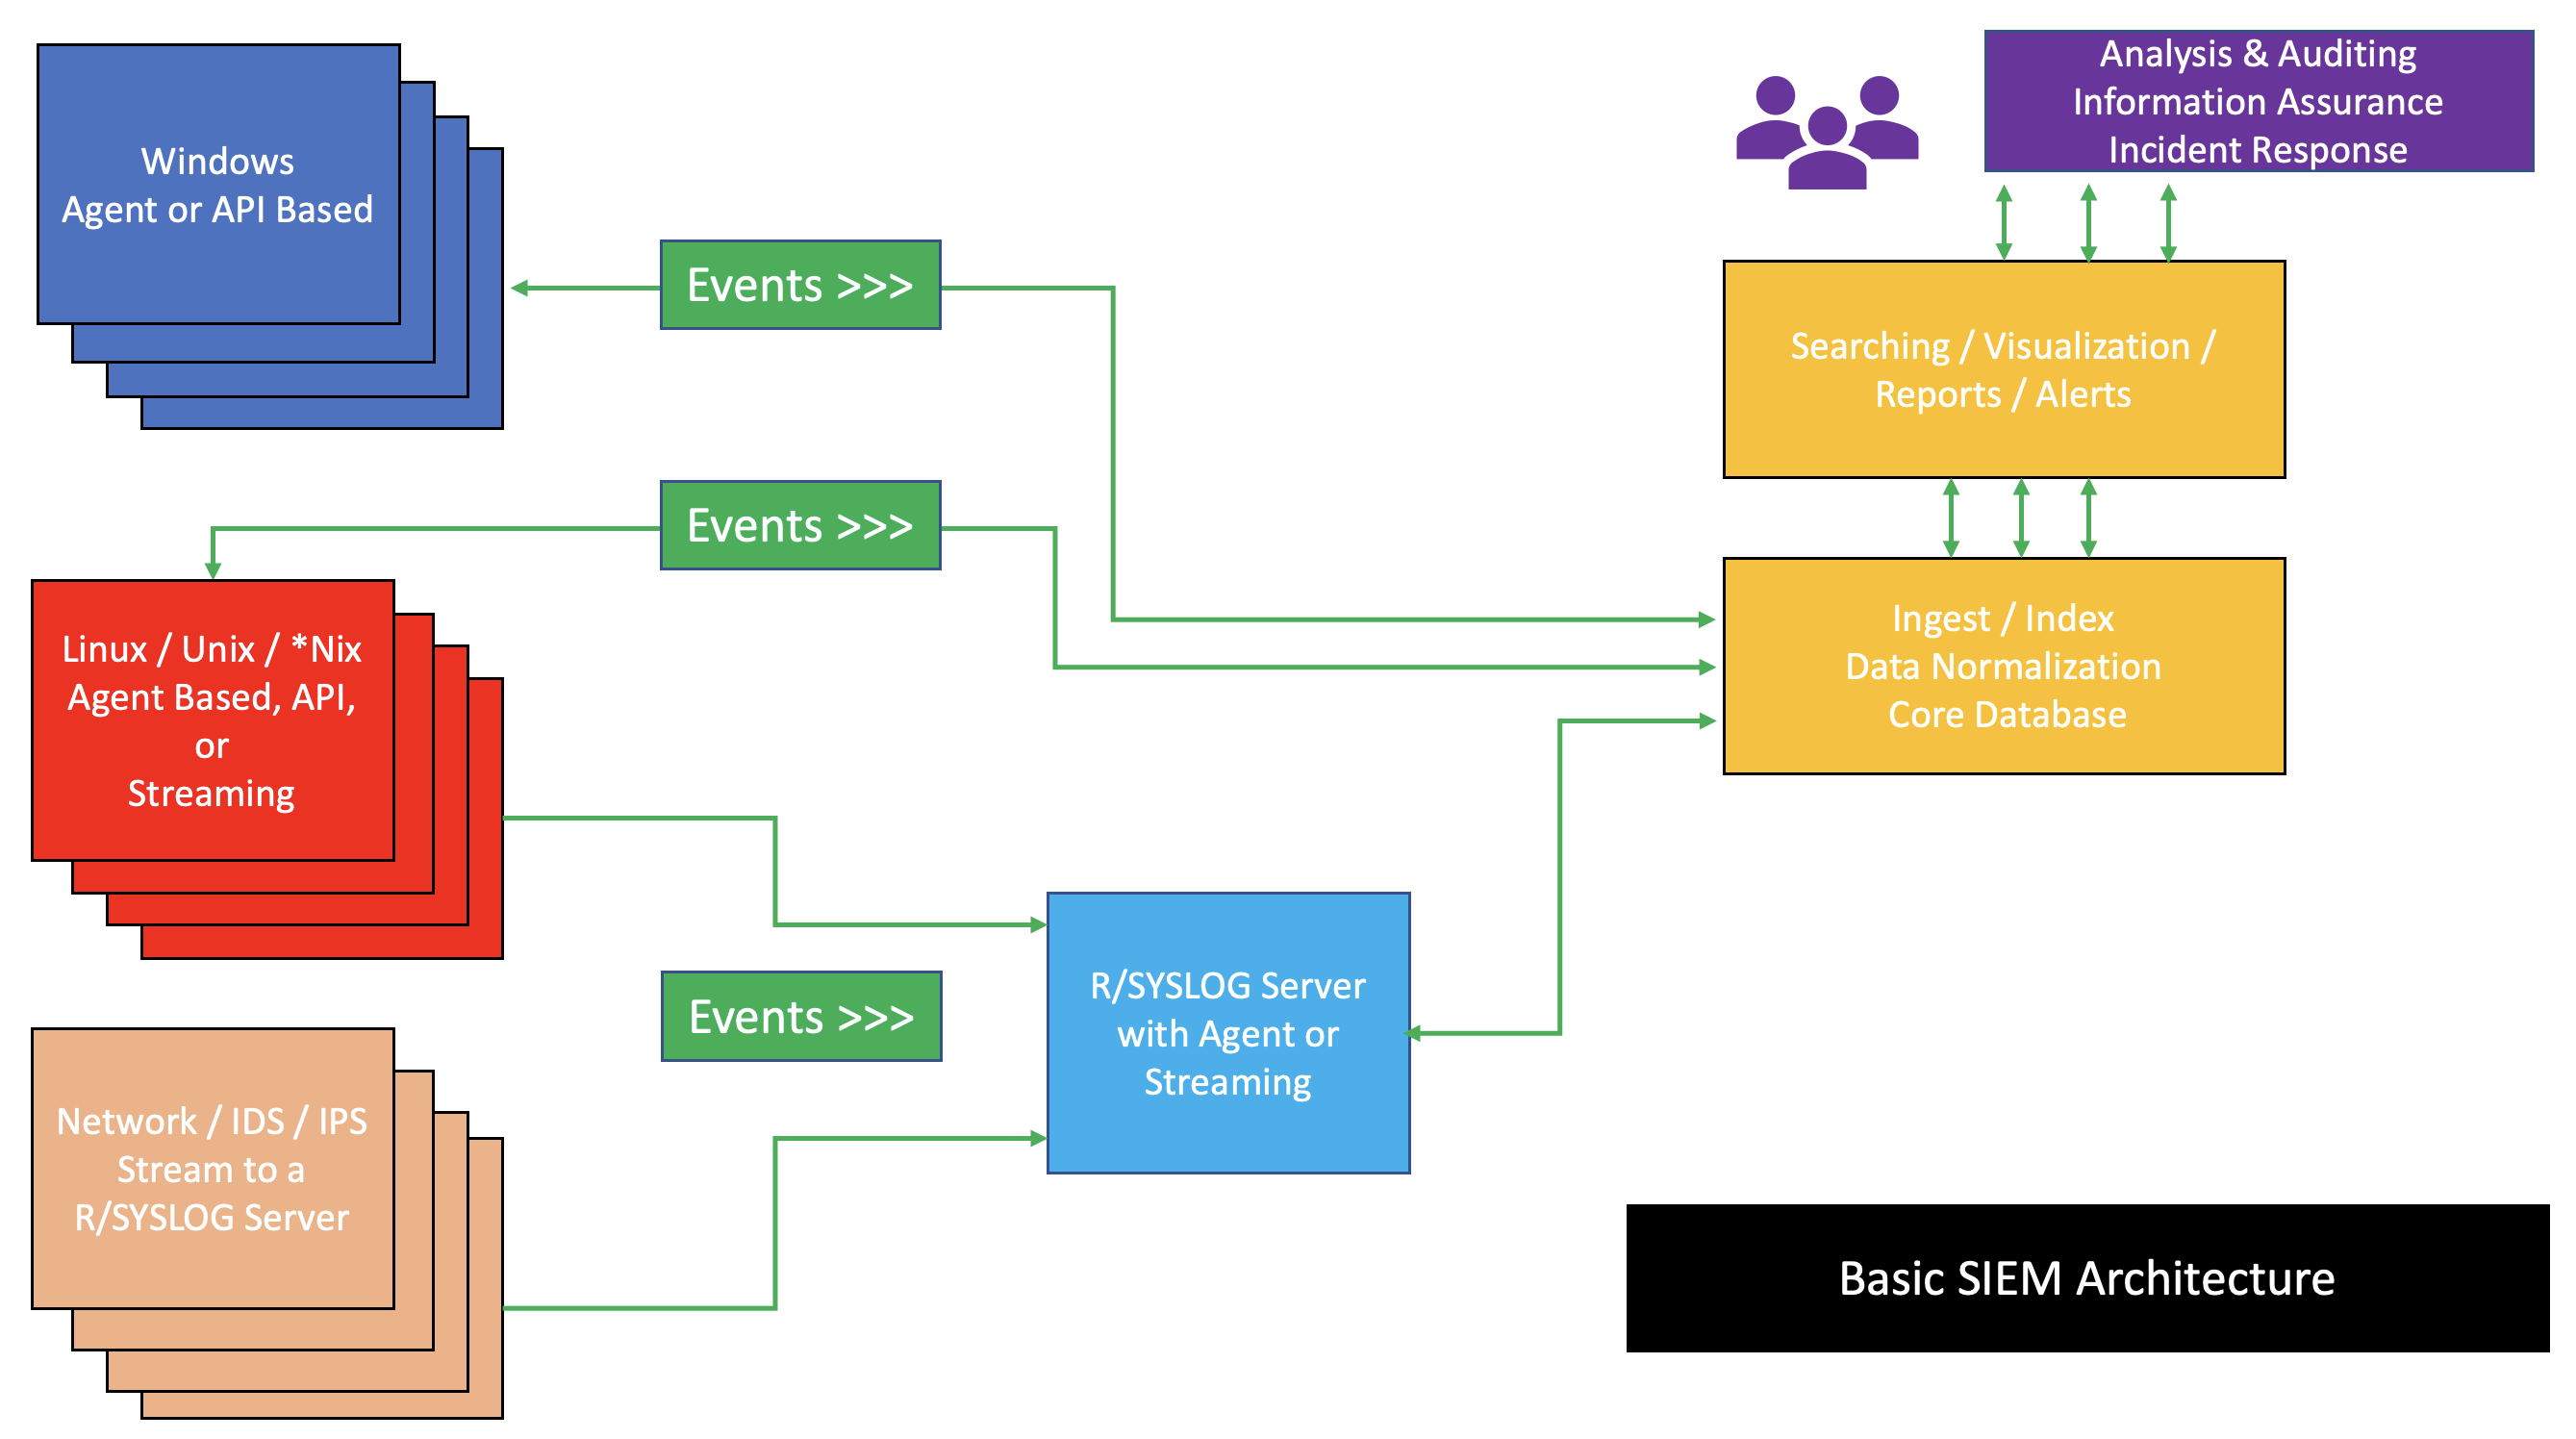
To gain visibility at the host level, organizations deploy specialized software. Endpoint Detection and Response (EDR) agents provide continuous monitoring and logging of endpoint system activities for incident detection. EDR acts as a flight data recorder for your endpoints, capturing process executions, registry modifications, and file creations.
Decoding Operating System Logs
When diving into endpoints, you must be fluent in the native logging languages of the operating systems.
For Windows environments, the Windows Security Event Log is your primary source of truth. Memorizing key Event IDs is non-negotiable for rapid triage.
| Windows Event ID | Significance in Incident Analysis |
|---|---|
| 4624 | Indicates a successful account logon. Crucial for tracking lateral movement. |
| 4625 | Indicates a failed account logon attempt. A high volume of these often reveals brute-force or password-spraying attacks. |
| 4720 | Indicates the creation of a new user account. Attackers frequently create dormant accounts to maintain persistence. |
| 1102 | Indicates the security audit log has been cleared. This is a massive red flag. |
Regarding Event ID 1102: Attackers deploy log clearing techniques to hide their tracks and disrupt subsequent incident analysis efforts. If you see an 1102 event triggered by a user account, treat it as a high-severity incident until proven otherwise.
In Linux environments, authorization data is stored in plain text, but the location varies by distribution architecture:
| Linux Distribution | Authentication Log Path | Description |
|---|---|---|
| Debian-based (e.g., Ubuntu) | /var/log/auth.log | The Linux /var/log/auth.log file stores system authorization information and user login attempts on Debian-based systems. |
| Red Hat-based (e.g., RHEL, CentOS) | /var/log/secure | The Linux /var/log/secure file stores authentication and authorization events on Red Hat-based systems. |
Endpoint logs tell you what happened on a machine, but network logs tell you how the attacker got there and what they stole.
Understanding the difference between network telemetry types is like understanding the difference between a phone bill and a wiretap.
- Network flow data (NetFlow) provides metadata about network connections rather than the full packet payload. It tells you Source IP, Destination IP, ports, protocols, and the volume of data transferred. It is lightweight, making it excellent for spotting large data exfiltration over long periods.
- Full packet capture (PCAP) contains the complete payload and headers of network traffic for deep forensic analysis. PCAP allows you to literally reconstruct the file the attacker downloaded or read the plain-text commands they sent. However, it requires massive storage overhead.
Beyond PCAP and NetFlow, specialized appliances provide context:
- Firewall logs identify accepted and dropped network connections at the network perimeter or internal network segments. They are your first check to see if an external attack breached the perimeter or was halted at the gate.
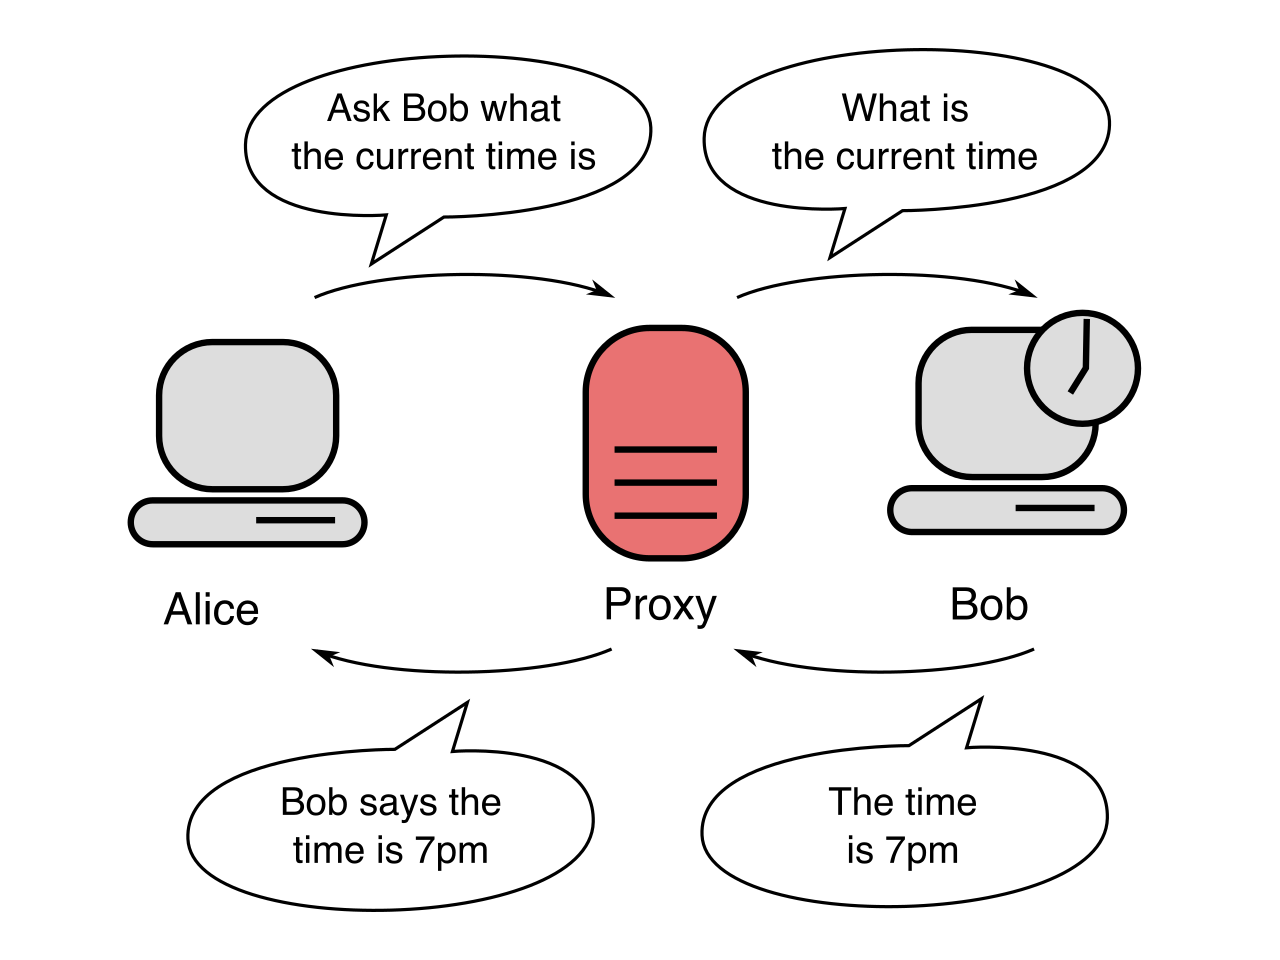
- Proxy logs contain details of outbound web requests including requested URLs, user agent strings, and HTTP status codes. If malware is beaconing out to
evil-domain.com, your proxy logs will capture the exact URI structure and the user agent the malware is masquerading as. - DNS sinkholing logs reveal internal hosts attempting to resolve known malicious domains. By routing known bad domains to a black hole (sinkhole), you not only prevent the connection but generate a clean, high-fidelity alert identifying the infected internal machine.
The Encryption Blindspot
There is a profound challenge in modern network analysis. The widespread adoption of HTTPS and TLS is excellent for consumer privacy, but terrible for defenders. Encrypted network traffic prevents traditional deep packet inspection without the deployment of TLS/SSL decryption proxies. If the traffic is encrypted, your PCAP will just look like mathematical noise. You must rely entirely on NetFlow metadata, endpoint logs, or SSL interception to deduce malicious activity.
Having the logs is not enough; you must manipulate them to reveal the narrative of the attack.
CRITICAL ARCHITECTURAL REQUIREMENT: Clock synchronization across all network devices via Network Time Protocol (NTP) is strictly required to ensure accurate temporal correlation of logs. If your firewall thinks it is 10:04 AM and your domain controller thinks it is 10:07 AM, piecing together an attacker's rapid lateral movement becomes a maddening, mathematically impossible jigsaw puzzle.
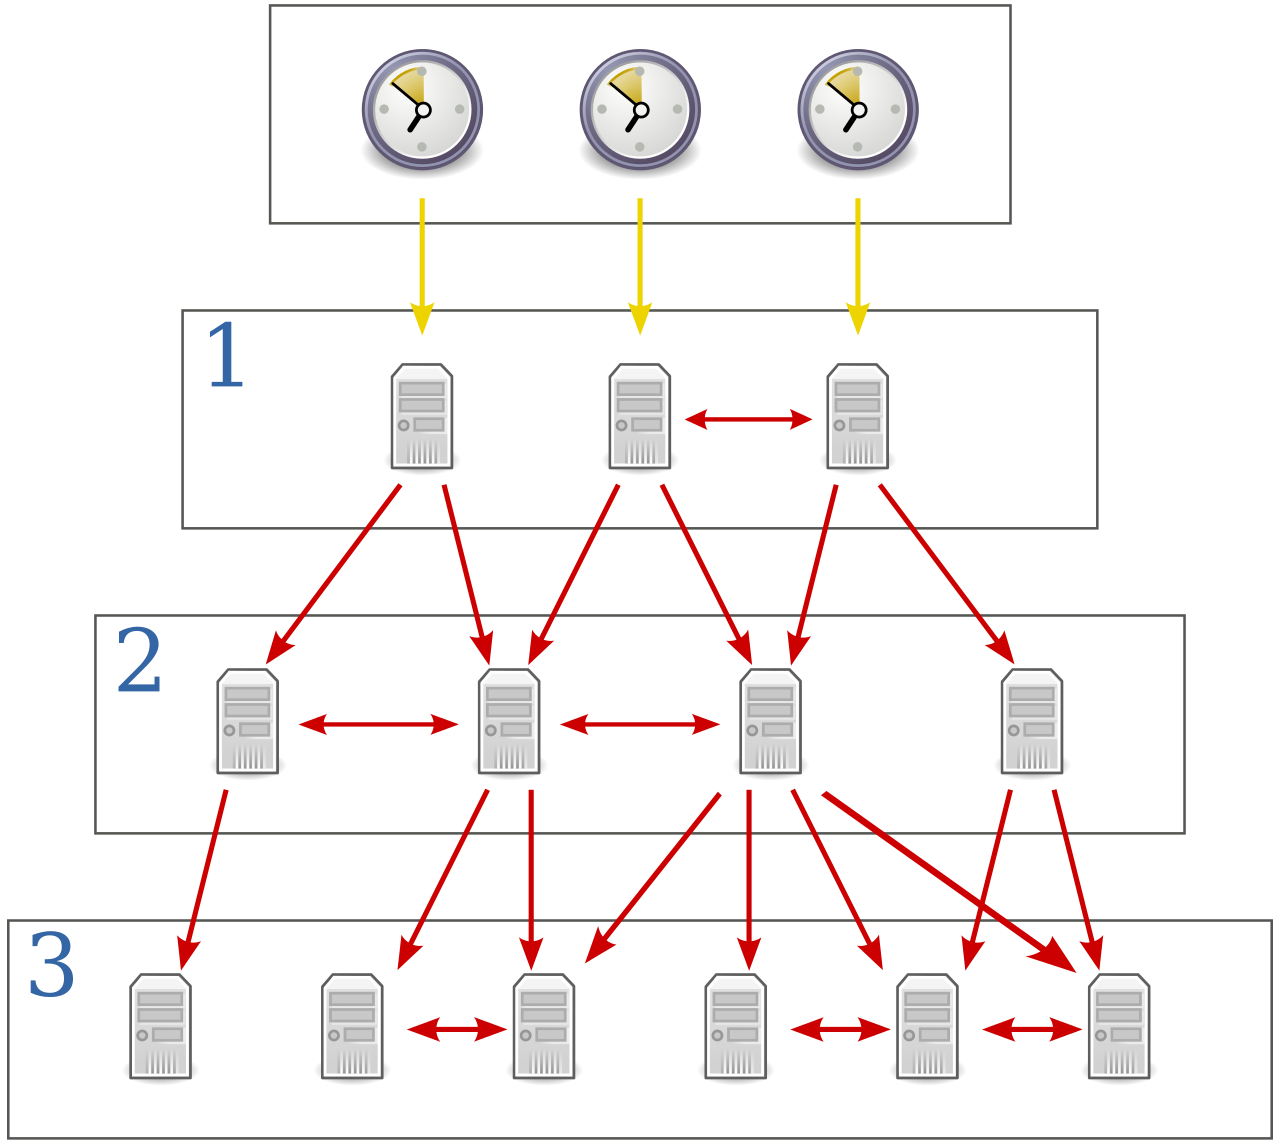
With synchronized logs, we apply specific analytical techniques:
- Log Correlation: This is the core function of a SIEM. Log correlation links multiple distinct log events to identify a broader attack sequence. A failed login (Windows Event 4625), followed immediately by an IDS alert for a buffer overflow, followed by a successful login (Windows Event 4624) from the same IP, creates a correlated alert: Successful Brute Force Compromise.
- Data Enrichment: Raw logs are often just IP addresses and timestamps. Data enrichment adds contextual information to raw log events by appending details like geographic location or threat intelligence scores. Converting an IP address into "Pyongyang, North Korea" immediately changes how an analyst treats the alert.
- Baseline Comparison: You cannot detect anomalies if you do not know what is normal. Baseline comparison involves measuring current system behavior against a known-good historical state to detect anomalies. If a server normally peaks at 50MB of outbound traffic a day, a sudden spike to 5GB is an anomaly detected via baselining.
- Trend Analysis: Some attacks are "low and slow." Trend analysis examines historical log data over time to identify slow-developing attacks or gradual changes in system behavior. A threat actor exfiltrating 10MB of data per day over six months might evade sudden baseline spikes, but trend analysis will catch the sustained shift.
- Heuristic Analysis:
Signatures only catch known malware. Heuristic analysis uses rules and algorithms to detect previously unknown threats based on suspicious characteristics. If a brand-new, never-before-seen executable injects code into
explorer.exeand attempts to delete shadow volume copies, heuristics flag it as ransomware based purely on its behavior, regardless of its file hash. - The Super Timeline: During a deep incident response investigation, analysts must construct the ultimate forensic artifact. A super timeline aggregates log data from file systems, memory, and network devices into a chronological sequence of events. It merges registry modifications, PCAP timestamps, and Event IDs into one master script, allowing the responder to replay the attacker's every move, second by second.
The systems we build to detect threats are imperfect, and navigating their flaws is a daily reality for the SOC analyst.
- False positives occur when an alerting system incorrectly identifies benign network activity as malicious. A developer testing a new API might trigger a SQL injection alert.
- False negatives occur when an alerting system completely fails to identify actual malicious activity. This is the worst-case scenario—an attacker slips past the defenses undetected.
The sheer volume of telemetry creates a psychological toll. A high volume of inaccurate security alerts can lead to alert fatigue for Security Operations Center analysts. When an analyst sees 500 false positives a day, human nature dictates they might glance over the 501st alert—which happens to be the true positive, the actual breach. Tuning the SIEM to reduce false positives without creating false negatives is an ongoing, delicate balancing act.
Furthermore, we are bound by physics and law. We cannot keep telemetry forever. Log retention policies dictate how long security event data must be stored for compliance auditing and historical incident analysis. If an attacker has been in your network for 200 days, but your retention policy only stores logs for 90 days, the beginning of the attack is permanently erased from history.
The Shift to Proactive Defense: Threat Hunting
Because false negatives happen and sophisticated adversaries evade automated SIEM alerts, the best security teams do not wait for the alarm to ring.
Threat hunting is a proactive approach to finding undetected threats in a network by iteratively analyzing security data and logs. A threat hunter assumes the perimeter has already been breached. They form a hypothesis—for example, "Adversaries are using PowerShell to bypass our EDR"—and then manually sift through the telemetry, looking for the subtle tremors that the automated systems missed.
By mastering incident detection and analysis, you stop being a passive recipient of alerts. You become the active investigator, using baselines, heuristics, and correlated telemetry to illuminate the dark corners of your network where adversaries attempt to hide.