Vulnerability Metrics and KPIs
Not sure you’re ready?
Take the ~3-minute readiness diagnostic and see where you stand.
In the physical sciences, measuring the decay rate of a radioactive isotope tells physicists exactly how long a material will remain volatile. In a Security Operations Center (SOC), measuring the decay rate of an unpatched software flaw tells us exactly how long a digital environment remains exposed to catastrophic loss. Measurement is the mechanism by which we transform the chaos of continuous cyber threats into a managed, understandable system. For cybersecurity professionals, formalizing this measurement is not just an administrative chore; it is the fundamental engine of security improvement. NIST Special Publication 800-55 provides the formal guidance on both selecting and developing information security performance metrics, establishing the exact parameters organizations use to prove their defenses are actually working.
If you walk into a SOC and ask an analyst for their vulnerability data, they can likely hand you a spreadsheet with thousands of rows. But data alone is not knowledge. To make sense of the noise, we must establish a clear distinction between a simple metric and a Key Performance Indicator.
A metric is a quantifiable measure used to track the status of a specific operational security process.
A Key Performance Indicator (KPI) is a specific metric directly tied to a strategic business objective or a strategic security objective.
All KPIs are metrics, but not all metrics are KPIs. If your vulnerability scanner detects 500 missing patches, that is a metric. If you measure the percentage of critical vulnerabilities patched within thirty days—and tie that directly to a corporate goal of reducing external attack surface by 20%—that is a common Key Performance Indicator for patch management effectiveness.
We further divide these measurements by their operational scope:
- Operational metrics focus on the daily efficiency of security teams identifying vulnerabilities, as well as the daily efficiency of security teams resolving vulnerabilities.
- Strategic metrics provide long-term visibility into the overall security posture improvements of an organization, allowing leadership to see if their investments are paying off over quarters and years.
In incident response and vulnerability management, time is the ultimate enemy. A vulnerability is an open window; the longer it stays open, the higher the probability that a threat actor climbs through. Therefore, we measure the lifecycle of our response using precise chronometers.
- Mean Time to Detect (MTTD): Measures the average amount of time required for an organization to discover a security vulnerability once it is introduced into the environment.
- Mean Time to Acknowledge (MTTA): Measures the time elapsed between an alert generation and a security analyst actually beginning the investigation. If your MTTD is fast but your MTTA is slow, your tools are working, but your human team is overwhelmed.
- Mean Time to Remediate (MTTR): Measures the average amount of time required to apply a mitigation (like a patch) to an identified vulnerability.
The Zero-Day Exception
When dealing with a known vulnerability, the solution is usually a vendor patch. But what happens when the attack is unprecedented? Zero-day vulnerability metrics track the frequency of exploits that lack official vendor patches, as well as the remediation speed of these undocumented threats.
Because a true patch does not exist yet, we track the Time to Mitigate. This measures the speed at which an organization applies temporary compensating controls (like disabling a vulnerable service or implementing a web application firewall) to a zero-day vulnerability while waiting for a permanent fix.
You cannot secure what you cannot see, and you cannot measure what you do not count.
Scan coverage measures the percentage of network assets actively evaluated by vulnerability scanning tools. However, this metric is a house of cards if the foundation is weak: asset inventory completeness directly impacts the accuracy of vulnerability scan coverage metrics. If your asset inventory only lists 800 servers, but 1,000 exist, a 100% scan coverage metric is a dangerous illusion.
Once we scan the territory, we evaluate the concentration and the validity of the flaws:
- Vulnerability Density: Measures the number of vulnerabilities found per computer system, or alternatively, the number of vulnerabilities found per unit of software code. High density in a specific application points to systemic development flaws.
- False Positive Rates: Measure the percentage of flagged vulnerabilities that do not actually exist on the target system. Why does this matter operationally? Because a high false positive rate reduces the efficiency of security teams by forcing analysts to investigate non-existent threats. It creates alert fatigue, the silent killer of SOC effectiveness.
Understanding a vulnerability program requires tracking how the state of the network changes over time. We utilize trend analysis in vulnerability management, which involves comparing the number of open vulnerabilities across multiple reporting periods.
For example, vulnerability age tracks the number of days a specific vulnerability remains unpatched after initial discovery. A consistent, downward trend in vulnerability age indicates an improvement in the efficiency of the patch management process.
But what if a vulnerability is fixed, only to reappear? We track the vulnerability reopen rate. A high vulnerability reopen rate indicates that previously applied remediations are failing—perhaps a server was rolled back to an old snapshot, or a configuration management tool overwrote a secure setting with a vulnerable baseline.
The Reality of Business: SLAs and Exceptions
Not every vulnerability is patched immediately. Security operations are bound by reality.
- Service Level Agreement (SLA) compliance: Tracks the percentage of vulnerabilities remediated within an agreed-upon timeframe.
- Risk Appetite: Defines the level of vulnerability exposure an organization is willing to accept without requiring immediate remediation.
When a vulnerability exceeds our risk appetite but cannot be fixed (perhaps patching an outdated manufacturing server would shut down the entire assembly line), it requires an exception. A vulnerability exception rate tracks the percentage of discovered vulnerabilities formally accepted by management instead of being remediated. Pay close attention to this metric: high vulnerability exception rates indicate a potential misalignment between security policies and operational capabilities.
To ensure that a security analyst in Tokyo and an engineer in New York are talking about the exact same problem, the industry uses universal standards.
The MITRE Corporation maintains the Common Vulnerabilities and Exposures (CVE) list. The CVE system provides a dictionary of publicly known information security vulnerabilities.
Once identified, the flaw needs a severity rating. The Common Vulnerability Scoring System (CVSS) provides a standardized method for assigning numerical severity scores to vulnerabilities (ranging from 0.0 to 10.0).
Prioritization: How to Stop Chasing Ghosts
If an organization has 50,000 open vulnerabilities, where do analysts begin?
First, presenting the top ten most prevalent vulnerabilities in an organization helps prioritize immediate remediation efforts. By knocking out the top ten, you often eliminate massive swaths of the attack surface in bulk.
Second, look to the authorities. The Cybersecurity and Infrastructure Security Agency (CISA) maintains a catalog of Known Exploited Vulnerabilities (KEV). This is a list of vulnerabilities that threat actors are actively weaponizing in the wild right now. Comparing internal vulnerability data against the Known Exploited Vulnerabilities catalog helps prioritize urgent patching efforts. CISA takes this so seriously that it issues Binding Operational Directives (BOD) to compel federal agencies to remediate these critical vulnerabilities within specific timeframes.
The data generated by vulnerability scanners is highly technical, but the consumers of that data sit in radically different domains. A successful cybersecurity analyst acts as a translator between two distinct worlds:
| Stakeholder Group | Reporting Requirements |
|---|---|
| Technical Teams | Require vulnerability reports containing specific Common Vulnerabilities and Exposures (CVE) identifiers and detailed remediation instructions. They need the exact commands and registry keys to execute the fix. |
| Executives & Leadership | Require vulnerability reports focused on overall business risk and security resource allocation. Executive summaries of vulnerability metrics must translate technical severity scores into potential financial impacts and operational impacts. They do not care about a buffer overflow; they care about factory downtime and revenue loss. |
Visualizing the Battlefield
A 400-page PDF report does not help a SOC analyst actively monitoring a network. Dashboards provide real-time visualization of Key Performance Indicators to security operations center personnel, allowing for immediate situational awareness.
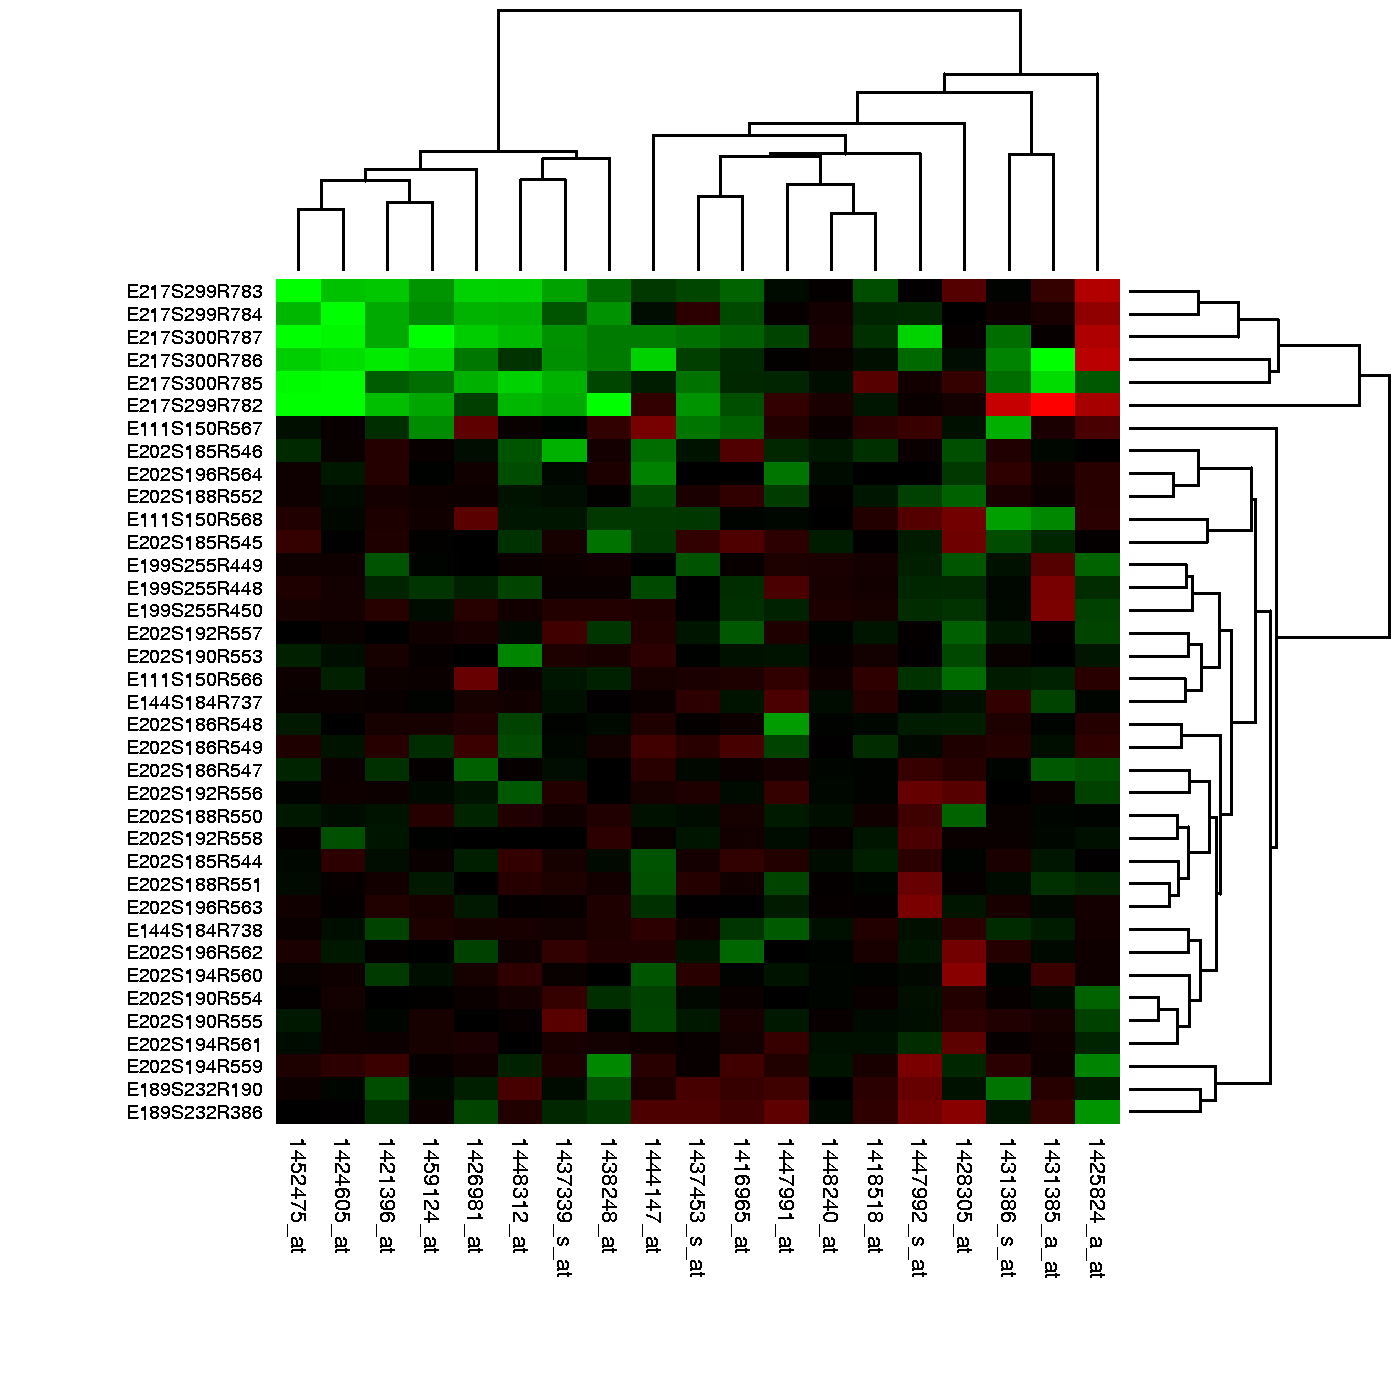
To communicate risk spatially, we use heat maps. Heat maps visually communicate the concentration of high-severity vulnerabilities across different network segments. A bright red cluster in the financial subnet immediately draws the eye and the necessary resources.
Finally, organizational accountability drives security. Grouping vulnerability metrics by business unit helps identify departments requiring additional security training, as well as departments requiring additional security resources. If the Marketing division consistently triggers a high vulnerability density and exceptional age metrics, leadership knows exactly where to allocate their budget for the next quarter.
Measurement is not a passive act. In the hands of a skilled analyst, a KPI is a tool used to forge a more resilient enterprise.