Investigation Data Sources
Not sure you’re ready?
Take the ~3-minute readiness diagnostic and see where you stand.
When a digital environment is compromised, the adversary leaves behind a fractured, scattered record of their movements. Every packet crossing a boundary, every process execution on a CPU, and every queried domain name generates a tiny mathematical fragment of data. The security analyst’s job is not merely to collect these fragments, but to fuse them into a precise, unified reality. We do not guess; we measure. By interrogating firewall logs, host operating systems, and raw network telemetry, we reconstruct the anatomy of a breach with absolute fidelity.
To pass the CompTIA Security+ (SY0-701) exam and, more importantly, to operate effectively in a modern Security Operations Center (SOC), you must understand how to read these distinct data sources. You must know what each log can tell you, what it cannot tell you, and how to combine them to piece together an attack timeline.
Imagine trying to reconstruct a multi-car collision at an intersection where every witness’s watch is set to a different time zone. The testimonies would contradict each other, and causality would be impossible to prove.
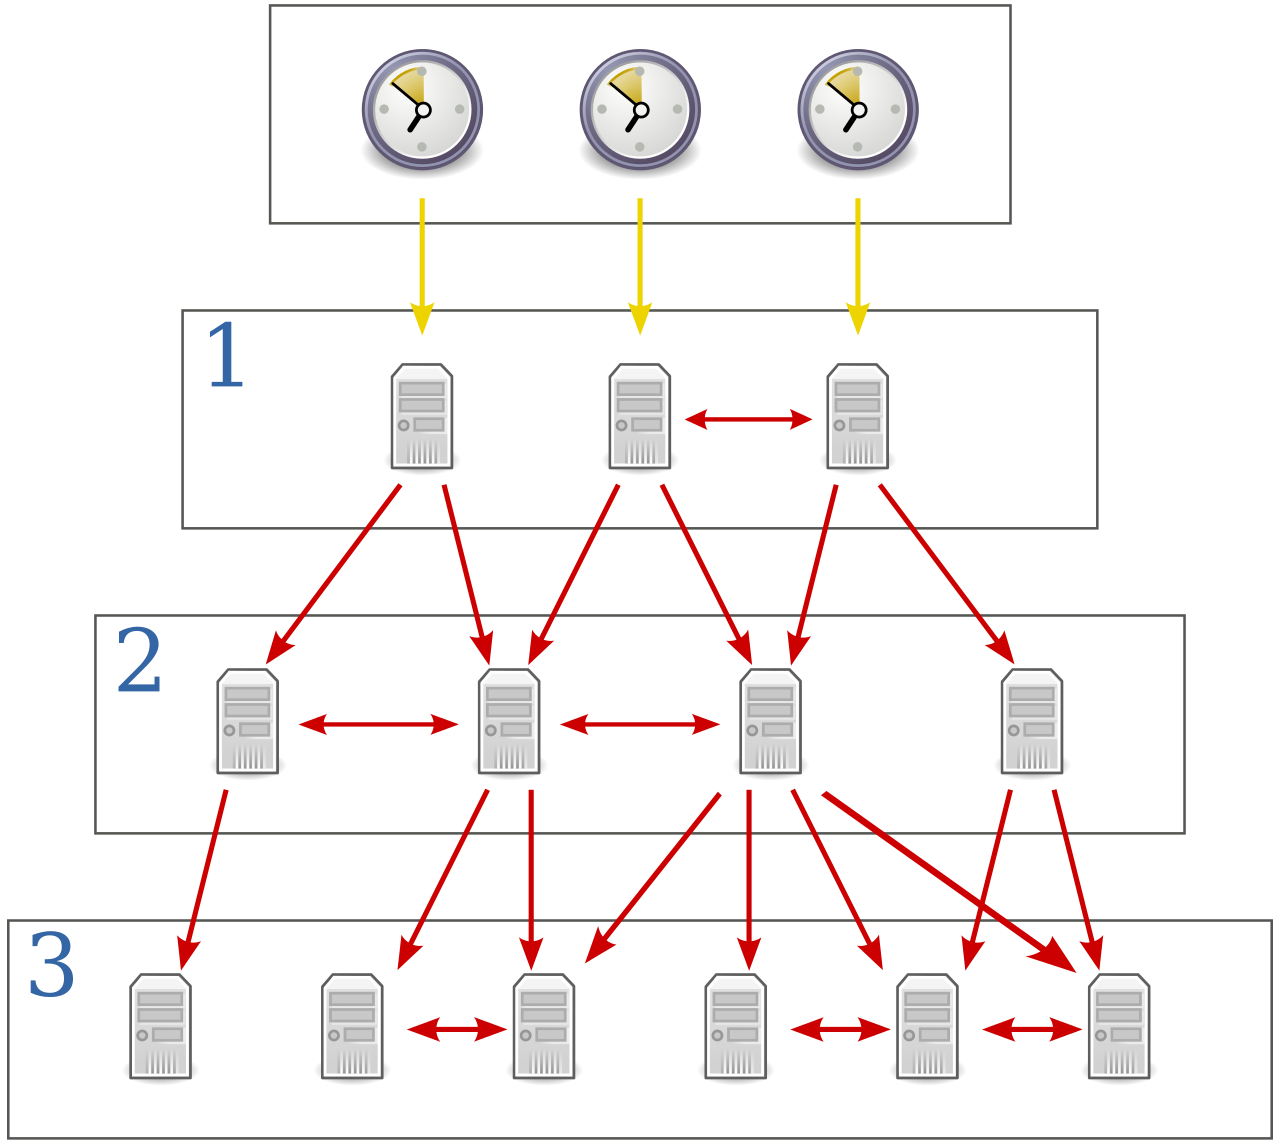
In a network, Network Time Protocol (NTP) synchronizes the system clocks of devices across an enterprise network. Synchronizing device clocks via Network Time Protocol is mandatory for constructing accurate chronological attack timelines from diverse logs. If your firewall records a connection at 10:04:22 and your server records an execution at 10:02:15, you cannot prove the connection caused the execution unless both devices share an identical, synchronized time standard.
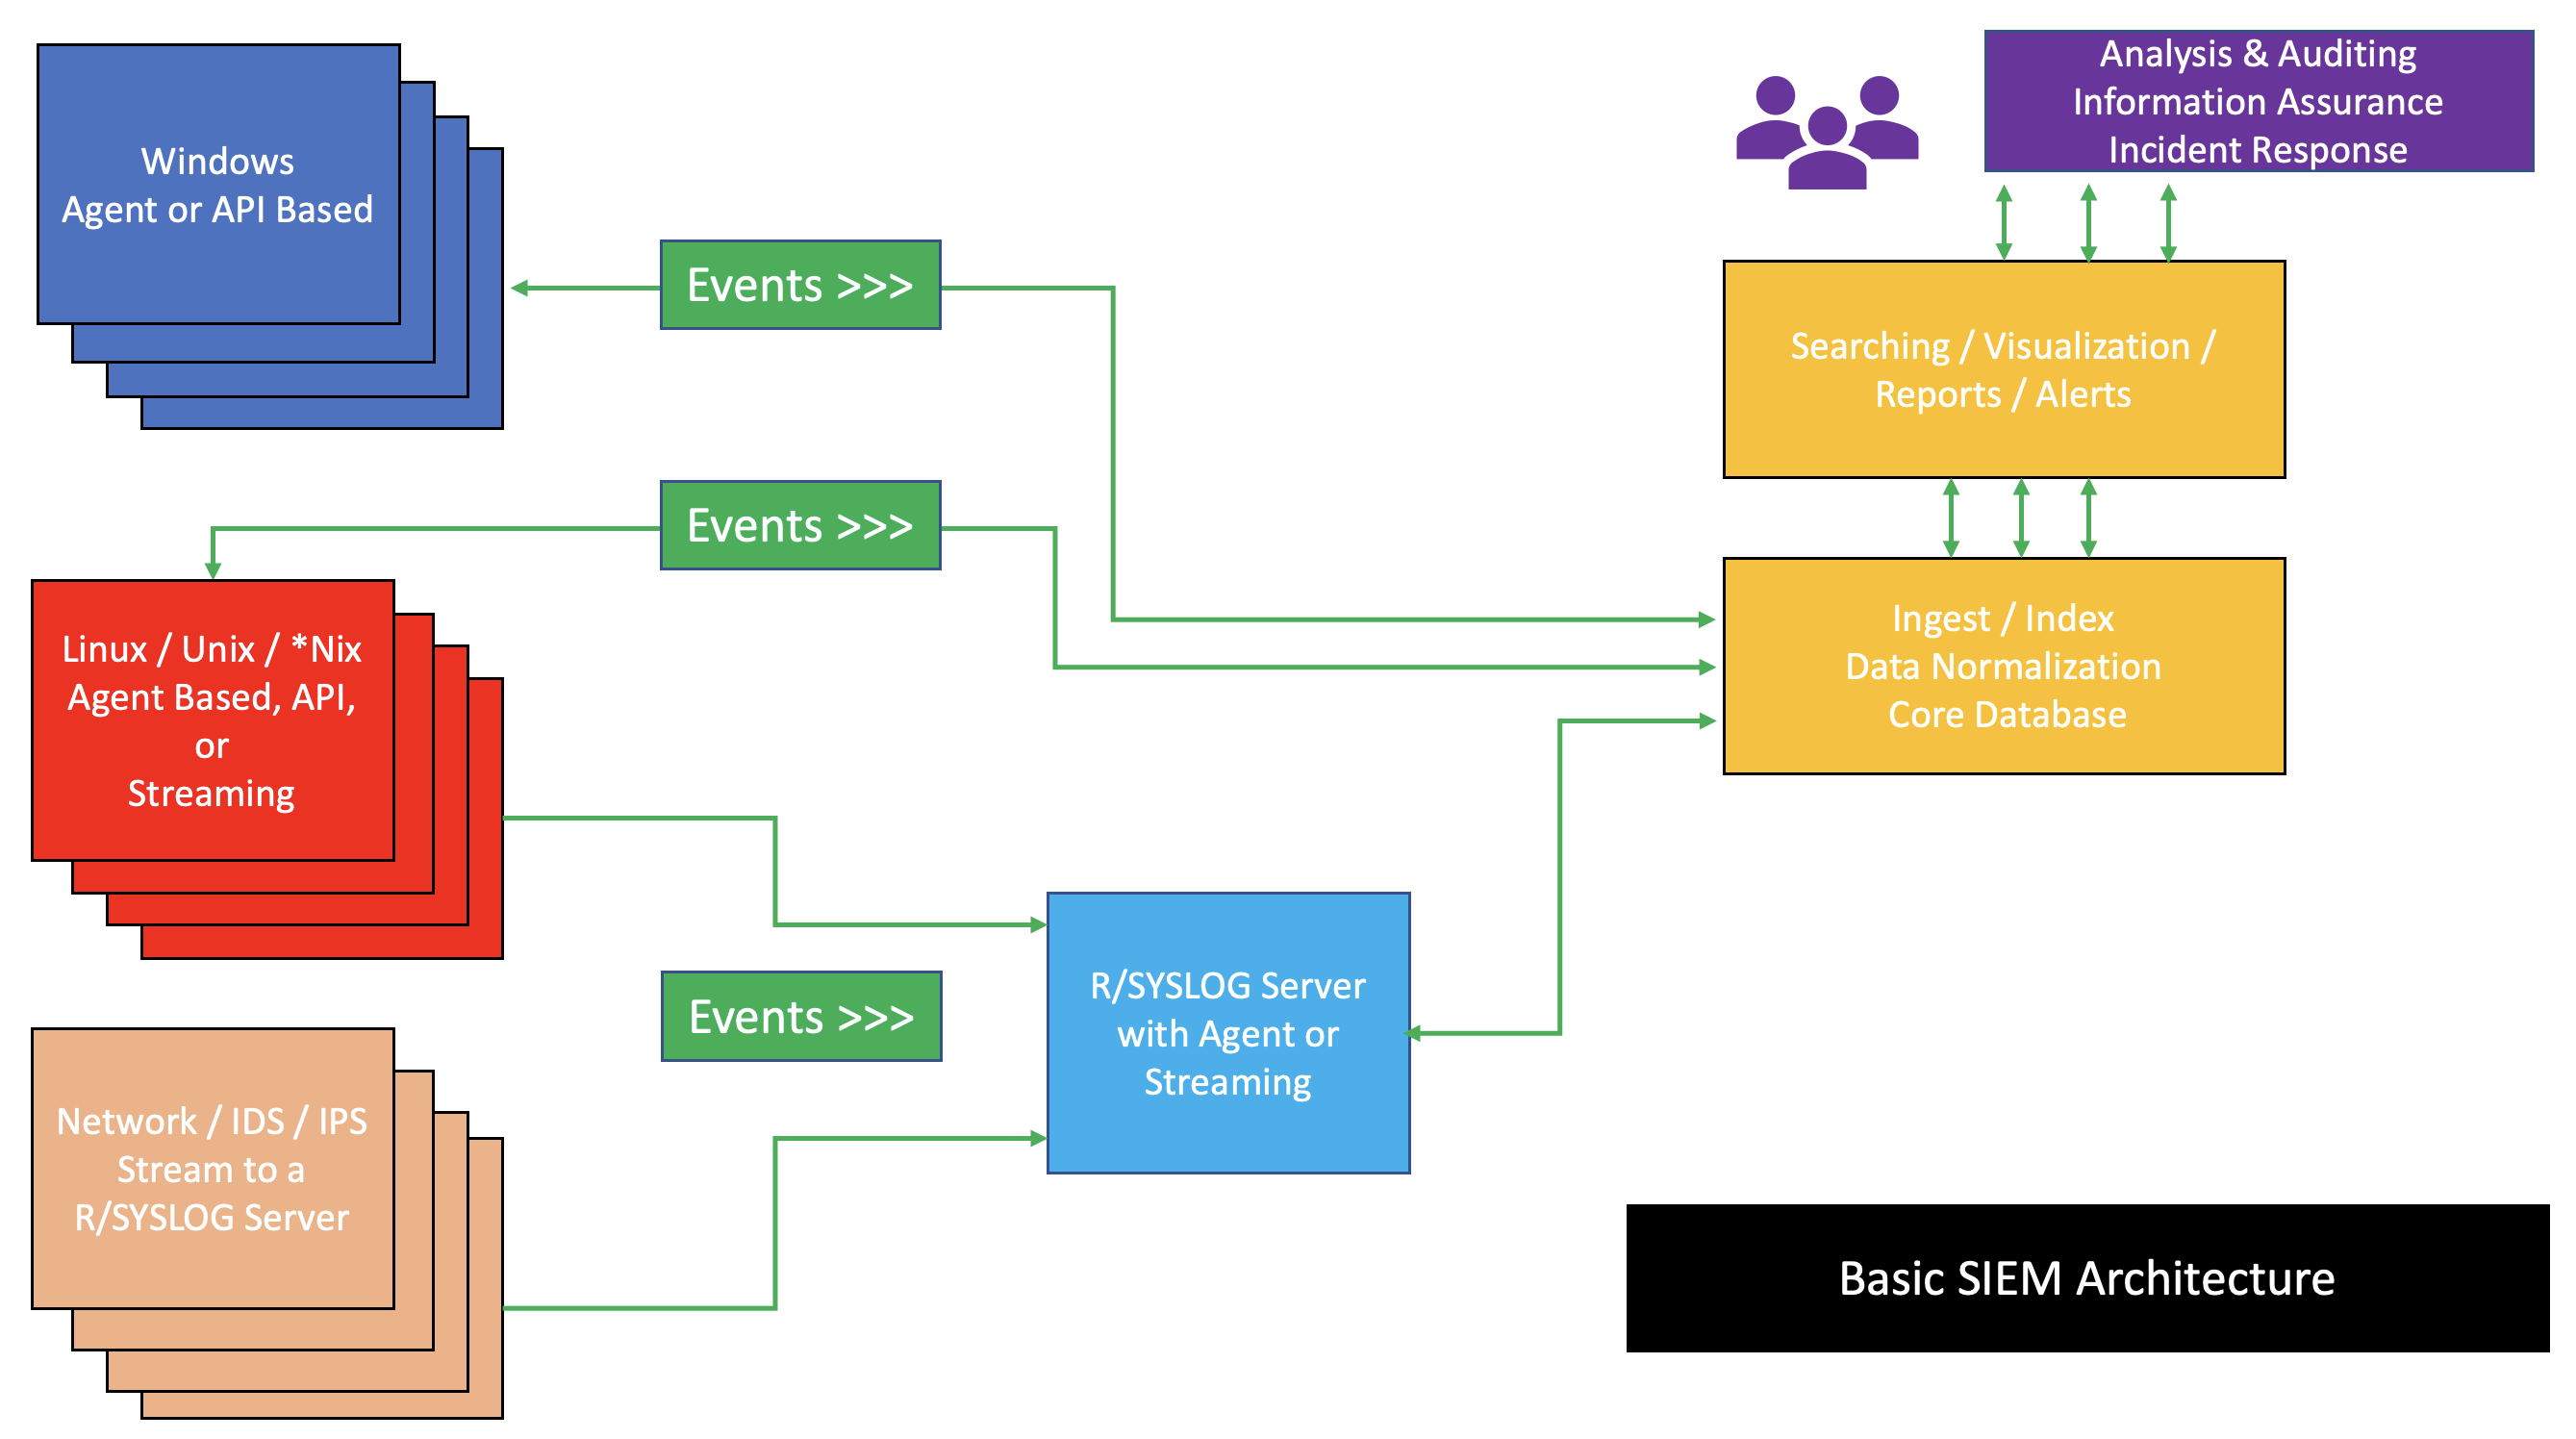
Once time is synchronized, we face a second problem: language. A Windows server formats its logs as complex XML events, a Linux firewall uses plain text Syslog, and a proxy uses comma-separated values.
Security Information and Event Management (SIEM) systems solve this. SIEMs aggregate logs from multiple data sources into a central repository. However, aggregation is just the first step. To make the data searchable, SIEM systems parse log fields to normalize diverse log structures into a standard format. This normalization allows an analyst to run a single query for a specific IP address and instantly retrieve matching firewall blocks, Windows logons, and proxy requests, regardless of their original native formatting.
The network never lies. Unlike a compromised endpoint system, which can be manipulated by malware to hide running processes, network infrastructure passively observes the physics of the data moving across it.
Firewall Telemetry
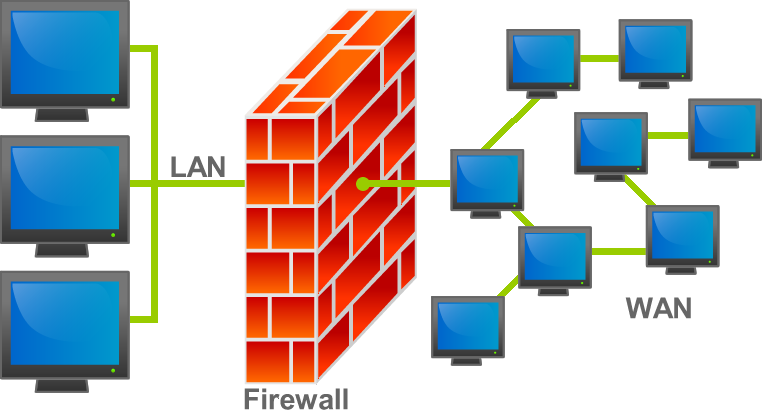
The traditional first line of defense is the network perimeter. Firewall logs record the source and destination IP addresses of traffic crossing a network boundary. When you look at a firewall log, you are primarily looking for access control decisions. Firewall logs indicate whether a specific network connection was explicitly permitted or denied by an access control list (ACL).
Why do we care about blocked traffic? Analyzing denied traffic in firewall logs helps identify external scanning attempts against a network. If an adversary is systematically probing your external IP range on port 3389 (RDP) and port 22 (SSH), your firewall logs will show a massive spike in denied connection attempts from a single source IP, giving you an early warning of targeted reconnaissance.
DNS and Web Proxies
Adversaries, like legitimate users, rely on domain names to navigate. DNS logs contain records of domain name resolution queries made by systems on a network. When an employee clicks a phishing link, their machine must first ask the DNS server where that domain lives. Security analysts review DNS logs to detect internal endpoints attempting to resolve known malicious command and control (C2) domains.
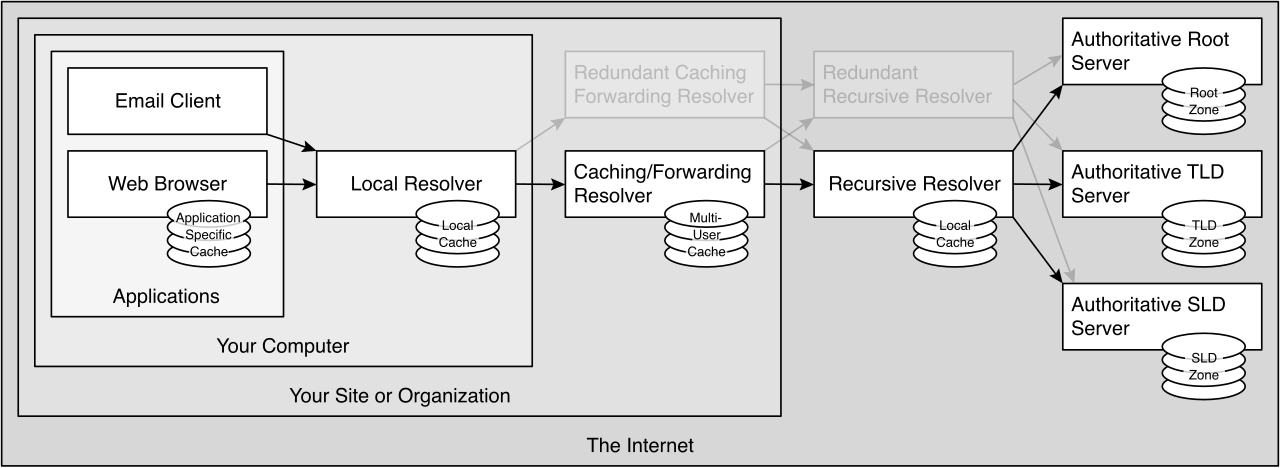
Once the name is resolved, the actual HTTP/HTTPS connection is often routed through a proxy. Web proxy logs contain records of external web requests including the specific Uniform Resource Locators (URLs) accessed by internal users.
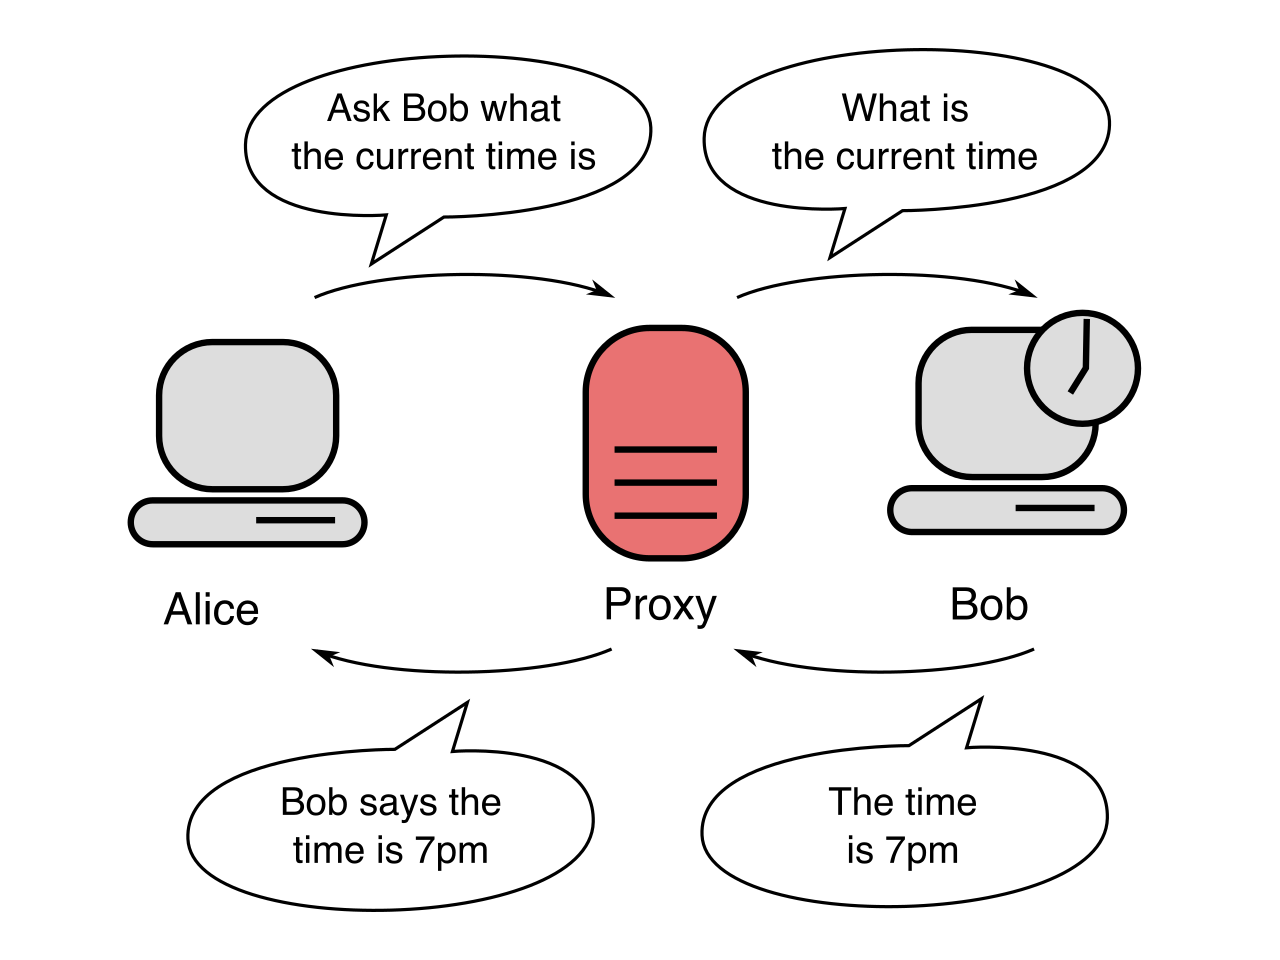
The Encryption Blindspot: Today, almost all web traffic is encrypted via HTTPS. Because the URL path is encrypted inside the HTTP payload, standard network monitoring can only see the destination IP and the domain name, not the specific file being requested. To regain this visibility, web proxy logs require TLS inspection to record the full Uniform Resource Locator paths of encrypted HTTPS traffic. By decrypting, logging, and re-encrypting the traffic, the proxy reveals exactly which malicious file path the user attempted to download.
When analyzing network data, analysts must constantly balance the depth of the data against the cost of storing it. We navigate this tradeoff using Network Flow and Packet Captures.
Network Flow (NetFlow)
Think of network flow data as an itemized phone bill. It records metadata about network connections rather than the actual data payload. Network flow metadata includes the source IP address, destination IP address, protocol used, and total bytes transferred.
Because it discards the actual contents of the communication, network flow data requires significantly less storage capacity than full packet captures. You can store months of NetFlow data on the same hard drive that would fill up in hours if you recorded full packets. Security analysts use network flow data to identify abnormal data exfiltration volumes over time. If a database server that normally sends 50 Megabytes of data to the internet suddenly transfers 400 Gigabytes at 2:00 AM, the payload itself doesn't matter—the metadata alone proves a massive exfiltration event is occurring.
Packet Captures (PCAP)
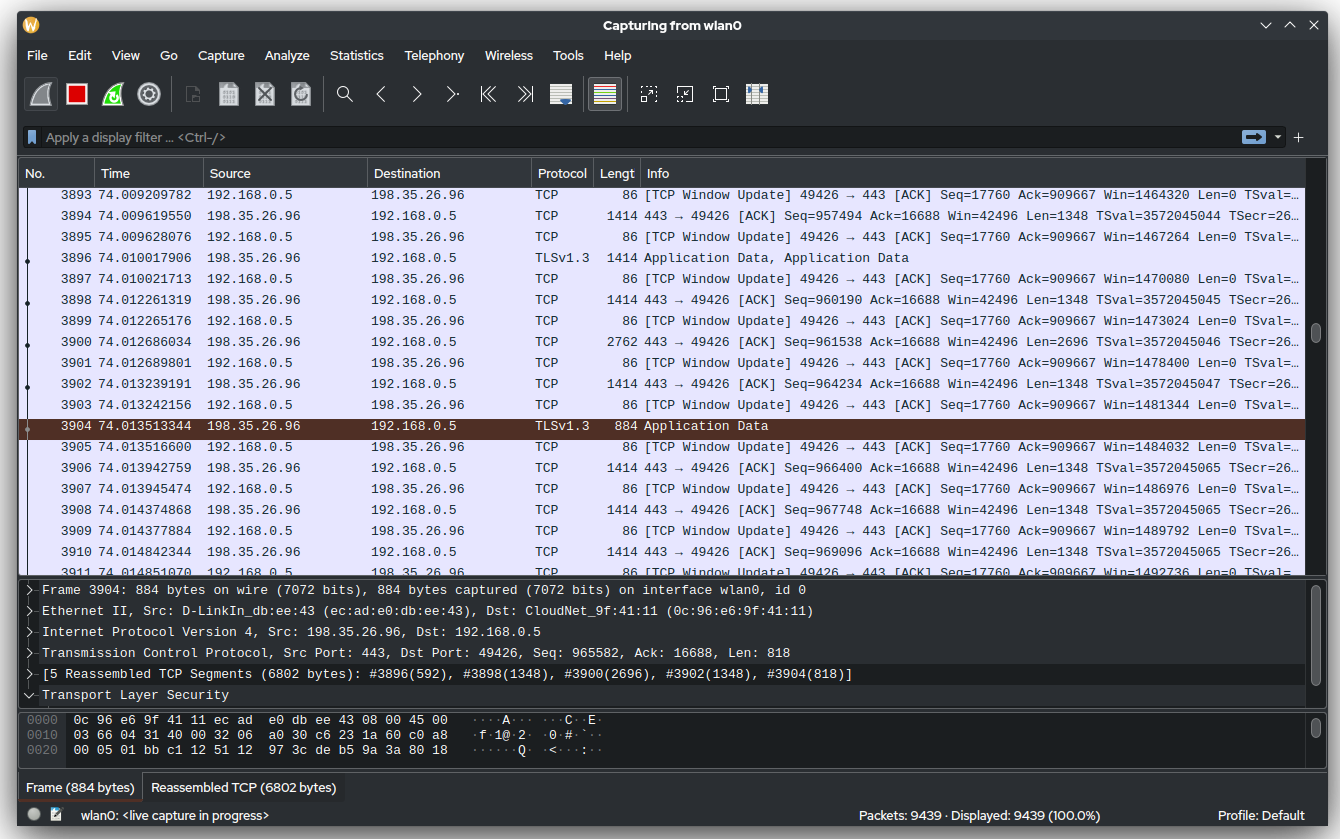
When you need the absolute ground truth of an interaction, you capture the packets. A packet capture contains the raw network data payloads and network headers transmitted over a network segment. Packet captures are typically saved in the PCAP file format.
Because you have the entire payload, security analysts use packet captures to extract malware files transmitted over unencrypted network protocols. If an attacker downloads an executable over plaintext HTTP, the actual binary code of the malware is sitting inside your PCAP file, ready to be carved out and reverse-engineered.
| Tool | Purpose | Interface |
|---|---|---|
| Wireshark | A graphical protocol analyzer used to inspect network packet captures. It reconstructs TCP streams and decodes hundreds of protocols for deep visual analysis. | Graphical User Interface (GUI) |
| Tcpdump | A command-line utility used to capture raw network packets directly from a network interface, ideal for lightweight, headless server operations. | Command-Line Interface (CLI) |
Network data tells you how the attacker arrived; endpoint logs tell you what they did once they got there.
Windows Auditing and Authentication
In a Microsoft-dominated enterprise, the Windows Security Event Log is your primary source of truth. Windows operating systems store security-related events in the Windows Security Event Log, assigning a unique numerical "Event ID" to different types of actions.
Two Event IDs are paramount for authentication investigations:
- Windows Event ID 4624 signifies a successful user logon event.
- Windows Event ID 4625 signifies a failed user logon attempt.
If an attacker is trying to guess an administrator's password, they will generate noise. Correlating multiple failed logon events (Event ID 4625) in endpoint logs can indicate an active brute-force password attack. If you see fifty 4625s followed immediately by a single 4624 for the same user account, the attacker has successfully guessed the password.
Linux Logging Paths
Linux architectures do not use an event-viewer database; they rely on plain text files organized in specific directories. Linux operating systems typically store centralized system logging data in the /var/log/syslog or /var/log/messages files, depending on the specific distribution (Ubuntu/Debian vs. Red Hat/CentOS).
When investigating unauthorized access on a Linux server, you look at a specialized file: Linux authentication events are recorded in the /var/log/auth.log or /var/log/secure files. Every SSH login, sudo privilege escalation, and failed password attempt is permanently etched into these text files.
Endpoint Detection and Response (EDR)
Standard OS logs are helpful, but modern adversaries frequently attempt to evade them by executing malware solely in memory or hijacking legitimate system processes.
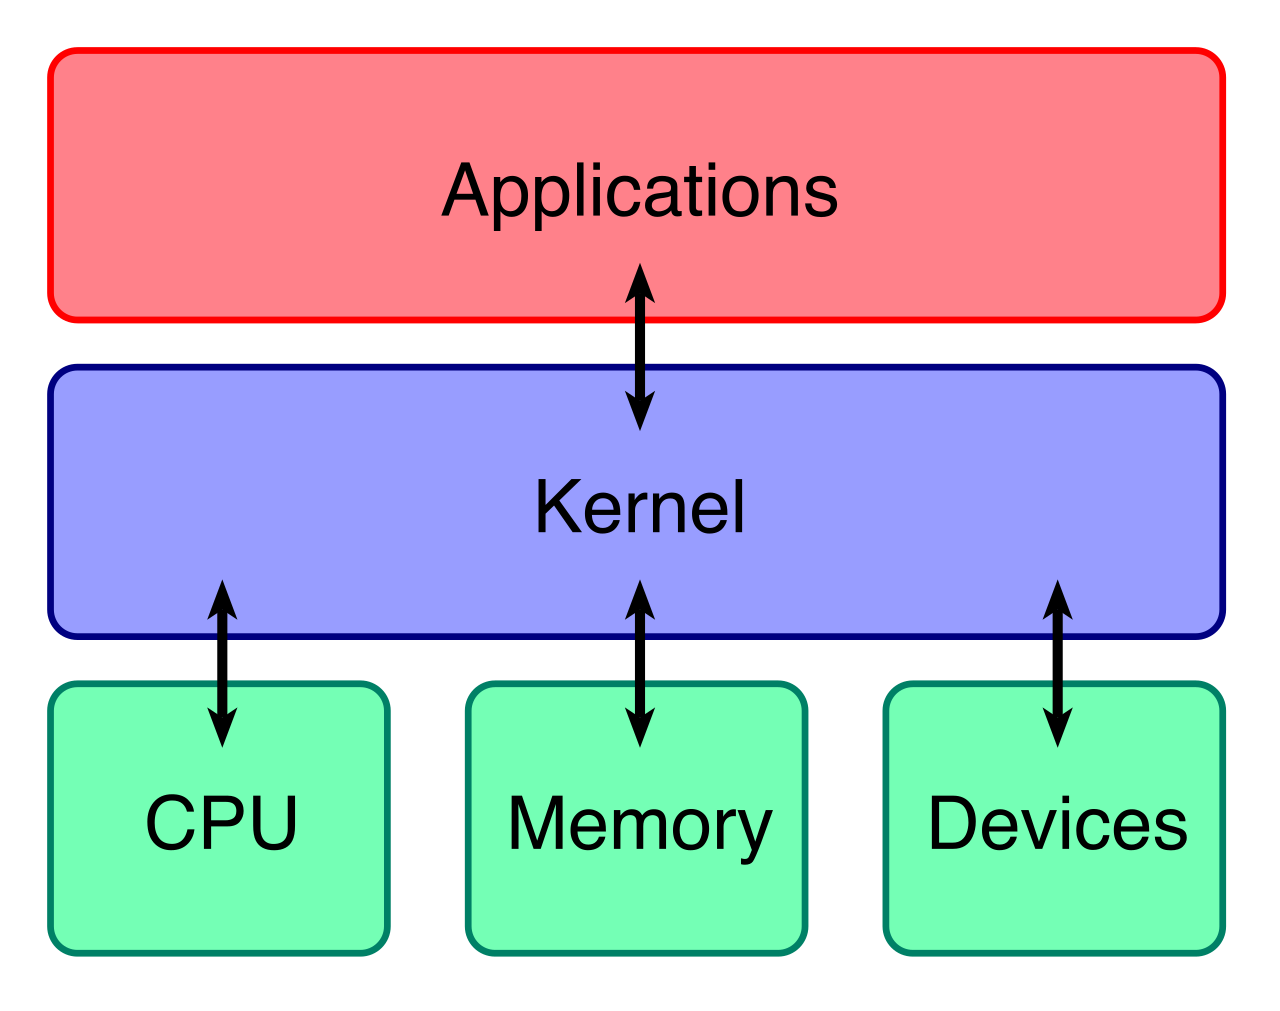
To counter this, Endpoint Detection and Response (EDR) platforms deploy lightweight agents to the operating system kernel. EDR logs provide deep visibility into host-level activities like registry modifications and injected threads. Instead of just seeing that a user logged in, an analyst reviewing EDR telemetry can see that Microsoft Word opened, spawned a suspicious PowerShell sub-process, and injected malicious code into an innocent-looking system file.
The hallmark of a senior security analyst is the ability to fuse disparate data sources. No single log tells the whole story.
Imagine you detect an unauthorized outbound connection from an internal workstation to a known Russian IP address in your firewall logs. The firewall tells you the connection occurred, but it cannot tell you which software on the workstation made the connection.
By pivoting to the endpoint, correlating endpoint process creation logs with network flow data helps trace a malicious executable to a specific outbound network connection. You can prove mathematically that at exactly 14:02:11, the EDR system recorded the creation of malware.exe, and at exactly 14:02:12, the network flow recorded that specific local port opening a connection to the foreign IP.
Beyond the Traditional Perimeter
Finally, we must recognize that the modern perimeter has dissolved into the cloud and web applications.
- Cloud infrastructure logs track API calls made to cloud service management planes. If an attacker steals an AWS or Azure credential, they won't log into a traditional desktop; they will issue API commands to spin up rogue cryptomining servers or modify Identity and Access Management (IAM) policies.
- Web Application Firewall (WAF) logs record HTTP-specific attack signatures such as cross-site scripting (XSS) attempts or SQL injections. While a standard network firewall only sees traffic on port 443, a WAF parses the actual web requests, blocking and logging the specific malicious scripts an attacker is trying to feed into your web forms.
By mastering these diverse data sources—from the raw packets of the network to the deeply nested API calls of the cloud—you equip yourself with the observational power to reconstruct any digital event, expose any adversary, and secure the modern enterprise.