The Risk Management Process: Identification and Assessment
Not sure you’re ready?
Take the ~3-minute readiness diagnostic and see where you stand.
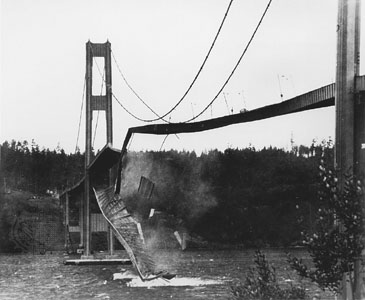
Imagine engineering a suspension bridge that is actively, continuously attacked by invisible forces attempting to dissolve its steel and shatter its concrete. You would not simply build it once, walk away, and hope for the best. You would meticulously map every stress point, calculate the exact financial ruin of a structural collapse, and install a network of sensors to detect the microscopic groaning of metal long before a cable snaps. In enterprise IT, your network is that bridge. Every server, firewall, and routing protocol you administer is subjected to persistent, evolving forces. Managing this chaotic environment requires a formalized, rigorous structure, and NIST Special Publication 800-30 provides authoritative guidelines for conducting risk assessments, serving as the definitive blueprint for this exact engineering problem.
To defend a system, we must first mathematically and procedurally comprehend its weaknesses. We do this through the precise execution of the risk management process.
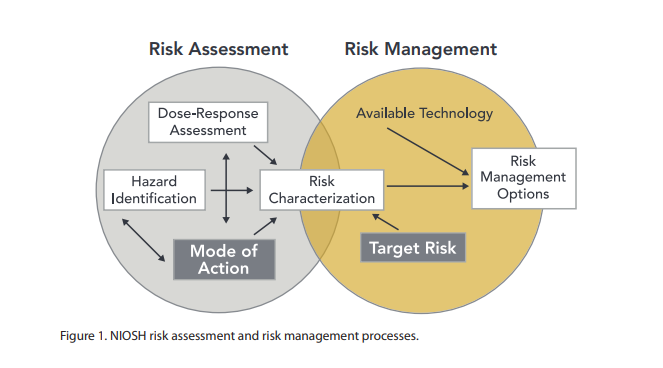
You cannot protect a ghost. In a sprawling enterprise, a rogue router plugged into a conference room wall or an orphaned virtual machine sitting on a forgotten hypervisor are invisible vectors for compromise. Therefore, an accurate asset inventory is required to properly identify all enterprise systems needing protection. Asset discovery is the non-negotiable first step of security.
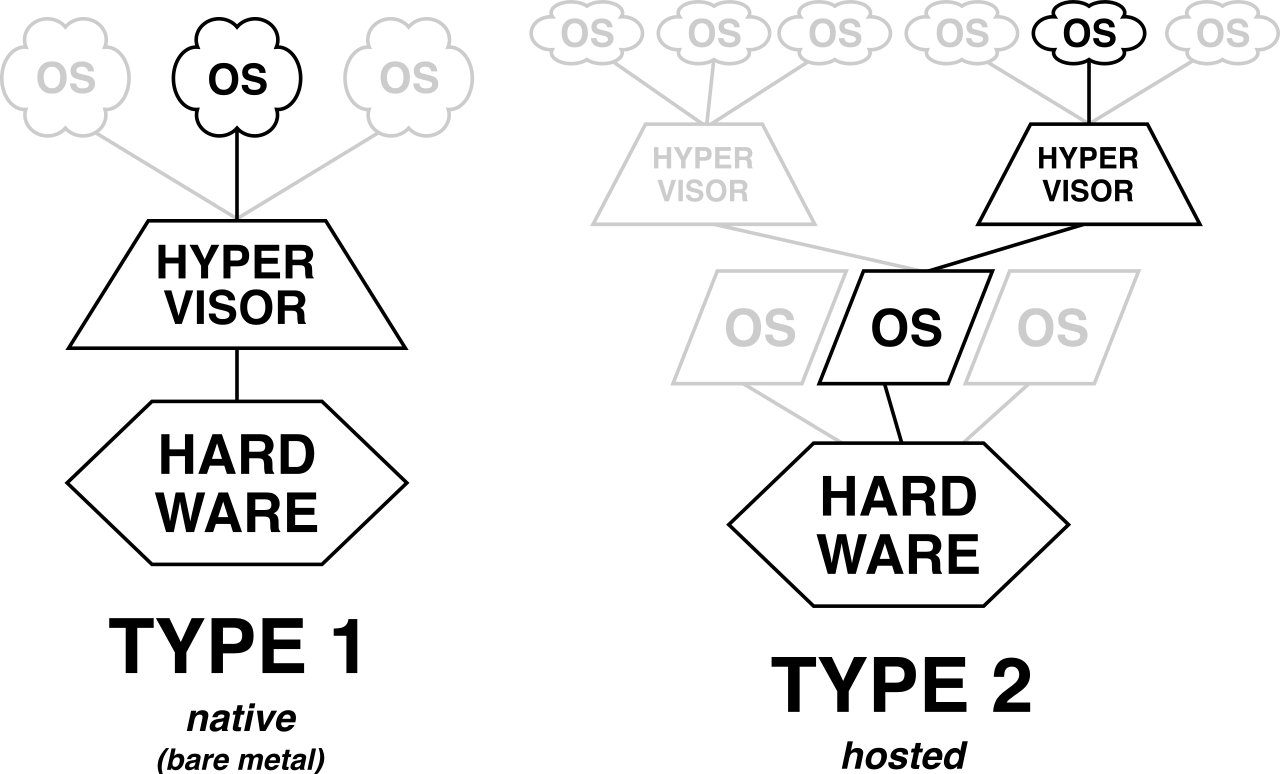
Once you possess a perfect map of what exists, you can begin risk identification, which is the formal process of discovering potential threats to enterprise assets. But identifying external threats like ransomware gangs or natural disasters is only half the equation; risk identification also involves discovering vulnerabilities currently present in enterprise systems—the unpatched operating systems, the misconfigured access control lists, and the weak cryptographic protocols.
When you look at a raw, newly spun-up server, you are observing inherent risk, which is the baseline level of risk present in a system without any mitigating controls applied. As an IT professional, your job is to apply firewalls, endpoint detection, and encryption to drive that danger down. What you are left with after the heavy lifting is residual risk—the remaining amount of risk present after security controls have been implemented.
Evaluating an IT environment is not a static event; it is a frequency. How often we measure our environment dictates how well we can respond to its degradation.
Traditionally, organizations rely on periodic risk assessments, which are conducted on a predictable schedule—such as quarterly or annually—to evaluate the current security posture. It is a routine physical checkup for the network.
However, networks are highly volatile ecosystems. When the environment drastically changes, the predictable schedule is abandoned in favor of ad hoc risk assessments, which are unscheduled evaluations triggered by specific events. For example, a major enterprise system upgrade—like migrating thousands of users from on-premise Exchange to a cloud-based architecture—can serve as the trigger for an ad hoc risk assessment. The architecture has fundamentally shifted, and the old assumptions no longer hold. Similarly, the sudden discovery of a zero-day vulnerability in a widely deployed web server framework can trigger an immediate ad hoc risk assessment to determine if the enterprise is instantly exposed.
Ultimately, the gold standard of modern security operations is continuous risk assessment. This involves ongoing system monitoring to identify new threats in near real-time. By feeding log data, configuration states, and threat intelligence into automated platforms, continuous assessment turns static risk snapshots into a live video feed of your attack surface.
Identifying a severe vulnerability is functionally useless if the knowledge evaporates into an ignored email thread. Risk management demands a rigorous ledger.
A risk register is a central database used to document and track identified enterprise risks. It acts as the central nervous system for organizational security. But databases do not make decisions; humans do. Because accountability must be absolute, a risk register explicitly records the specific individual designated as the risk owner for a given threat.
A risk owner holds the authority and accountability for managing a specific enterprise risk. If an unpatched database server is compromised, the risk owner is the executive or manager whose phone rings at 3:00 AM. Furthermore, the risk register tracks the current implementation status of chosen risk mitigation strategies, ensuring that theoretical security solutions actually mature into deployed, functional configurations.
How do you know a system is about to fail before it actually crashes? You have to watch the right dials. In enterprise management, we differentiate between looking in the rearview mirror and looking through the windshield.
Key Performance Indicators (KPIs) measure the historical success of organizational objectives. A KPI tells you that your team successfully patched 98% of workstations last month. It is useful, but it looks entirely to the past.
Key Risk Indicators (KRIs), conversely, predict future adverse events before those events cause actual damage. KRIs are metrics designed to provide an early warning of increasing risk exposure. Because they act as tripwires, KRIs alert management when a specific risk approaches an unacceptable operational level. To be effective, KRIs must be quantifiable metrics directly aligned with specific organizational risks. For example, a sudden 400% spike in daily failed authentication attempts is a KRI predicting an imminent brute-force intrusion.
| Feature | Key Performance Indicator (KPI) | Key Risk Indicator (KRI) |
|---|---|---|
| Orientation | Retrospective (Looking backward) | Predictive (Looking forward) |
| Core Function | Measures historical success of objectives | Predicts future adverse events |
| Use Case | System uptime over the last 90 days | Rate of increasing failed logins today |
Organizations exist to take risks—if a business took zero risks, it would make zero profit. But an enterprise must mathematically define the boundaries of what it can survive.
We begin with the risk appetite, which defines the broad amount of risk an organization is willing to accept in pursuit of its objectives. It is the philosophical statement of how aggressively the company behaves.
Because the real world is imprecise, we establish a risk tolerance, which specifies the maximum acceptable deviation from the established organizational risk appetite. It provides the breathing room for daily operations.
Down in the trenches, administrators need hard rules. A risk threshold is a specific numerical limit that triggers a predetermined management response when exceeded. If KRI telemetry shows a firewall's CPU utilization crossing a 90% risk threshold, automated scripts might instantly throttle non-critical traffic.
Beyond all these boundaries lies the absolute edge of the cliff: risk capacity. Risk capacity is the absolute maximum amount of risk an organization can absorb before facing operational ruin. If an event exceeds the risk capacity, the enterprise effectively ceases to exist.
When a threat is identified, leadership will inevitably ask you two questions: How bad is it? and How much will it cost us? We answer these questions using two distinct lenses: subjective triage and objective mathematics.
Qualitative Risk Assessment: The Quick Triage
Qualitative risk assessment evaluates risks using subjective categories such as low, medium, or high. When you are assessing dozens of vulnerabilities rapidly, you need a way to sort them without spending weeks doing actuarial math.
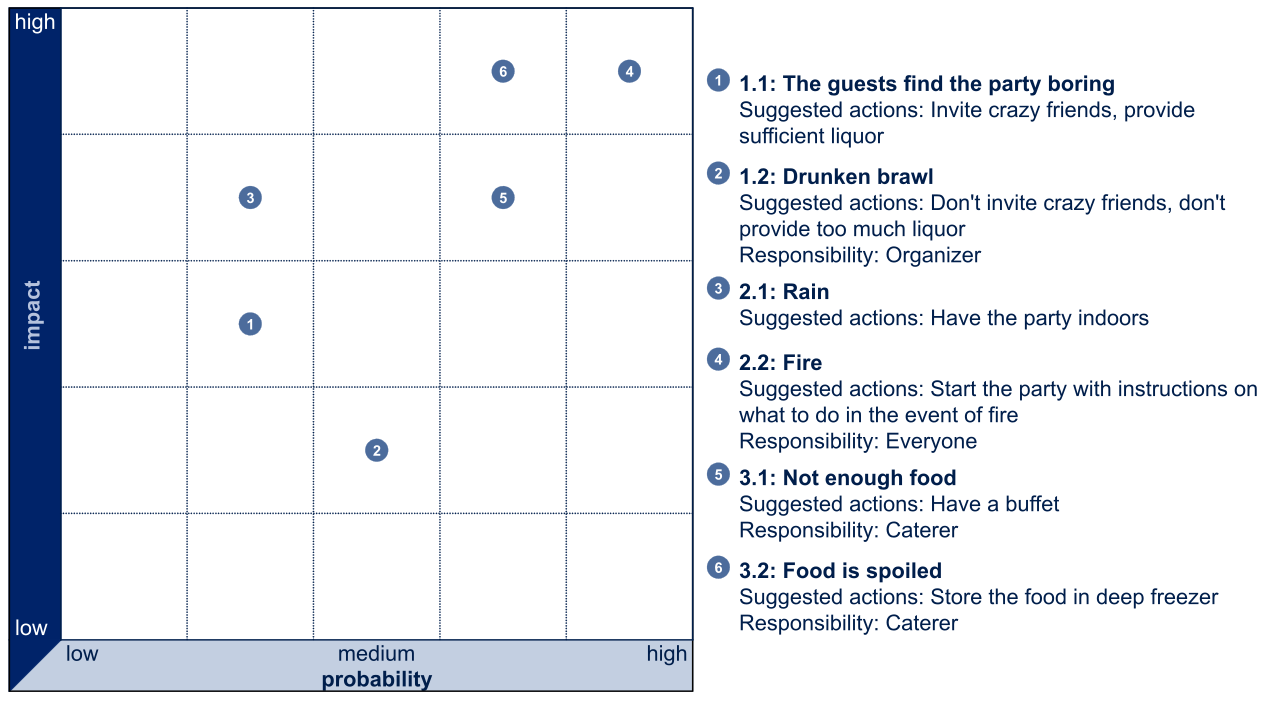
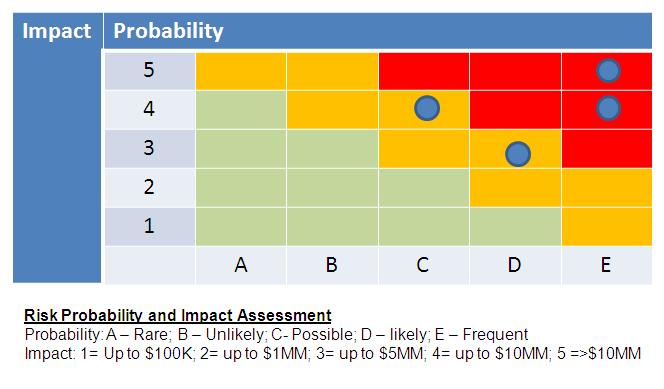
To visualize this, we use a risk matrix, which is a qualitative tool used to map the likelihood of a risk against its potential business impact. By plotting likelihood on one axis and impact on the other, you create a grid. To make this instantly readable for executives, we overlay a risk heat map, which uses distinct colors—usually vibrant greens, yellows, and deep reds—to visually communicate the severity of evaluated risks.
Quantitative Risk Assessment: The Actuarial Mathematics
Colors and subjective categories are highly useful for rapid triage, but you cannot take a red square on a heat map to a Chief Financial Officer and ask for a $250,000 security budget. You must speak the cold, hard language of finance.
Quantitative risk assessment assigns an objective monetary value to potential risk events. Because it requires mathematical precision rather than human intuition, quantitative risk assessment relies on historical incidence data to predict future financial losses.
We derive these losses using specific formulas that calculate the expected financial impact of a disaster over time.
First, we determine the raw value of what we are protecting (the Asset Value, or AV). Next, we must understand how much of that asset is destroyed if a threat succeeds. The Exposure Factor (EF) represents the expected percentage of asset value lost during a specific threat incident.
If we multiply the value of the asset by the percentage we expect to lose, we calculate the Single Loss Expectancy (SLE). The Single Loss Expectancy is the total expected financial loss from a single occurrence of a threat.
Single Loss Expectancy Calculation SLE=Asset Value (AV)×Exposure Factor (EF)
Example: If a database is worth $1,000,000 to the business (AV), and a successful data exfiltration event would destroy 30% of its value in regulatory fines and lost trust (EF), the SLE is $300,000. Every single time this attack succeeds, the business bleeds $300,000.
But how often will this actually happen? To figure this out, we consult our historical incidence data to find the Annualized Rate of Occurrence (ARO). The Annualized Rate of Occurrence is the estimated number of times a specific threat will occur within a single year. If an attack is expected to happen once every ten years, the ARO is 0.1. If it happens twice a year, the ARO is 2.0.
Finally, we calculate the ultimate metric: the Annualized Loss Expectancy (ALE). The Annualized Loss Expectancy is the total expected financial loss from a specific threat over the course of one year. It is calculated by multiplying the Single Loss Expectancy by the Annualized Rate of Occurrence.
Annualized Loss Expectancy Calculation ALE=Single Loss Expectancy (SLE)×Annualized Rate of Occurrence (ARO)
Example Continued: If our SLE is $300,000 and historical data shows this type of breach occurs once every four years (an ARO of 0.25), then our ALE is $75,000.
Why does this matter to an IT administrator? Because the ALE gives you the absolute maximum amount of money you should spend on mitigating a specific threat per year. If a vendor tries to sell you an intrusion prevention system for $150,000 a year to stop an attack that only has an ALE of $75,000, the math proves the control is mathematically worse than the risk itself.
By mastering these mechanics—from maintaining the strict inventory of assets to predicting annualized financial destruction—you transform the chaotic, reactive art of troubleshooting into the rigorous, calculated science of enterprise risk management.