Security Alerting and Monitoring Computing Resources
Not sure you’re ready?
Take the ~3-minute readiness diagnostic and see where you stand.
Consider a modern enterprise IT infrastructure not as a static collection of hardware and code, but as a sprawling, highly trafficked metropolis. To secure this city, you cannot simply stand on a single street corner and hope a crime occurs right in front of you. You need traffic cameras on the highways, security ledgers at the entrances of commercial buildings, and constant monitoring of the power grid. In a digital environment, malicious actors do not announce their presence; they leave microscopic ripples in the data streams of your network. Identifying a compromised server, an insider threat, or a stealthy data exfiltration attempt requires us to capture those ripples, centralize them, and mathematically filter out the noise until only the genuine threats remain. We achieve this through rigorous system monitoring, disciplined log aggregation, and highly tuned active alerting.
Before we can analyze anything, we must generate raw data. Visibility is the foundational principle of all cybersecurity operations. If a system exists in your environment, it must generate a continuous, verifiable record of its activities. Continuous monitoring involves the ongoing observation of systems to detect security threats, ensuring that no action occurs in the dark.
We segment this monitoring across four primary domains of computing resources:
1. Endpoints
The endpoint—whether it is a user's laptop or an internal file server—is often the final target of an attacker. Monitoring endpoint computing resources provides visibility into user activity and local system processes. By watching the endpoint, we can detect anomalous behavior, such as an unauthorized PowerShell script executing in memory or a user attempting to access files outside their department's clearance.
2. Network Infrastructure
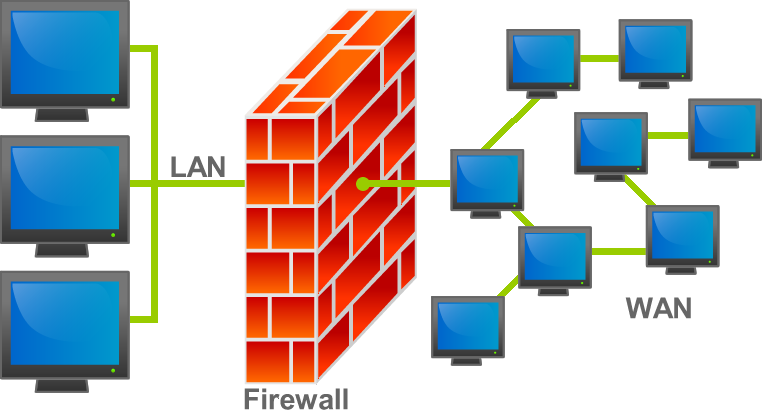
If endpoints are the buildings, the network is the road system. Network infrastructure monitoring analyzes traffic flows across routers and switches to identify anomalous communication patterns. To achieve this practically, administrators rely on the Simple Network Management Protocol (SNMP), which is used to monitor the status and performance of network infrastructure devices. If a core switch suddenly experiences a massive spike in CPU utilization or interface traffic, SNMP traps act as the early warning system. Furthermore, firewall logs record traffic that is permitted or denied access through a network boundary. A sudden influx of denied connections on a specific exterior port is often the first indicator of a reconnaissance scan.
3. Applications
We must also look inside the software itself. Application logging captures specific software events like user authentications and database queries. If a user attempts to log into an HR portal and fails twenty times in a minute, the network layer will only see encrypted HTTPS traffic; only the application log will reveal the brute-force attempt.
4. Cloud Infrastructure
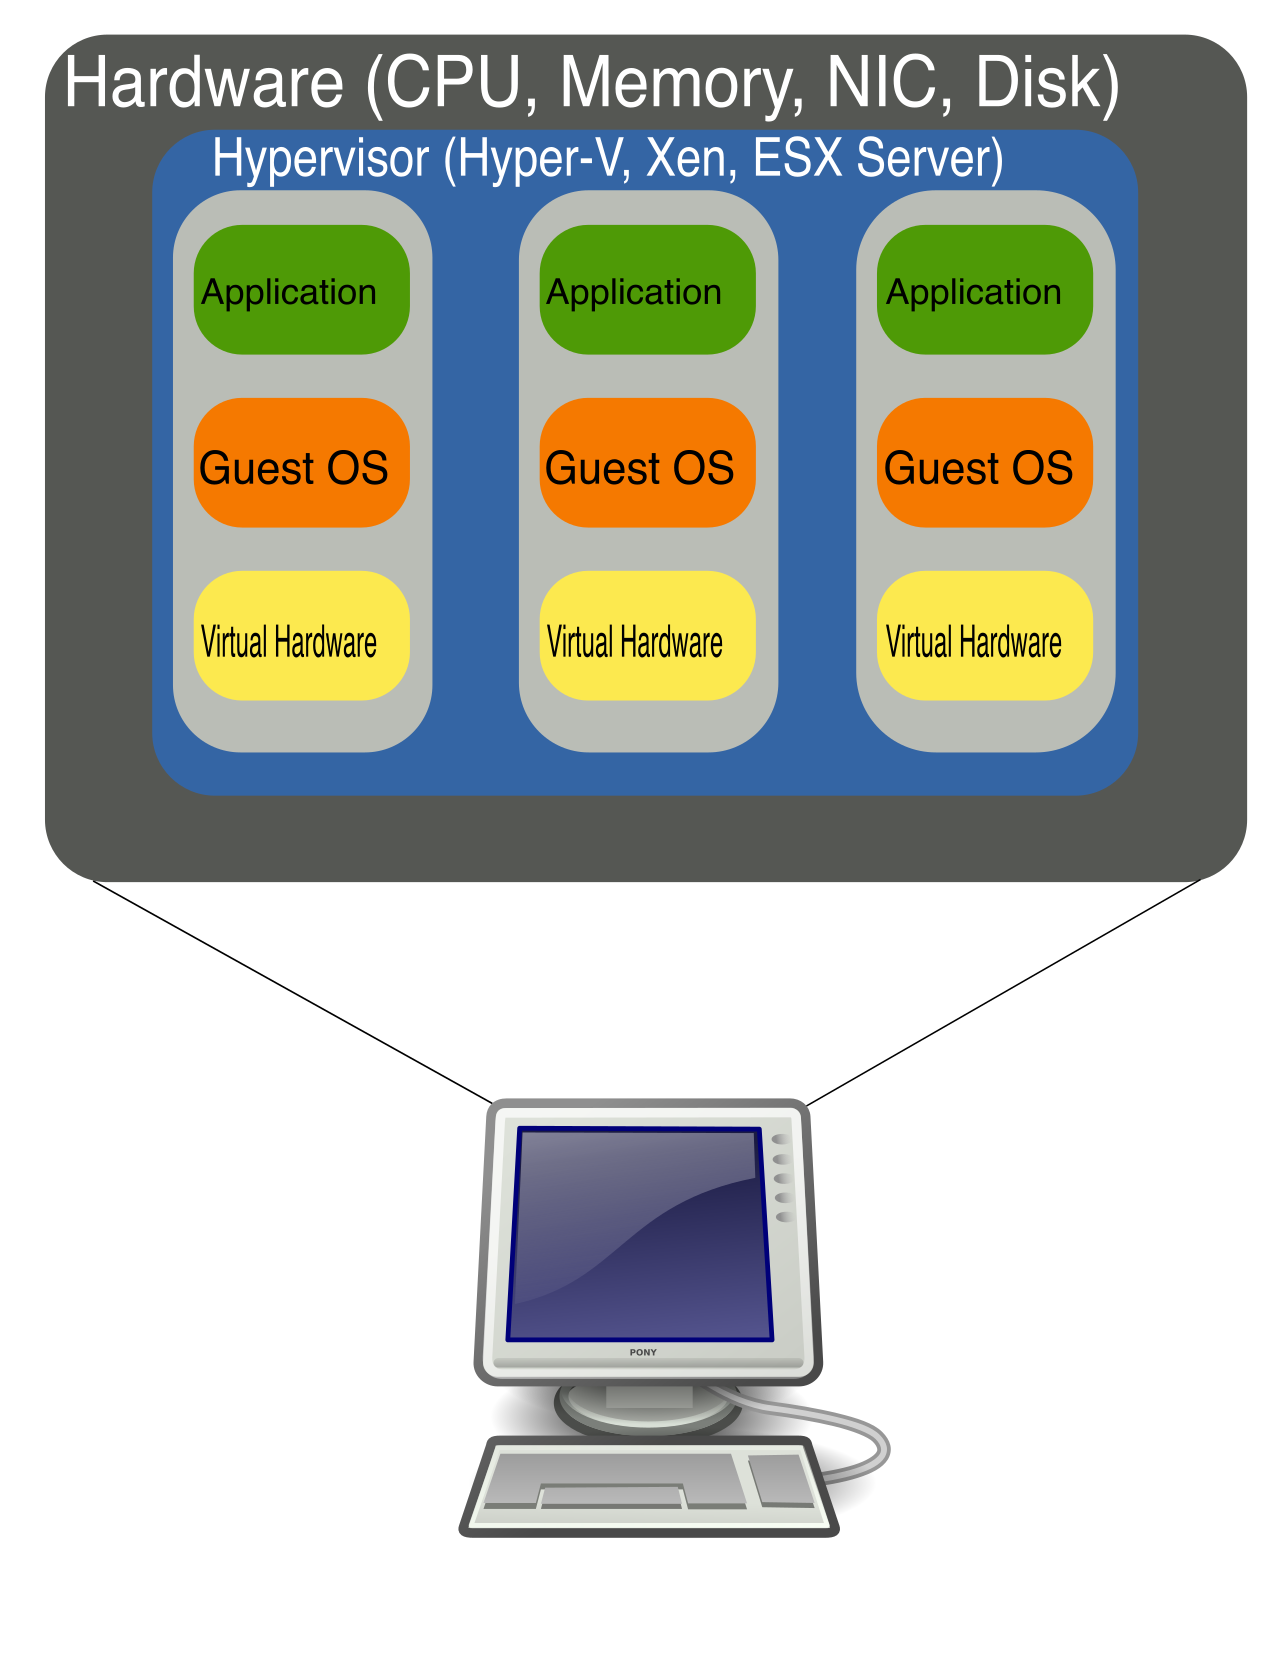
Modern networks are rarely confined to on-premises hardware. Cloud infrastructure monitoring tracks resource utilization and access logs for virtualized environments. Because you do not own the physical servers in AWS or Azure, you must rely heavily on API-driven cloud monitoring tools to detect unauthorized IAM (Identity and Access Management) role assumptions or unexpected spinning up of virtual machines.
Generating logs is easy. Making sense of them is incredibly difficult. Imagine receiving millions of pages of documents per day, written in dozens of different languages, with no chronological order. This is the reality of raw log generation.
To solve this, we rely on centralized logging, which consolidates logs from multiple computing resources into a single repository.
How do logs get from a router to your central server? For most network devices and Linux systems, Syslog is a standard protocol used for sending log messages to a centralized logging server on IP networks. Conversely, Microsoft environments operate differently; the Windows Event Viewer uses specific log channels including Application, Security, and System logs.
Once centralized, we perform log aggregation, which simplifies the querying and correlation of security events across an entire network. However, aggregation alone is not enough. A Cisco firewall, an Apache web server, and a Windows domain controller structure their logs entirely differently. We must parse this data. Log normalization standardizes log data from disparate sources into a common format for analysis. This means translating every vendor's unique way of stating "Source IP" into a single, unified database column.
The Absolute Necessity of Time
If there is one technical detail that can single-handedly ruin a forensic investigation, it is clock drift.
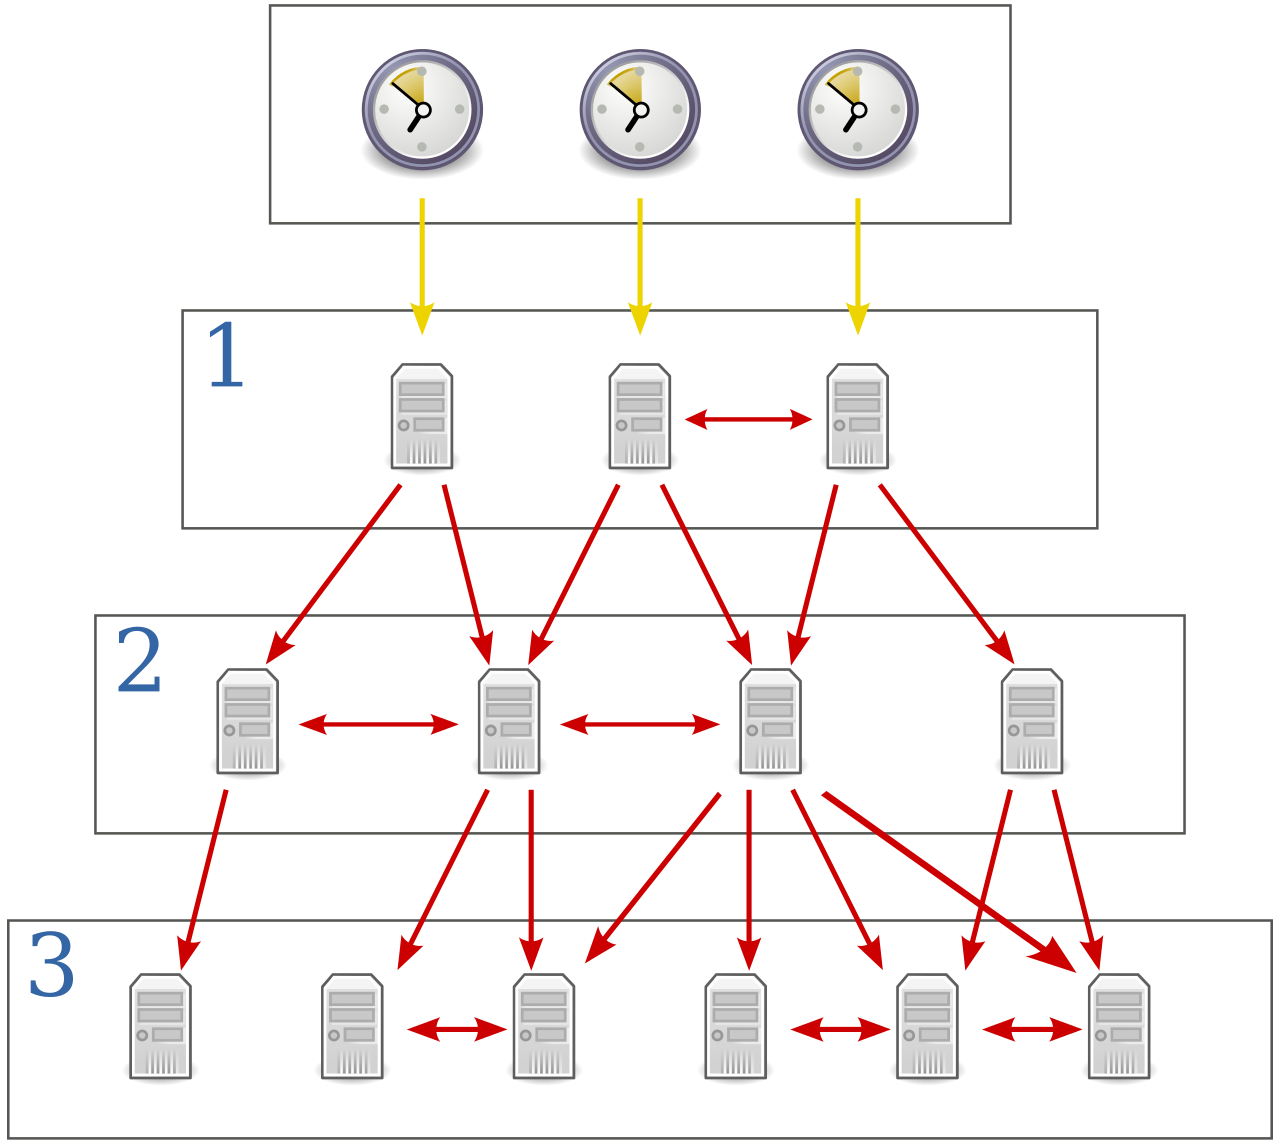
Network Time Protocol (NTP) synchronizes the clocks of computing resources across a network.
Why does this matter? Imagine an attacker breaches your firewall at 10:05 AM and executes a payload on your server at 10:06 AM. If the server's local clock is accidentally five minutes fast, its log will say the payload executed at 10:11 AM. When you review the logs, the timeline is fundamentally broken. Synchronizing system clocks with Network Time Protocol ensures accurate timestamp correlation when analyzing aggregated logs. Without NTP, establishing a chain of events across multiple machines is computationally and logically impossible.
Protecting the Truth: WORM Storage
If you rob a bank, your very first instinct is to destroy the security tapes. The same applies to cyber attacks: the first post-exploitation action an attacker takes is often attempting to wipe the system logs to cover their tracks.
To counter this, we implement specialized storage mechanics. Write Once Read Many (WORM) storage prevents aggregated log files from being altered or deleted after creation. Once a log is written to a WORM drive, neither a system administrator nor an attacker with root privileges can modify it. Consequently, securing aggregated log files with Write Once Read Many storage protects the integrity of forensic evidence, ensuring that when you hand your logs over to law enforcement or an incident response team, the data is mathematically proven to be untampered.

Once we have a centralized, normalized, time-synchronized, and tamper-proof repository of logs, we require an analytical engine to make sense of the billions of daily events.
A Security Information and Event Management (SIEM) system provides real-time analysis of security alerts generated by applications and network hardware.
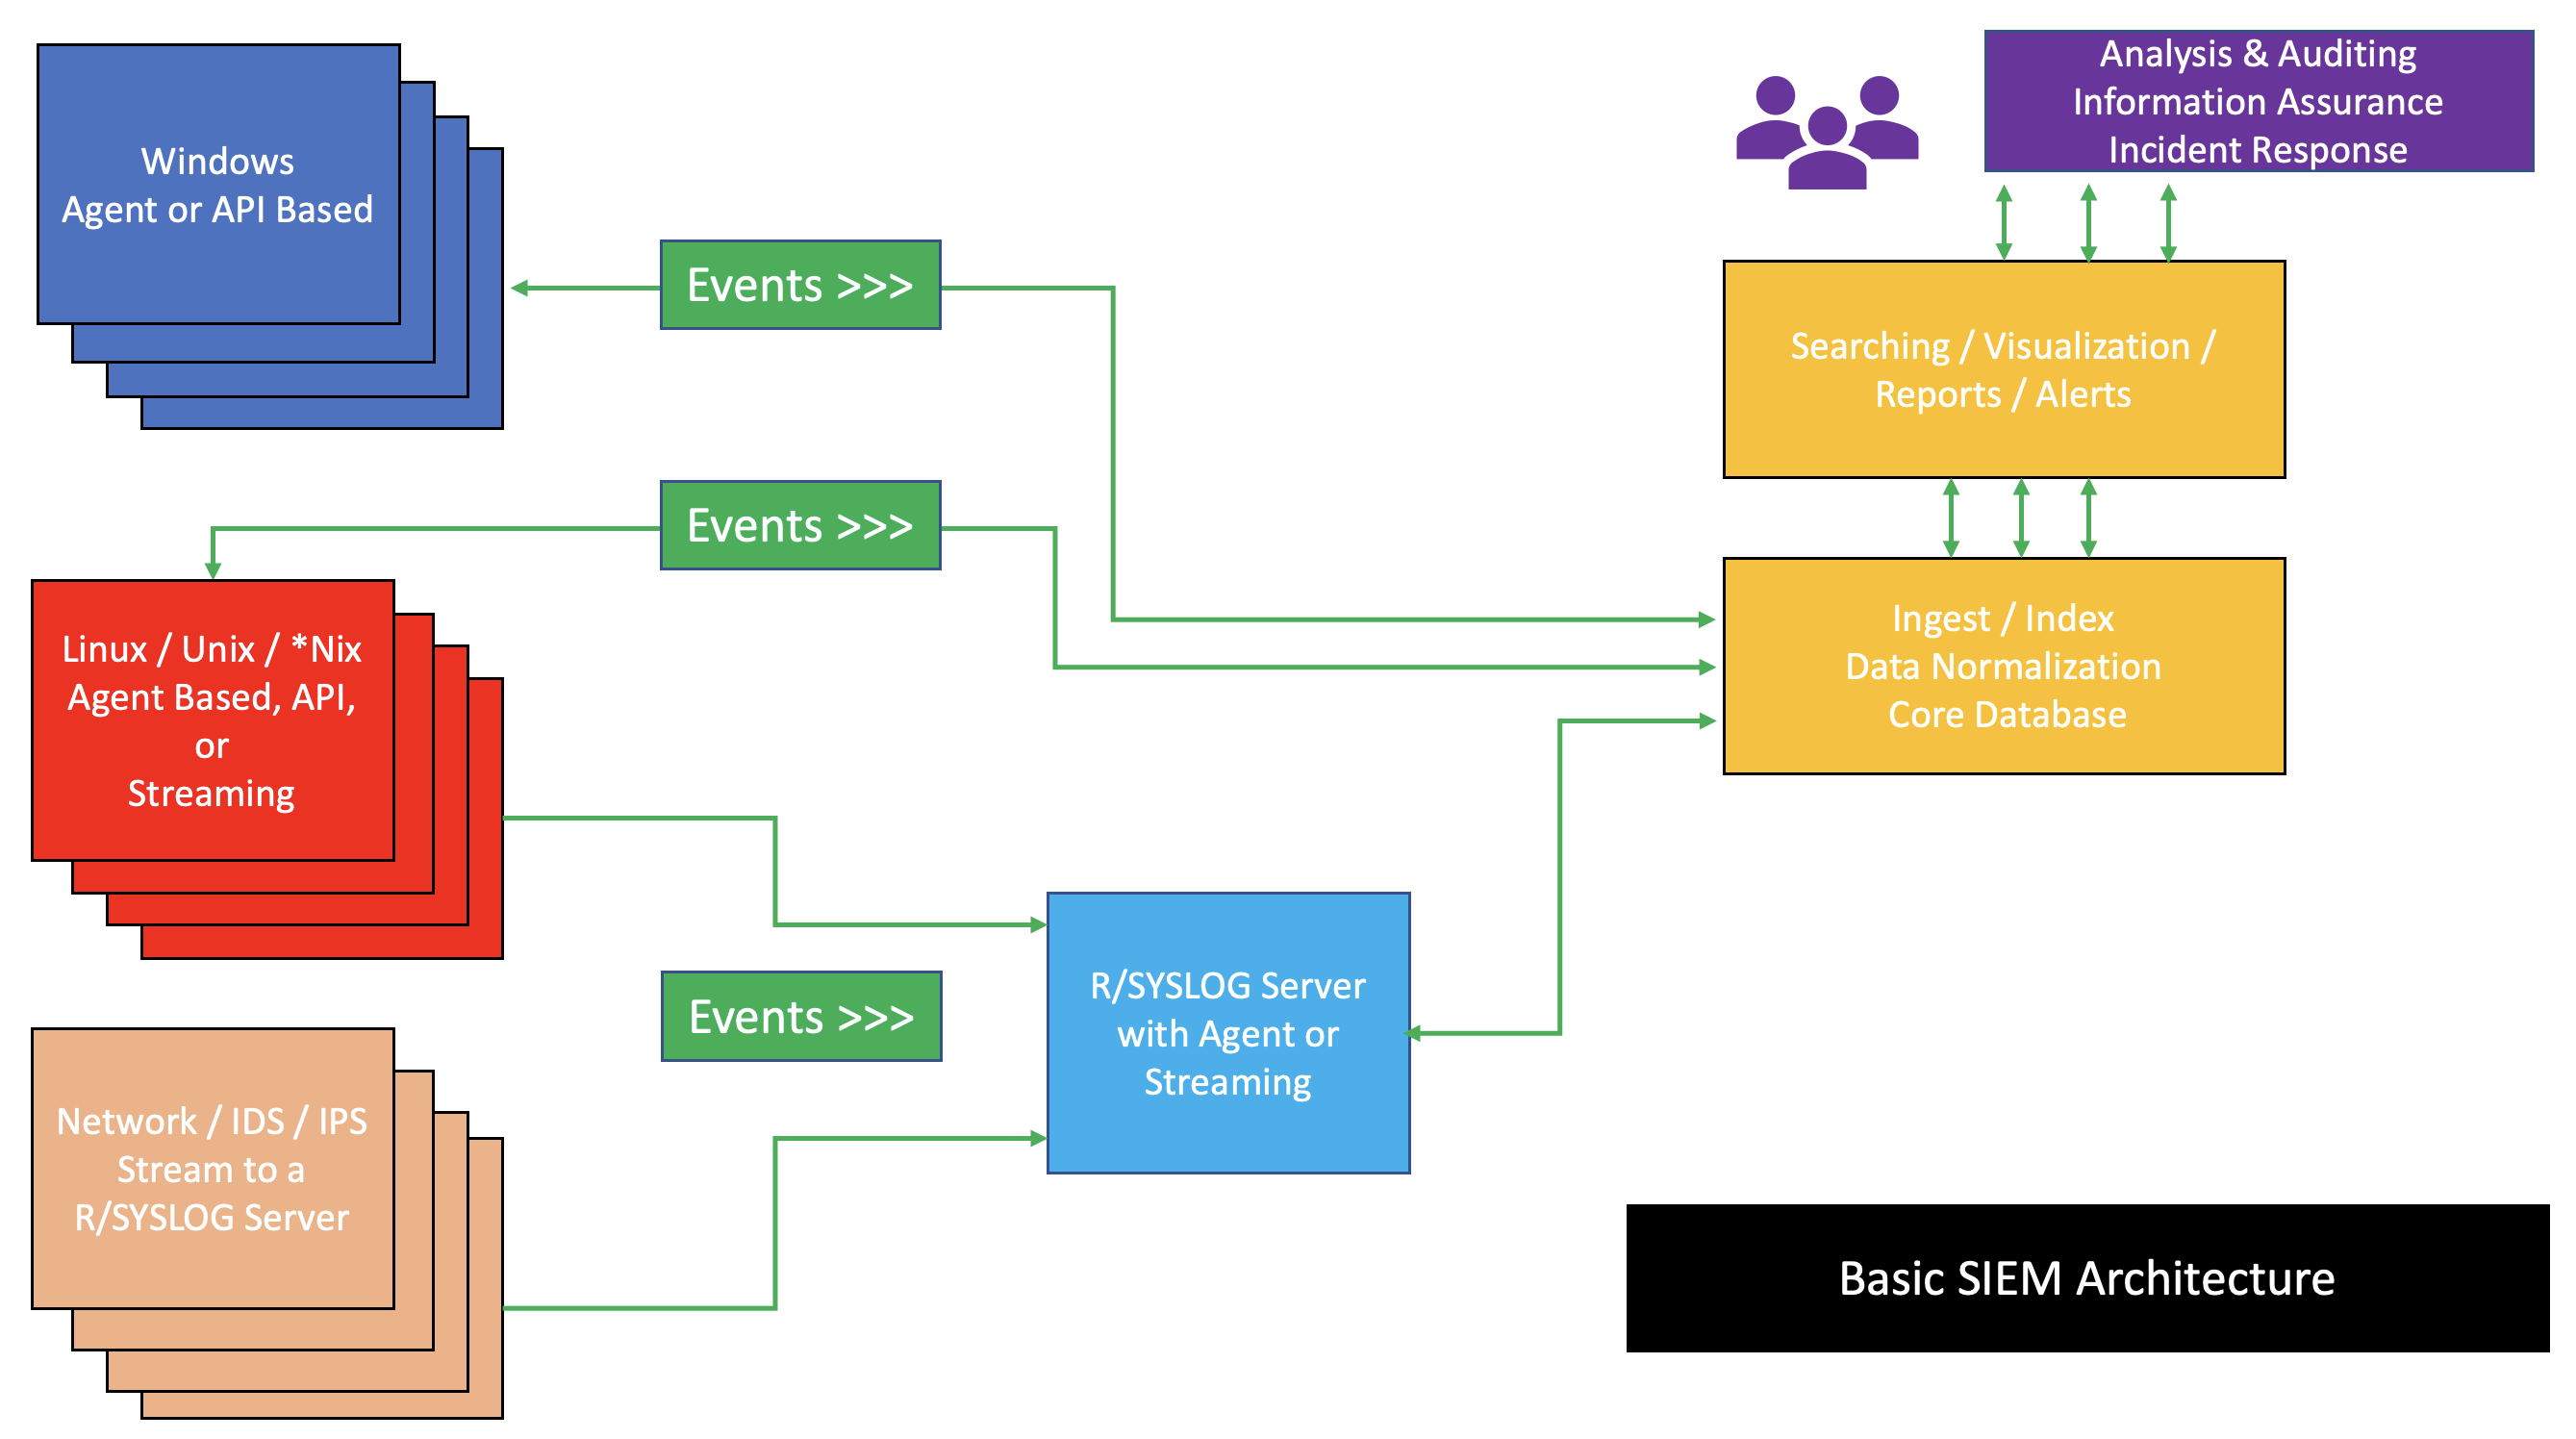
A SIEM does not merely store logs; it acts as an active analytical brain. It operates primarily through event correlation rules, which use logic to identify complex attacks by connecting multiple isolated log events.
Consider a standard "Low and Slow" attack:
- Event A: A firewall logs a permitted SSH connection from a foreign IP address. (Normal behavior for a remote employee).
- Event B: An application log records three failed logins followed by a successful login. (Normal behavior for someone who forgot their password).
- Event C: An endpoint log shows an unusually large ZIP file being created. (Normal behavior for a data backup).
- Event D: A network infrastructure log shows a massive outbound data flow to the same foreign IP from Event A.
Viewed individually, none of these logs justify waking up a security engineer at 3:00 AM. But when fed into a SIEM, an event correlation rule binds them together: IF [Foreign IP connects] AND [Authentication is brute-forced] AND [Large archive is created] AND [Outbound traffic spikes], THEN trigger a Critical Exfiltration Alert.
If your SIEM alerts on every minor anomaly, your security operations center will fail. We evaluate the effectiveness of our detection rules using a matrix of four possible outcomes:
| Detection Outcome | Description | Security Impact |
|---|---|---|
| True Positive | A true positive alert indicates that a security tool successfully detected an actual malicious event. | Ideal. The system works, and the threat is caught. |
| False Positive | False positive alerts occur when a security system incorrectly flags benign activity as a threat. | Problematic. Wastes analyst time and degrades trust in the system. |
| True Negative | The system correctly ignores benign, normal activity. | Ideal. The system operates quietly in the background. |
| False Negative | A false negative occurs when a security system fails to detect an actual malicious event. | Catastrophic. A breach occurs entirely undetected. |
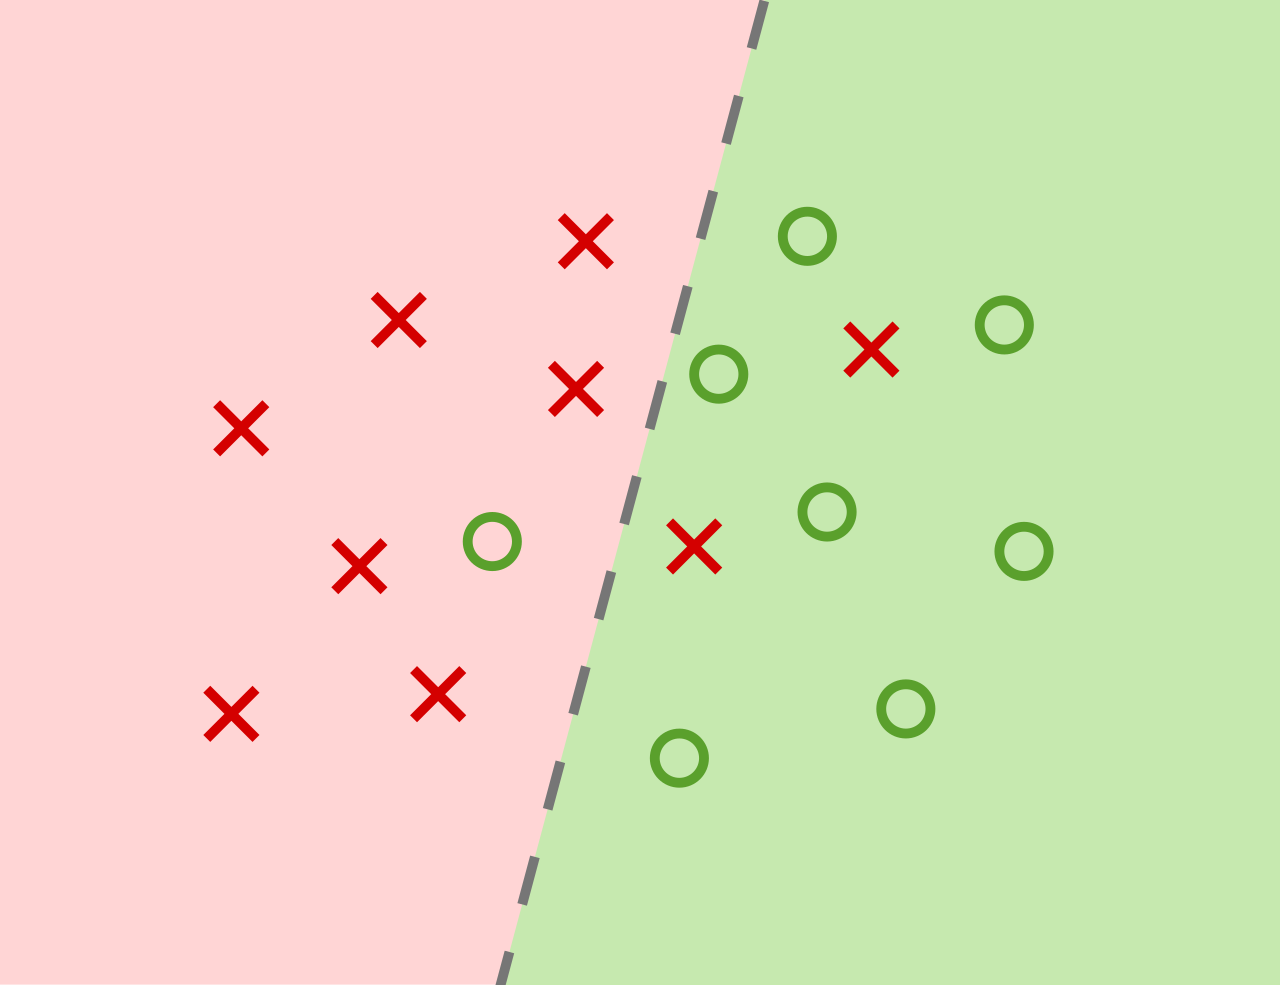
In an effort to avoid False Negatives (missing a real attack), administrators often make their SIEM rules overly sensitive. This leads to a flood of False Positives.
When an analyst's dashboard is drowning in hundreds of false alarms every hour, human psychology takes over. Alert fatigue occurs when security analysts become desensitized to a high volume of frequent alerts. An analyst suffering from alert fatigue will inevitably ignore or blindly close a valid True Positive because it is buried beneath a mountain of junk. Therefore, reducing false positive alerts helps prevent security analysts from experiencing alert fatigue, directly increasing the actual security posture of the organization.
The Mechanics of Tuning
How do we reduce this noise?
First, we utilize alert tuning, which is the process of adjusting security detection rules to reduce the volume of false positive alerts. If an alert triggers every time a system administrator runs a legitimate network scan, we tune the rule to explicitly exclude the IP address of the administrator's workstation.
Second, we adjust alert thresholds, which define the specific conditions or activity levels required to trigger a security notification. If your threshold for a "Brute Force Attack" is set to 3 failed logins, users forgetting their passwords will generate endless false positives. By tuning the threshold to 20 failed logins within a 60-second window, you filter out human error and only catch automated attacks.
Finally, we implement alert deduplication. This collapses multiple identical security alerts into a single notification to reduce analyst workload. If a misconfigured internal server pings an unauthorized port 10,000 times a minute, the analyst does not need 10,000 emails. Deduplication ensures they receive one alert stating: "Unauthorized port access [Count: 10,000] in the last 60 seconds."
Passive logging and alerting are only half of the equation. A mature security environment proactively looks for weaknesses before an attacker can exploit them.
Alongside your SIEM, continuous vulnerability scanning helps identify unauthorized open ports on monitored network devices, as well as unpatched software and misconfigurations. Rather than waiting for a firewall log to tell you someone is attacking an exposed database port, continuous scanning actively alerts you that the port was accidentally left open by a developer hours before an attacker even discovers it.
When all these systems function harmoniously—when the vulnerability is missed, the attacker strikes, the logs are generated via Syslog, normalized, synchronized via NTP, securely stored on WORM, and correlated by the SIEM to trigger a True Positive alert—what happens next?
Speed is the ultimate weapon in incident response. Relying entirely on a human to read an alert and begin typing commands is too slow. Modern environments use playbooks, which automate the initial incident response actions triggered by specific security alerts.
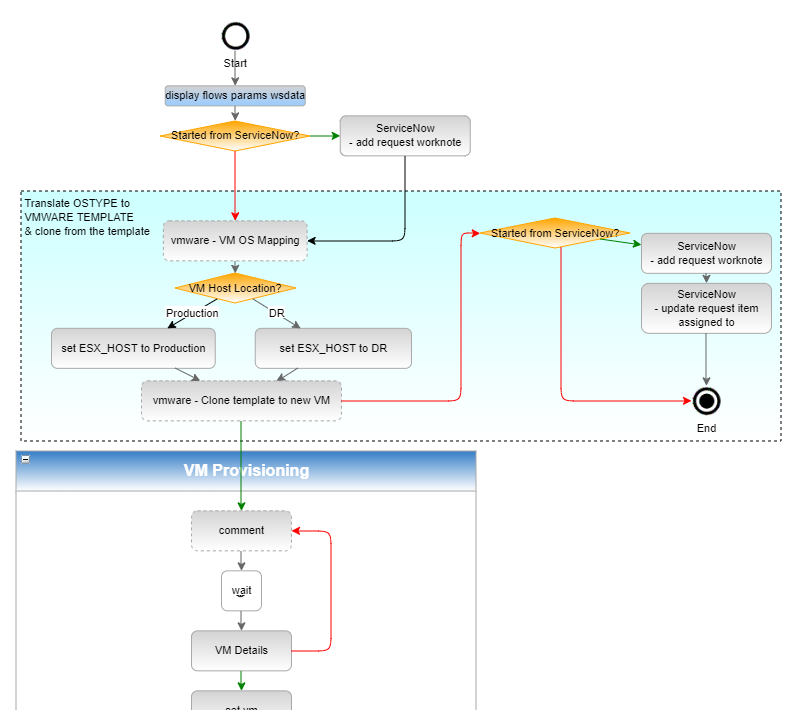
If your highly tuned SIEM fires a high-confidence alert that a user's machine is exhibiting ransomware behavior, a playbook can automatically execute an API call to the network switch, instantly quarantining the machine to a dead VLAN before the security analyst even opens the notification.
By mastering log aggregation, disciplined alert tuning, and automated response, you transform your network from a reactive, vulnerable target into an intelligent, self-defending ecosystem.