Hardware Tools and Basic Device Commands
Not sure you’re ready?
Take the ~3-minute readiness diagnostic and see where you stand.
When a network fails, the resulting silence is inherently ambiguous. A server suddenly unreachable from a workstation could be the victim of a severed fiber optic line buried under a parking lot, or it could be the result of a single transposed digit in a routing table thousands of miles away. The technician's job is to systematically collapse this wave of possibilities into a single, observable truth. This process requires two distinct modes of investigation: leveraging physical testing instruments to interrogate the actual copper and glass, and executing operating system commands to reveal the logical decisions made by the silicon brains of routers and switches.
Troubleshooting begins at Layer 1 of the OSI model. Software lies; operating systems will often report a connection as "healthy" simply because a driver is loaded. To find physical truths, we must use physical tools.
Verifying Hardware Capability and Power
If you suspect a workstation or switch port is physically damaged, you must isolate the hardware from the rest of the network. A loopback plug is a testing device that physically connects the transmit pins directly to the receive pins on a network interface. By sending a signal out and immediately receiving it back, network technicians use loopback plugs to verify that a network interface card possesses the hardware capability to successfully send and receive data. If a ping to the loopback address succeeds with the plug inserted, the hardware is functionally sound.
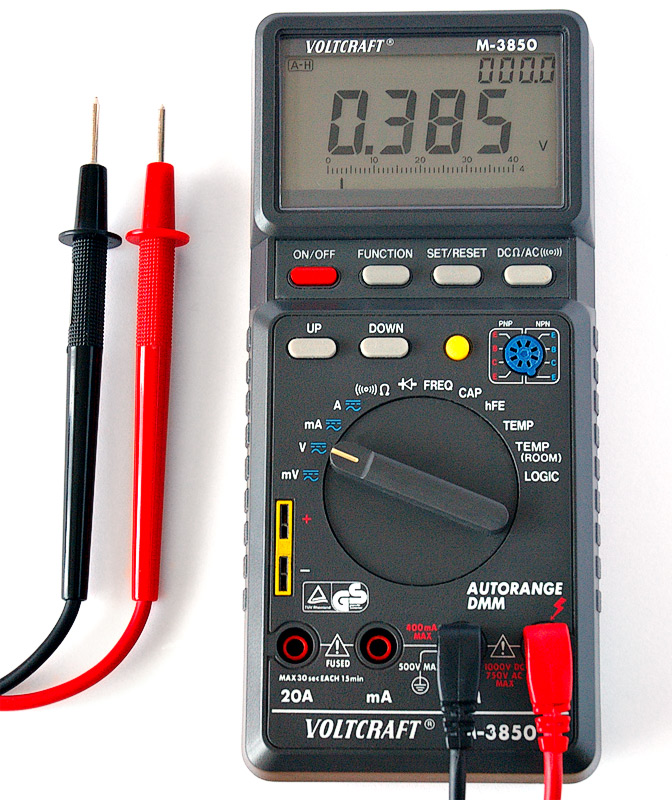
Modern networks also deliver power. A multimeter is an electronic measuring instrument that tests electrical voltage, current, and resistance across a circuit. In the networking world, data is useless if the device won't power on. Network technicians use multimeters to verify that Power over Ethernet (PoE) equipment is receiving adequate electrical voltage down the twisted pairs.
Tracing and Validating the Copper
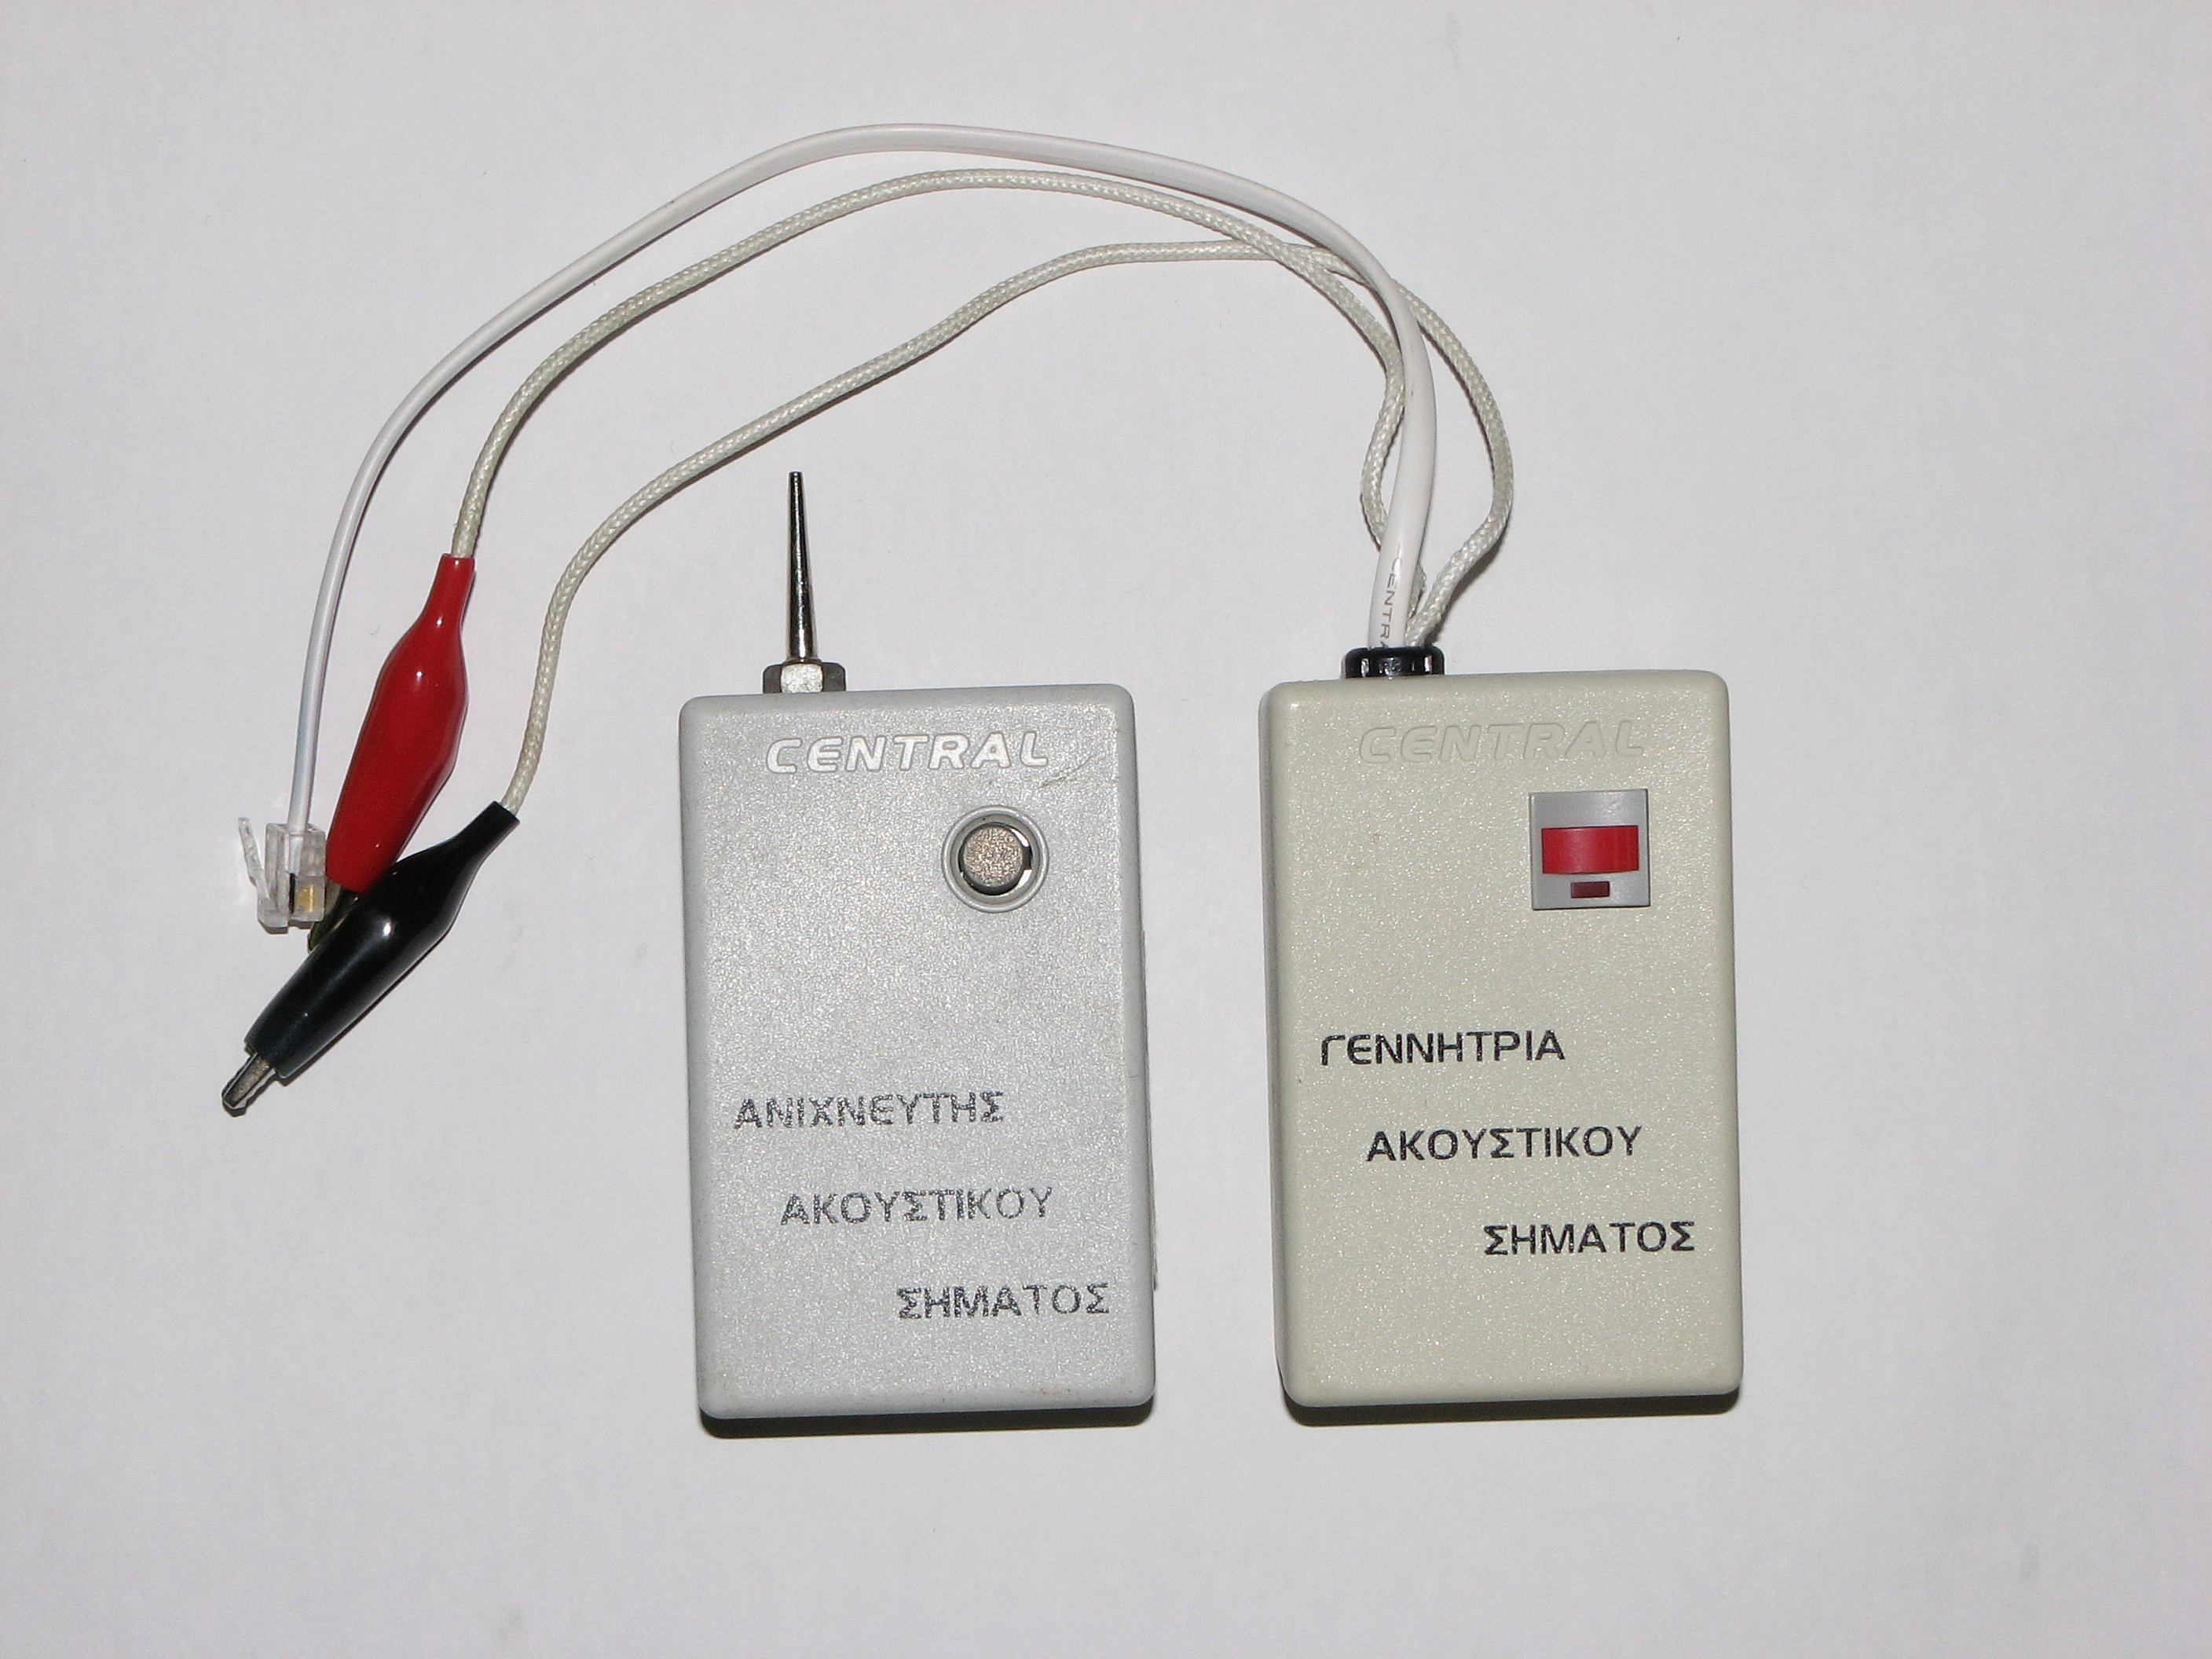
Wiring closets in the real world are rarely perfectly labeled. When you are staring at a massive, undocumented bundle of cables and need to find the exact line running to a specific wall jack, you cannot simply tug on it. Instead, you use sound. A tone generator is a physical hardware device that injects a continuous audio signal into a specific network cable at the wall jack. Back in the closet, you use a tone probe—an inductive wand that detects the audio signal emitted by a tone generator to locate a specific cable within a dense bundle. By waving the wand over the cables, the audio pitch rises as you get closer to the injected signal. Together, network technicians use tone generators and probes together to trace unlabelled copper cables through walls and wiring closets.
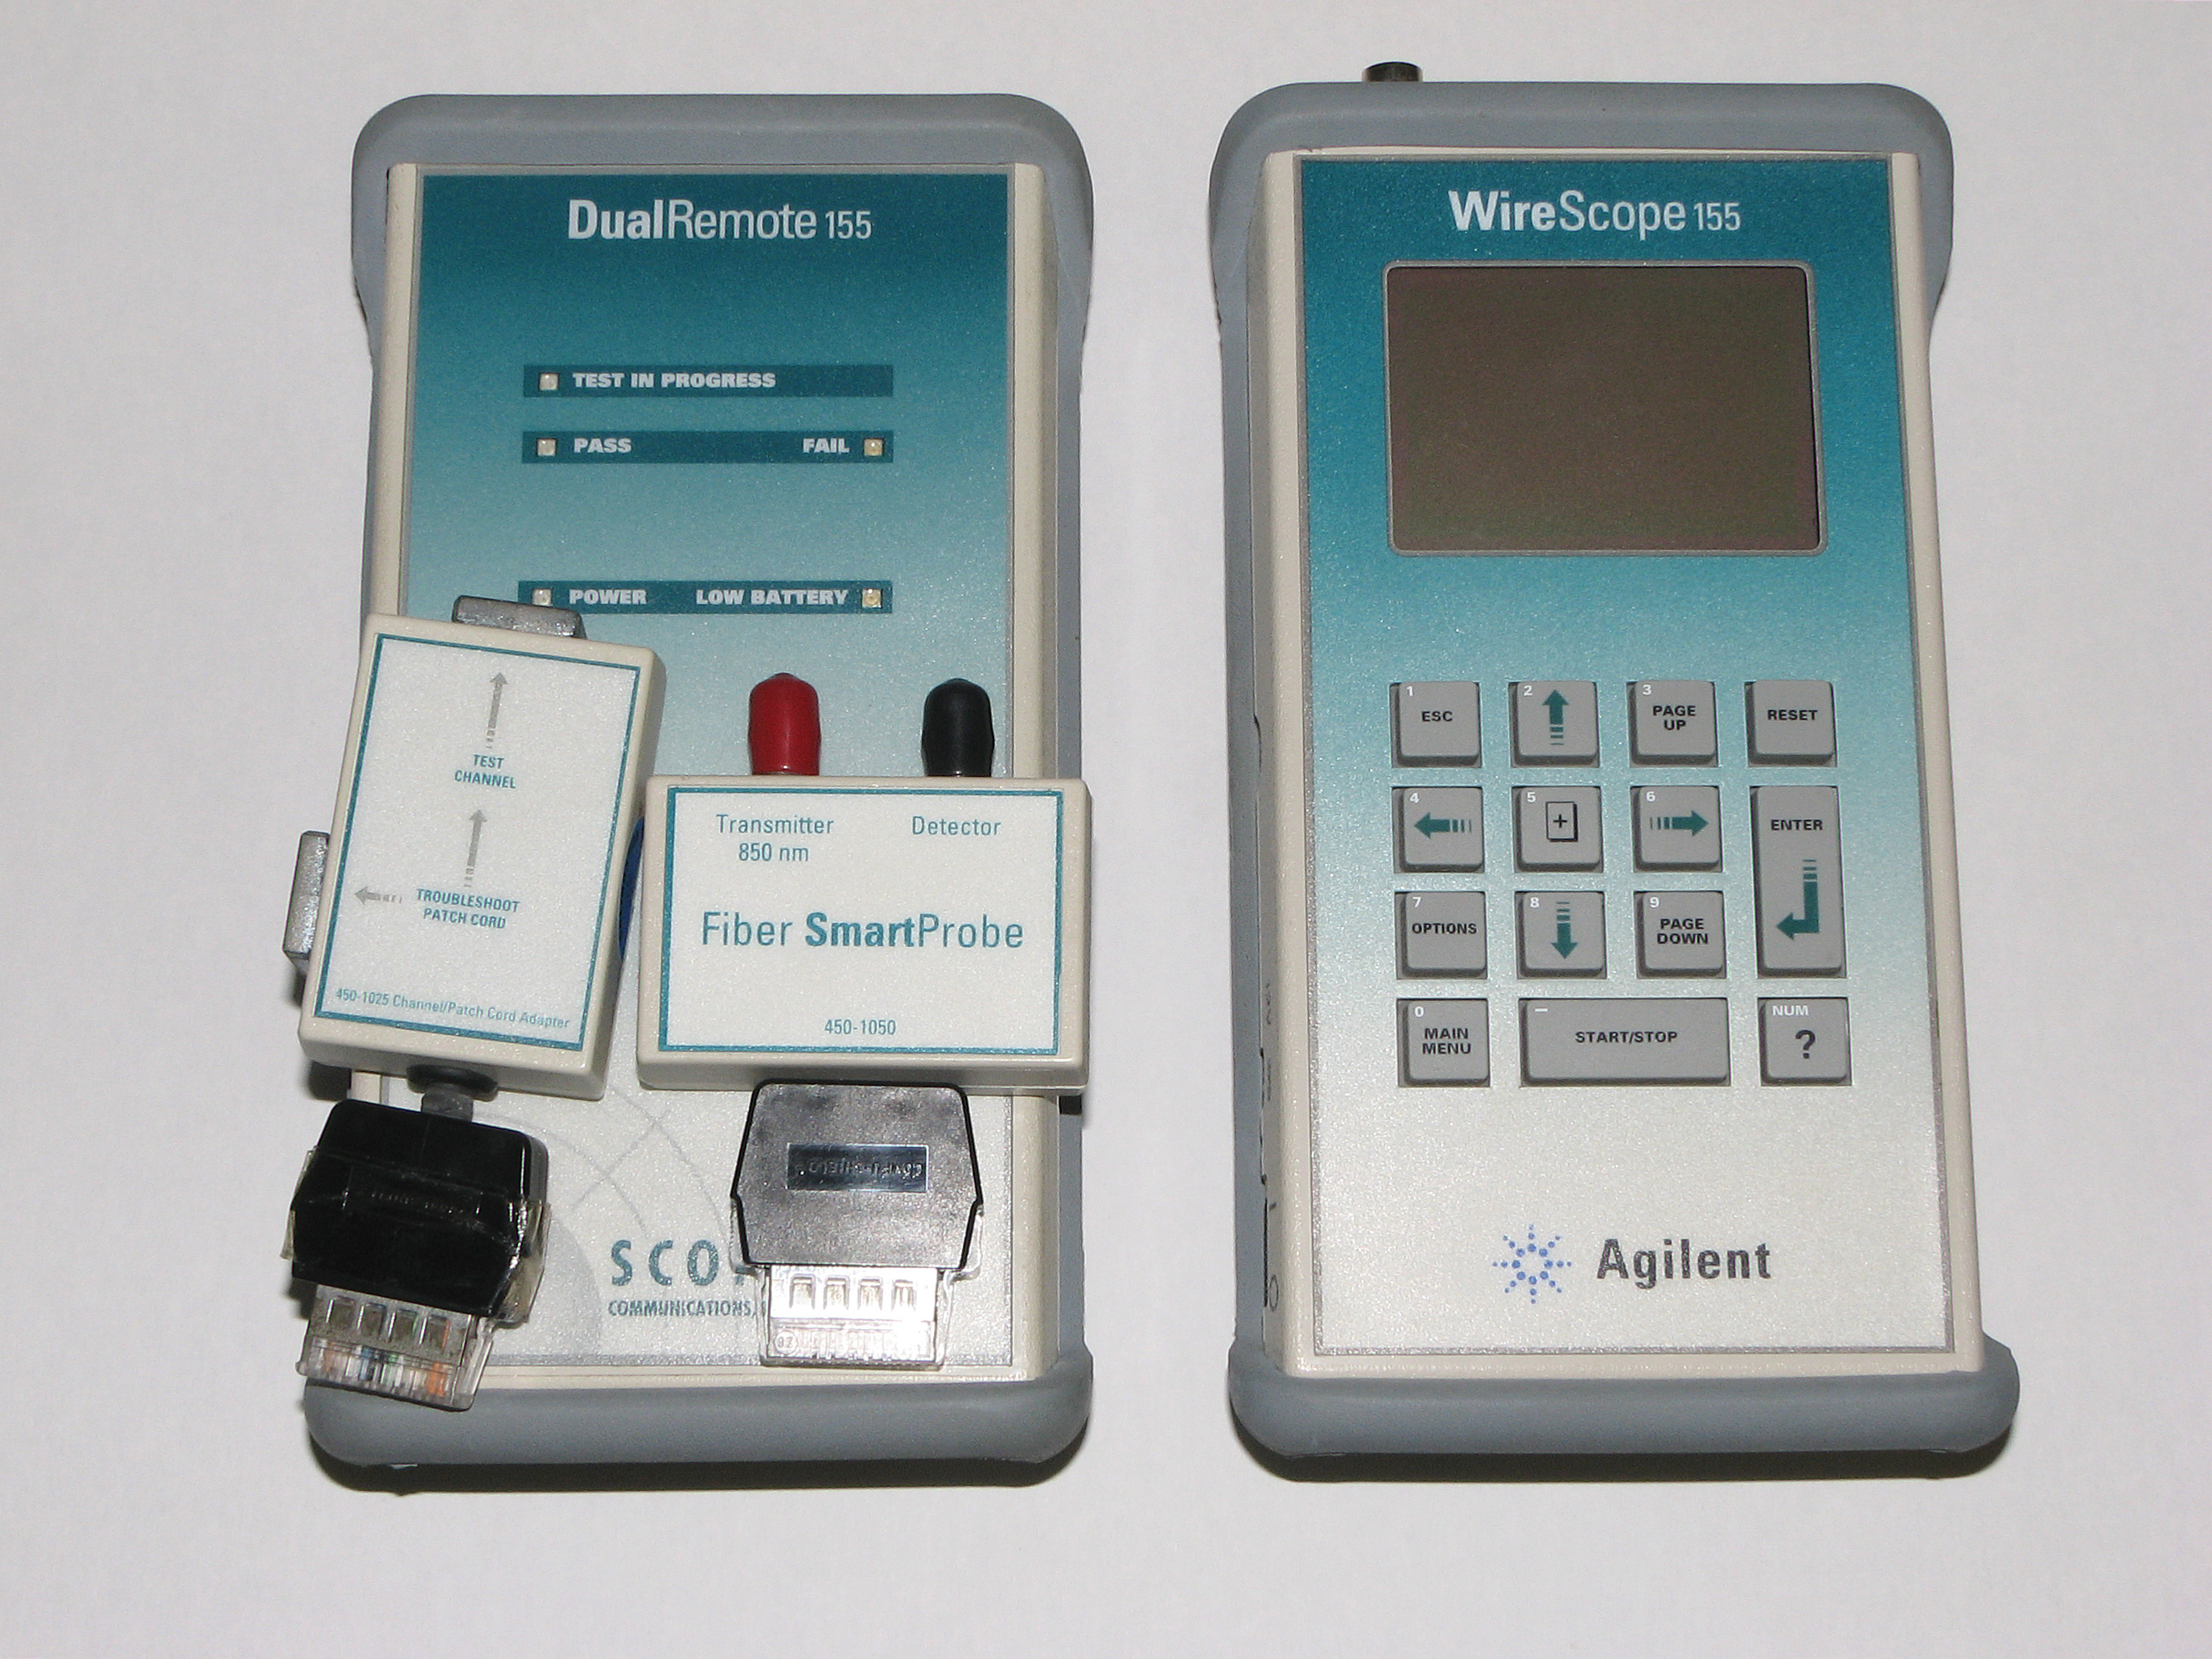
Once the cable is found, you must prove it works. A basic cable tester verifies electrical continuity across all pins of a copper network cable. It simply confirms that an electrical signal can travel from Pin 1 to Pin 1, Pin 2 to Pin 2, and so on. But continuity isn't enough; humans make mistakes when crimping RJ-45 connectors. Therefore, advanced cable testers identify specific wiring faults including open circuits, short circuits, and crossed wire pairs.
Finding the Break: The Science of Reflectometry
What happens when a cable tests "open" (broken), but that cable is running through 300 feet of industrial ceiling space? You cannot tear down the ceiling to find the break. You must use reflectometry—the same scientific principle behind radar and sonar.
By sending a pulse down the wire and listening for the echo, a Time Domain Reflectometer (TDR) measures the time it takes for an electrical signal to bounce back from a fault to determine the exact distance to a copper cable break. Because the speed of electricity through copper is a known constant, the tool simply multiplies the speed by the time of the echo to tell you, "The cable is severed exactly 142 feet away."
Fiber optics require the same logic, but with light. An Optical Time Domain Reflectometer (OTDR) analyzes light backscatter in a fiber optic cable to calculate the physical distance to a splice or fracture.
A Crucial Exception for Fiber: OTDRs struggle to detect faults that are extremely close to the testing device due to the intense initial burst of light blinding the sensor (an area known as the "dead zone"). To find damage at the patch panel itself, a Visual Fault Locator (VFL) injects visible laser light into a fiber optic cable to visually expose breaks or sharp bends near the cable endpoints. The protective jacket of the damaged fiber will physically glow where the laser light is escaping.
Capturing Traffic Truths
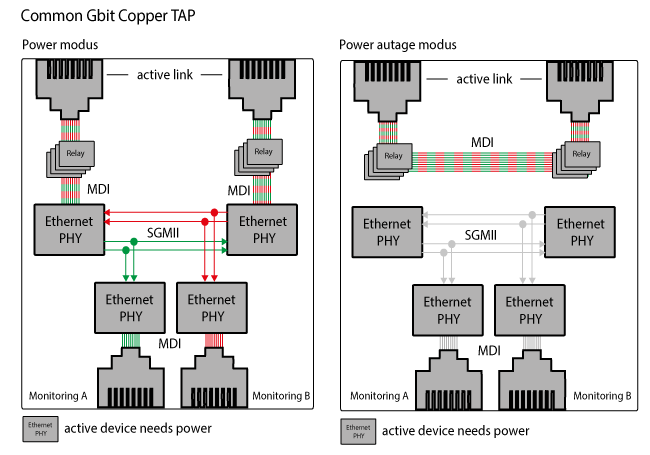
Sometimes the physical line is perfect, but the data traversing it is suspect. To see what is actually happening on the wire without altering it, we use a network tap. A network tap is a physical hardware device inserted inline between two network nodes to silently copy passing traffic for monitoring. While you could configure a switch to copy traffic in software (Port Mirroring/SPAN), network taps provide a highly reliable method of capturing network traffic because dedicated physical taps do not drop packets under heavy network loads. The hardware literally splits the electrical or optical signal, guaranteeing zero packet loss for your security tools or packet analyzers.
Wireless networking replaces copper cables with radio frequencies (RF) traveling through the air. Because the physical medium is invisible and shared by every device in the room, troubleshooting requires making the RF spectrum visible.
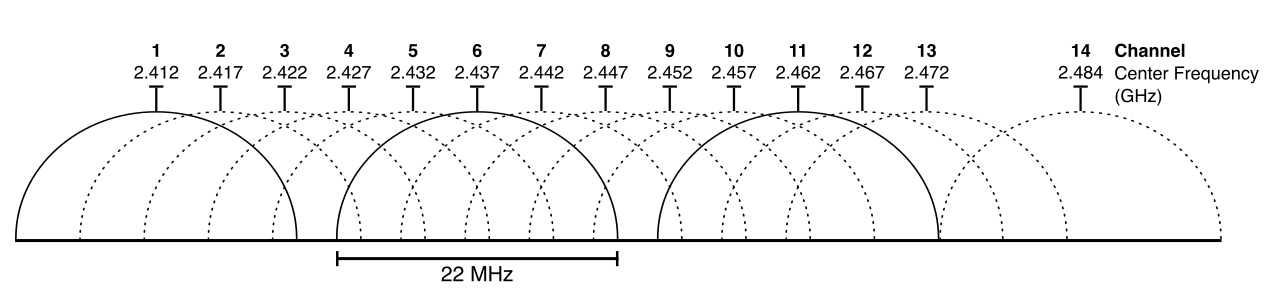
A Wi-Fi analyzer maps active wireless networks and displays their operating frequencies. If users complain about slow Wi-Fi, the issue is often physics: too many radios shouting over each other. Network technicians use Wi-Fi analyzers to troubleshoot wireless interference by identifying overlapping frequency channels used by neighboring access points. Furthermore, Wi-Fi analyzers measure the Received Signal Strength Indicator (RSSI) to map out wireless coverage dead zones within a building, revealing exactly where a signal is absorbed by a concrete wall or metal elevator shaft.
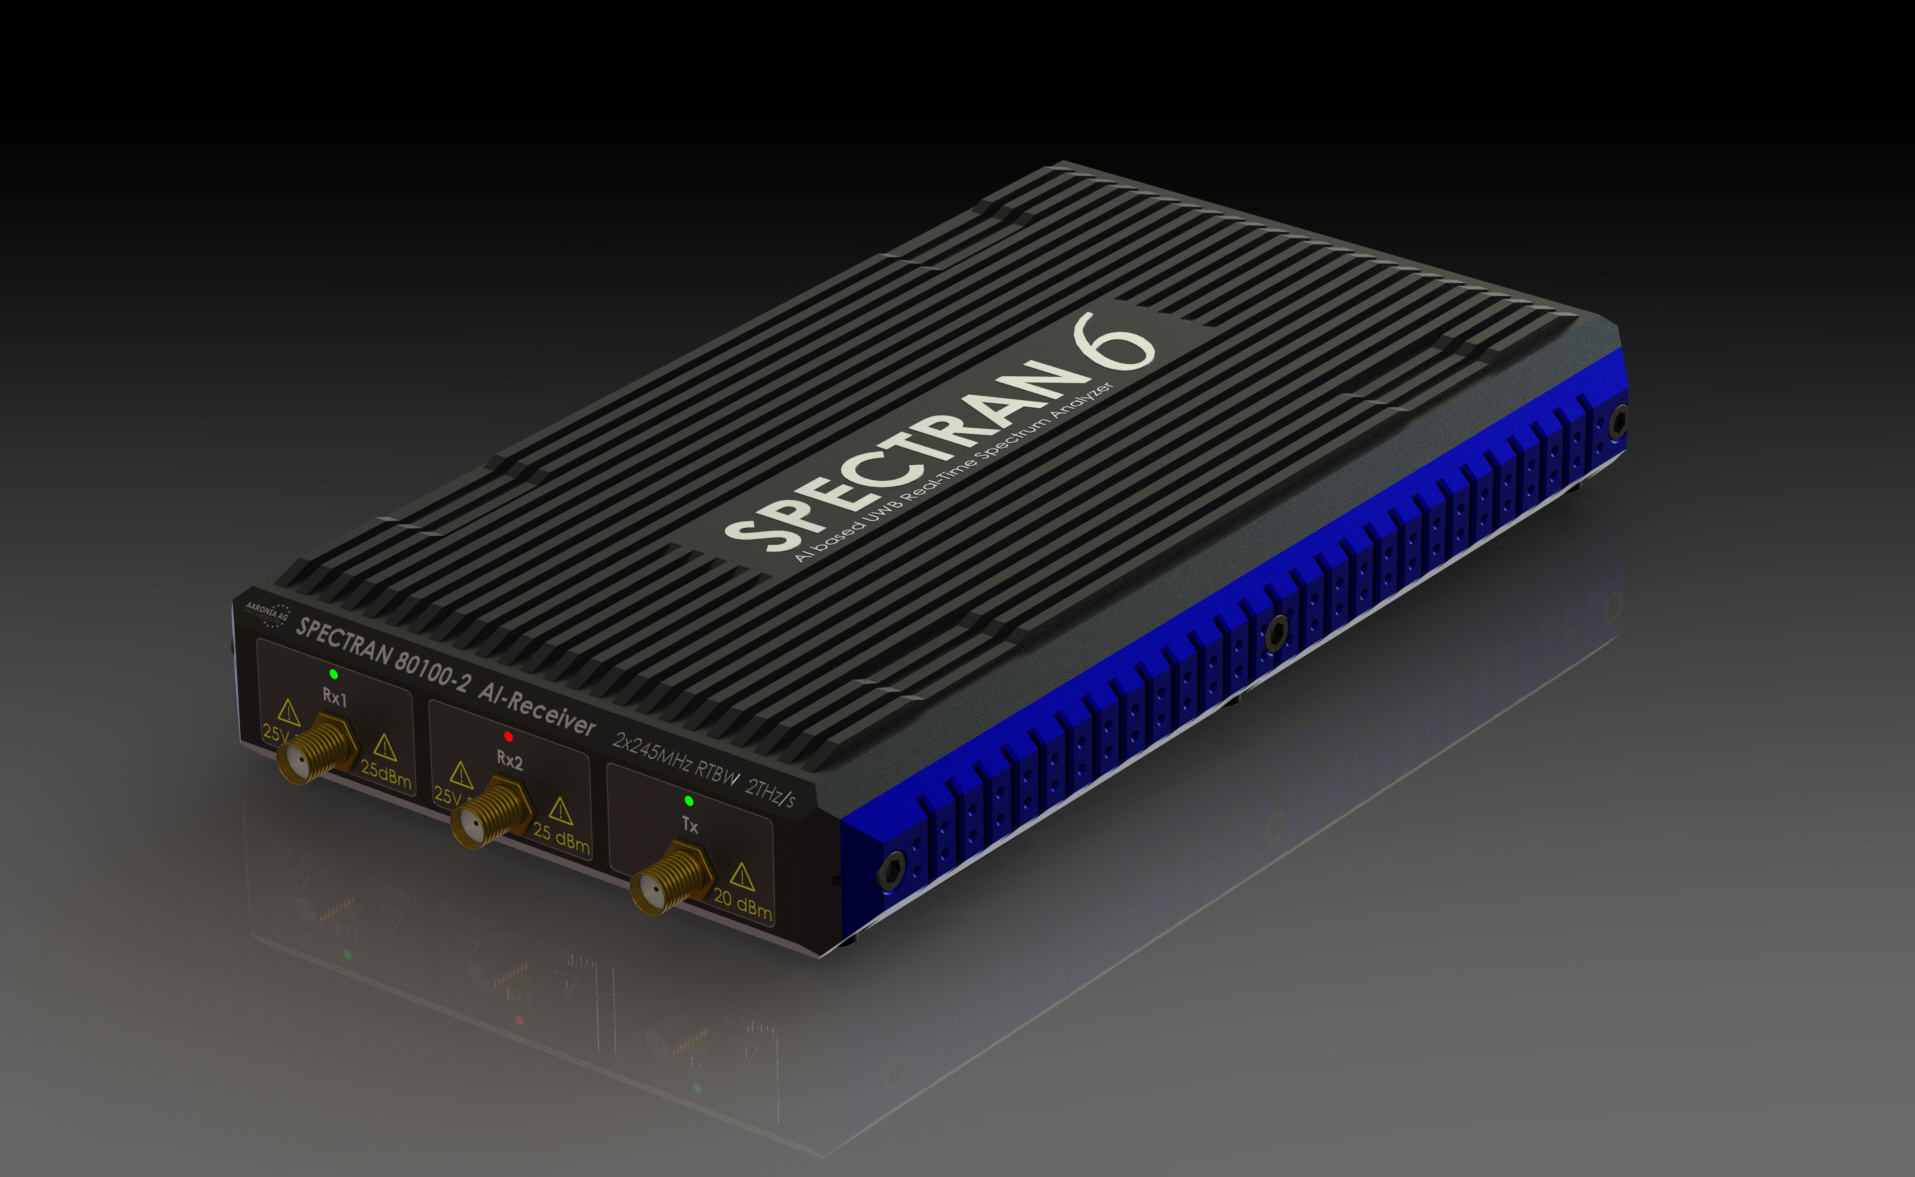
However, a Wi-Fi analyzer only understands Wi-Fi protocols (802.11). What if the interference is coming from a non-network device? A spectrum analyzer measures the magnitude of an input signal across a specific radio frequency range, regardless of what protocol is generating the signal. Spectrum analyzers are utilized to detect non-Wi-Fi radio frequency interference from devices like microwave ovens or cordless phones, both of which notoriously blast raw electromagnetic noise across the 2.4 GHz band.
Once the physical and wireless layers are verified, the investigation shifts to the logical layer. Network devices make forwarding decisions based on massive internal tables. We use Command Line Interface (CLI) commands to force these devices to reveal their logic.
Layer 2 Verification: MAC Addresses and Interfaces
Switches forward traffic based on physical hardware addresses. As frames enter a switch, the switch examines the source address and builds a directory. The show mac address-table command displays the media access control addresses dynamically learned by a network switch. By examining this table, you can trace exactly where a device is physically plugged in, because the show mac address-table command output explicitly maps specific media access control addresses to their corresponding physical switch ports.
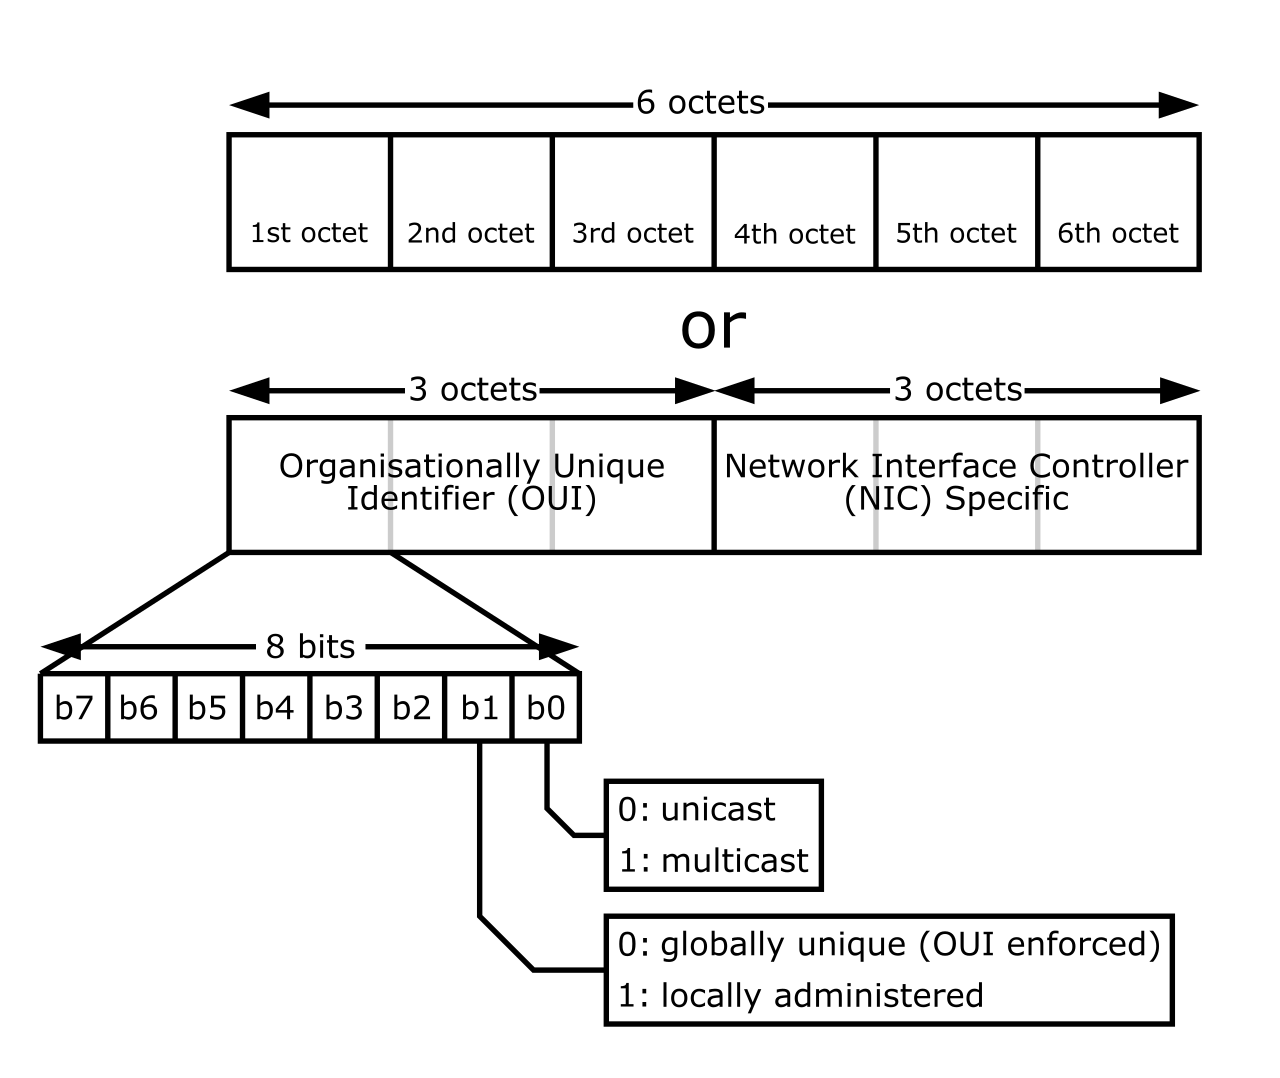
To view the hardware identity of the network gear itself, the singular show interface command displays the physical MAC address permanently assigned to a specific network port on a switch or router.
When diagnosing link health, the plural show interfaces command displays the operational line status of all network interfaces on a Cisco device. But it acts as more than just a status check; it is an X-ray of data link integrity. The show interfaces command provides layer 2 interface statistics including frame collisions, runts, giants, and Cyclic Redundancy Check (CRC) errors. An abundance of runts (frames smaller than 64 bytes) or CRC errors usually indicates physical interference or duplex mismatches destroying data in transit.
When checking an interface, you will see two status indicators: the "Line" (physical hardware) and the "Protocol" (the data link logic).
| Line Status | Protocol Status | Diagnostic Meaning |
|---|---|---|
| Down | Down | An interface status showing 'down' for the physical line and 'down' for the protocol definitively indicates a Layer 1 physical connectivity issue (e.g., unplugged cable, powered-off neighbor). |
| Up | Down | An interface status showing 'up' for the physical line and 'down' for the protocol typically indicates a Layer 2 data link issue such as a protocol mismatch (e.g., wrong encapsulation type or clock rate mismatch). The electricity is flowing, but the two ends cannot understand each other's language. |
Layer 3 Verification: Routing and Addressing
If Layer 2 is functional but packets cannot reach outside networks, the problem lies in routing. Routers are the post offices of a network; they look at destination IP addresses and check their signposts to decide where to send the packet next.
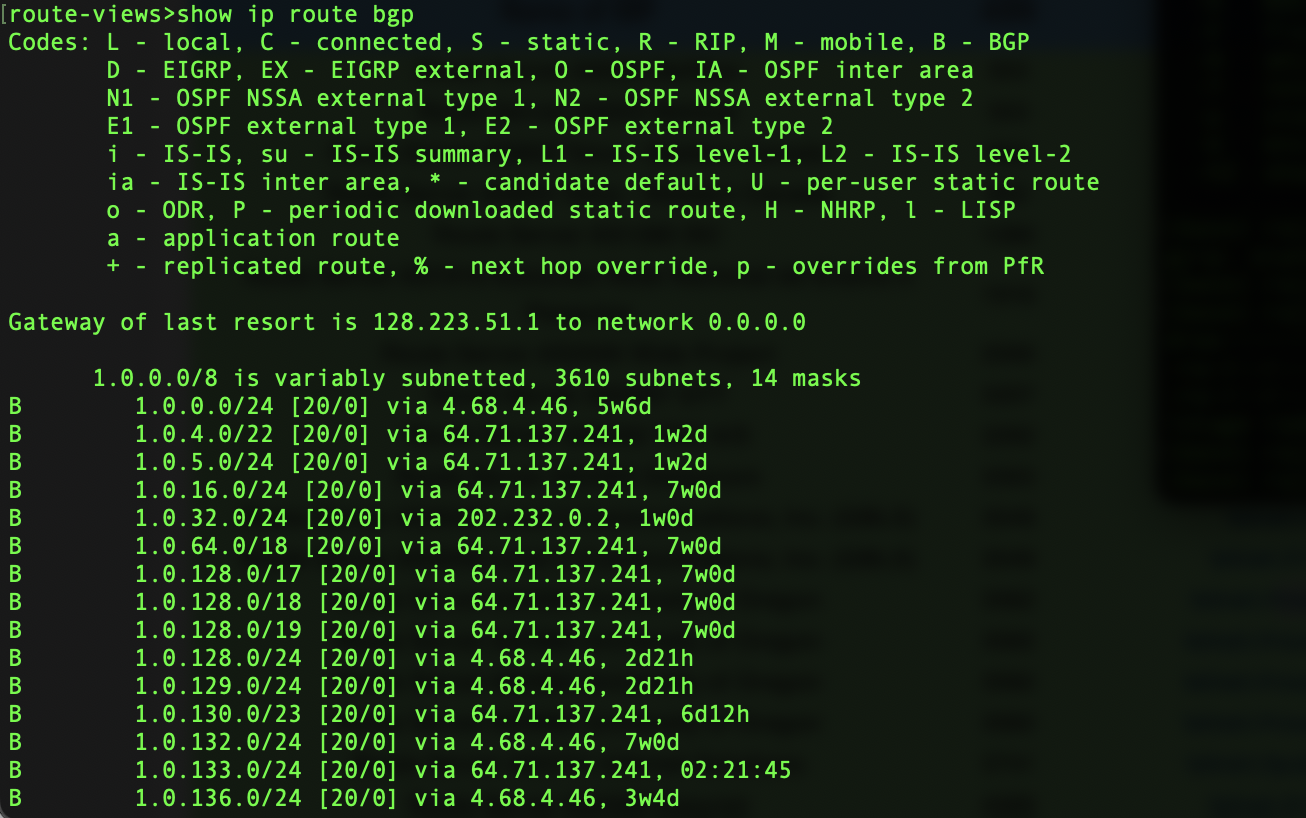
The show ip route command displays the active IPv4 routing table on a Cisco network device. This is arguably the most powerful command in a network engineer's arsenal, as the routing table output reveals the specific exit interface or next-hop IP address a router will use to forward packets to a given destination network. If the route isn't in this table, the router drops the packet.
End devices also have routing tables to determine how to reach their default gateways.
- The
route printcommand displays the local machine routing table on a Windows operating system. - The
ip routecommand displays the local machine routing table on a Linux operating system.
Bridging the Gap: The ARP Table
How does an IP packet actually get placed into a physical Ethernet frame? The sending device must discover the physical MAC address belonging to the destination IP. This translation is handled by ARP.
The Address Resolution Protocol cache stores temporary mappings between local IP addresses and physical MAC addresses. If a computer cannot communicate with the internet, network technicians verify ARP table entries to ensure a host has successfully resolved the MAC address of its designated default gateway. If the gateway's IP isn't mapped to a MAC in the ARP table, traffic can never leave the local subnet.
- The
arp -acommand displays the current Address Resolution Protocol cache entries on both Windows and Linux operating systems. - The
show arpcommand displays the current Address Resolution Protocol table on a Cisco IOS network device.
Memory and Configuration State
Finally, a device acts according to its configuration files. Cisco devices maintain two separate configuration files, which explains why networks often fail unexpectedly after a power outage.
The show running-config command displays the currently active configuration executing in the volatile memory (RAM) of a network device. Any commands typed into the CLI instantly take effect here. However, RAM is erased when power is lost.
The show startup-config command displays the saved configuration stored in the non-volatile memory (NVRAM) of a network device.
The Golden Rule of Network Administration: Configuration changes applied to a Cisco network device only survive a system reboot if the running configuration is copied to the startup configuration (using
copy running-config startup-config). If you forget this step, your hard work vanishes the moment the device restarts.