Software Tools for Networking Issues
Not sure you’re ready?
Take the ~3-minute readiness diagnostic and see where you stand.
A computer network is fundamentally an invisible apparatus—a vast, microscopic postal system processing billions of electrical and optical impulses every second. When a communication fails, a network administrator cannot simply unspool miles of fiber optic cable or pry open a switch chassis to see where a packet was lost. Instead, resolving network issues demands an arsenal of diagnostic software tools capable of making the invisible mechanics of routing, switching, and name resolution visible. These utilities serve as the diagnostic lenses through which we examine the health of our infrastructure. By mastering protocol analyzers to inspect individual frames, command-line probes to verify end-to-end connectivity, and neighbor discovery protocols to illuminate physical topologies, an administrator transforms from a passive observer into an active diagnostician capable of isolating and neutralizing any network anomaly.
Imagine standing on the bank of a rushing river, trying to understand the ecosystem by analyzing the exact composition of the water. You cannot grasp the whole picture by merely watching the surface; you must pull samples directly from the current. In networking, a protocol analyzer serves this exact function. It is a tool that captures network traffic for detailed packet-level inspection, allowing you to observe the precise bytes traversing your physical media.
To capture these samples, protocol analyzers operate by placing a network interface card (NIC) into promiscuous mode. By default, a NIC is polite—it only listens to traffic specifically addressed to its own MAC address and drops everything else. Promiscuous mode fundamentally alters this behavior. It allows a network interface to pass all received traffic to the CPU rather than dropping frames not addressed to that specific interface. This is what enables a protocol analyzer to capture all traffic on a local network segment.
Crucial Tooling: Wireshark is the industry standard graphical protocol analyzer. It is used to capture and analyze network packets in real-time, providing a highly readable, color-coded visual interface.
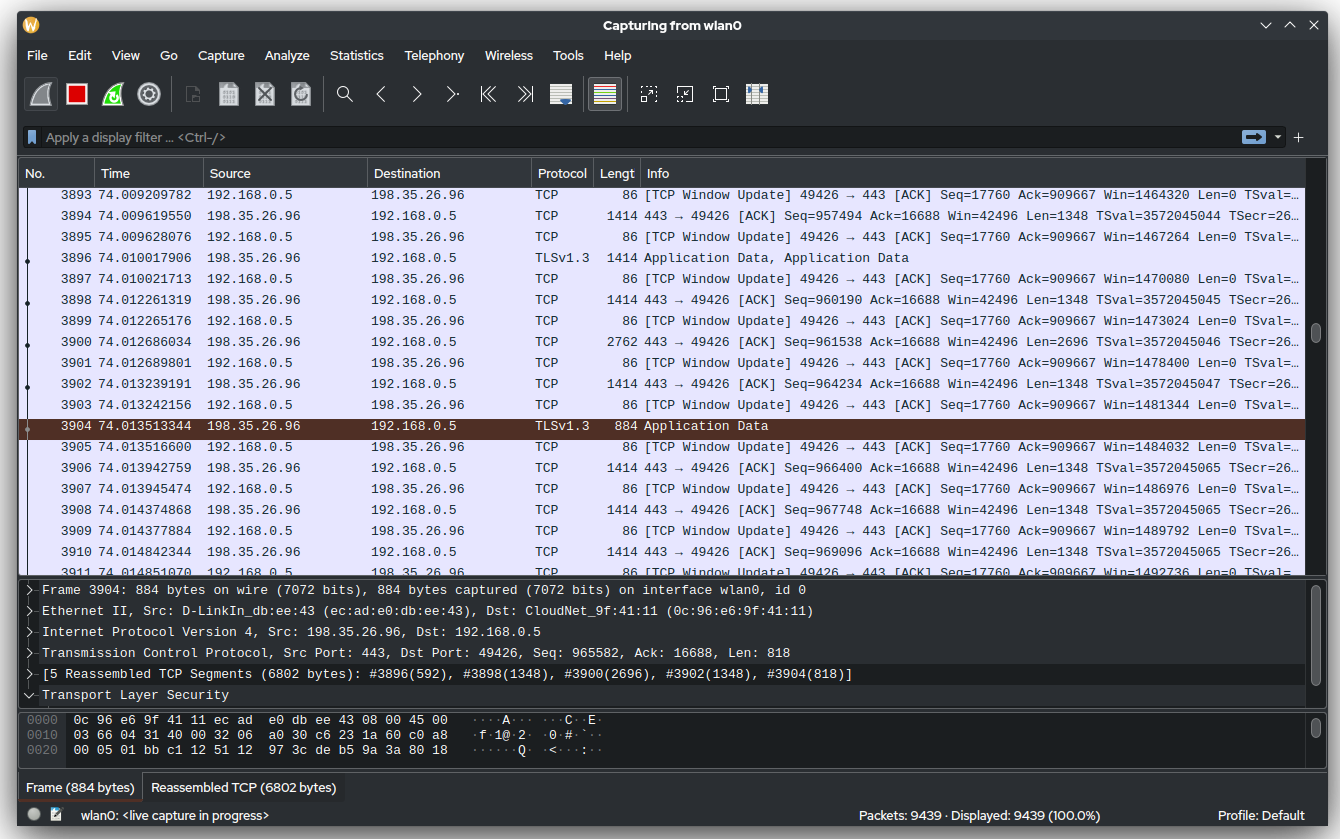
However, in many environments—particularly on headless servers or remote Linux appliances—a graphical interface is not an option. Here, we rely on the tcpdump utility. The tcpdump tool is a command-line packet analyzer used to capture and display packets transmitting over a network. Because placing a NIC into promiscuous mode and intercepting network traffic involves serious security implications, the tcpdump command requires elevated administrator or root privileges to capture packets on a network interface.
Whether you use Wireshark or tcpdump, a busy network segment can generate tens of thousands of packets per second. To avoid being overwhelmed by data, network engineers rely on capture filters. Capture filters reduce the volume of processed packets to isolate specific protocols, IP addresses, or ports before they are written to disk or displayed, ensuring you only collect the data relevant to the issue at hand.
Once you understand how to inspect individual packets, you need to understand the broader landscape of the network. If protocol analysis is a microscope, Nmap is the sonar.
Nmap is an incredibly powerful open-source software tool used for network discovery and security auditing. When you drop into a new, undocumented network environment, Nmap is the tool you use to illuminate the darkness. It discovers active hosts on a network by sending various probe packet types and analyzing the resulting responses.
Nmap doesn't just stop at telling you if a machine is online; it tells you exactly what that machine is doing. It identifies open ports on target hosts by performing techniques such as TCP SYN scans. By sending a synchronization (SYN) packet and monitoring whether the target replies with an acknowledgment (SYN-ACK), Nmap maps out every listening service on a device.
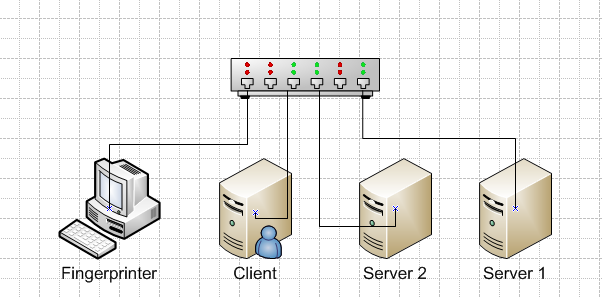
Furthermore, Nmap can determine the operating system of a remote host. It accomplishes this seemingly magical feat by analyzing the TCP/IP stack behavior and fingerprinting the responses. Because different operating systems (like Windows, Linux, or Cisco IOS) implement the TCP/IP protocols with slight, unique variations in their default settings (such as initial window sizes or flag ordering), Nmap analyzes these quirks to deduce the underlying OS with remarkable accuracy.
As an IT generalist or NOC analyst, your most frequent question is simple: "Can Device A talk to Device B?" The command-line utilities used to answer this question rely heavily on the Internet Control Message Protocol (ICMP).
The Ping Utility
The ping utility tests end-to-end network connectivity between two devices by sending Internet Control Message Protocol (ICMP) Echo Request messages. If the path is clear and the target host is responsive, a successful ping connectivity test receives ICMP Echo Reply messages from the target destination device.
Beyond basic connectivity, the ping utility is a highly effective diagnostic tool for latency. It measures the round-trip time and packet loss to help diagnose network latency issues. If your users are complaining about a "slow application," a simple ping test to the server can immediately tell you if packets are dropping or if the physical distance/routing complexity is introducing massive delays.
The syntax for ping varies slightly depending on your operating system:
- In a Windows environment, the ping command defaults to sending exactly four requests. To monitor a connection continuously, you must use the
-tswitch, which sends continuous ICMP Echo Requests to a target until manually stopped (using Ctrl+C). - In a Linux environment, the default behavior is continuous. To send a specific amount, you use the
-cswitch (count), which specifies the exact number of ICMP Echo Requests to send before stopping (e.g.,ping -c 5 10.0.0.1).
Tracing the Route
If a ping fails, you know the connection is broken, but you don't know where it broke. The network might span a dozen routers across the globe. To map this journey, we use traceroute.
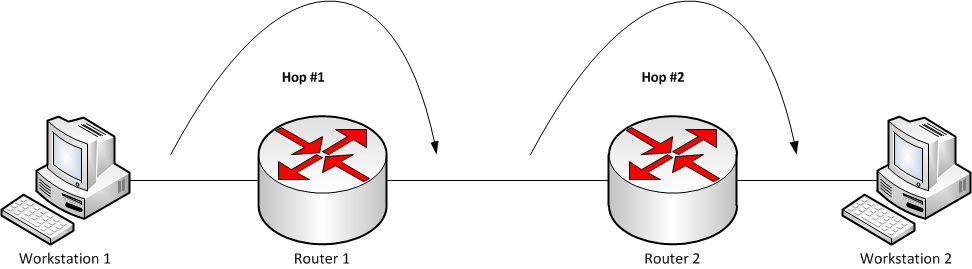
The traceroute utility maps the network path taken by packets from a source device to a destination device. It achieves this through a brilliant manipulation of the IP header. The traceroute utility identifies each router hop along a path by incrementally increasing the Time to Live (TTL) value in the packet headers.
Think of the TTL as a countdown timer designed to prevent packets from looping endlessly in a routing error. A router drops a received packet with a TTL of zero and sends an ICMP Time Exceeded message back to the original source.
Traceroute leverages this mechanic intentionally:
- It sends a packet with a TTL of 1. The first router receives it, decrements the TTL to 0, drops the packet, and replies with an ICMP Time Exceeded message. You have now identified Hop 1.
- It sends a packet with a TTL of 2. It passes the first router, hits the second router (TTL goes to 0), and the second router replies. You have identified Hop 2.
- This process continues until the packet reaches its destination.
Be aware of the platform differences when utilizing this tool:
- The Windows operating system version of the traceroute utility is named tracert.
- The Windows
tracertutility uses ICMP Echo Request packets by default. - The Linux
tracerouteutility uses UDP probes by default, which can sometimes yield different results if firewalls along the path treat ICMP and UDP traffic differently.
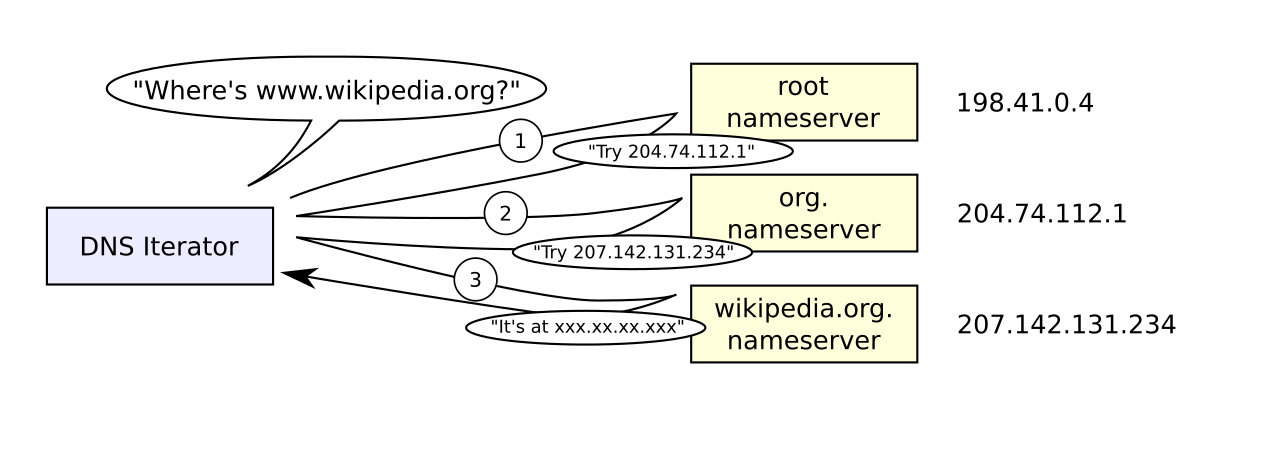
In the real world, users do not type IP addresses; they type hostnames. The Domain Name System (DNS) is responsible for this translation, and when it fails, the network appears "down" to the end-user.
The traditional tool for this is the nslookup utility, which queries Domain Name System (DNS) servers to resolve hostnames to IP addresses or vice versa. One of its powerful features is that the nslookup command can operate in an interactive mode. By simply typing nslookup and pressing Enter, you enter a shell where you can perform multiple sequential DNS queries without retyping the command name—ideal for testing multiple records against different servers.
However, as a professional, you will quickly graduate to the dig utility. The dig utility is a command-line tool used for querying DNS nameservers for detailed troubleshooting. Network administrators often prefer dig over nslookup because dig provides more detailed and structured DNS response outputs.
When you execute a dig query, it outputs DNS response sections matching the exact structure of the DNS protocol itself:
- The Question Section: What you asked the server.
- The Answer Section: The authoritative response (the IP address).
- The Authority Section: Which nameservers are authoritative for this domain.
- The Additional Section: Any extra helpful information, like the IP addresses of the authority nameservers.
Often, the problem isn't out on the wire; it is happening right inside the local machine's networking stack.
Netstat
The netstat utility displays active TCP connections, listening ports, and general network statistics on a local operating system. It is the ultimate tool for verifying if a server is actually listening for connections or if malware is phoning home.
| Command Switch | Functionality |
|---|---|
netstat -a | Displays all active TCP connections and all listening TCP and UDP ports on a device. |
netstat -n | Displays active connections with IP addresses and port numbers in numerical format instead of attempting to resolve hostnames (which speeds up the output significantly). |
netstat -b | An incredibly useful switch in Windows that requires administrative privileges. It displays the executable program involved in creating each network connection or listening port, immediately tying network traffic to a specific software application. |
ARP (Address Resolution Protocol)
While IP addresses handle end-to-end logical routing across the internet, local delivery requires MAC addresses. The translation between these two planes of existence is handled by ARP.
An ARP cache stores temporary mappings between IPv4 addresses and corresponding Layer 2 MAC addresses to facilitate local network communication. The arp utility displays and modifies the Address Resolution Protocol (ARP) cache on a local host.
- To view the current mappings, the
arp -acommand displays all current ARP cache entries on both Windows and Linux operating systems. - If a device on your network is replaced, the old IP-to-MAC mapping may remain cached, causing traffic blackholes. You can clear this using the
arp -dcommand, which deletes an entry from the local ARP cache.
Why do we do this? Clearing the ARP cache forces a device to send new ARP broadcast requests to resolve stale or incorrect IP-to-MAC mappings, ensuring your traffic reaches the correct physical hardware.
Finally, let us consider the challenge of the physical topology. You are hired to manage a server room you have never seen before. A tangle of hundreds of cables—a "spaghetti monster"—obscures where any switch connects to any router. You cannot unplug cables to trace them without causing outages.
You solve this using Neighbor discovery protocols. These protocols allow network devices to broadcast their identity, capabilities, and configuration to directly connected peers. Consequently, network administrators use neighbor discovery protocol outputs to map physical network topologies without tracing physical cables.
The Boundary Rule: Neighbor discovery protocol frames are intentionally terminated by the immediate adjacent neighbor and are never forwarded to other network segments. If Switch A connects to Switch B, and Switch B connects to Router C, Switch A will only see Switch B in its neighbor discovery output. This limitation is exactly what allows you to draw an accurate, hop-by-hop map of the physical links.
When you query this protocol on a switch, the command outputs typically include incredibly valuable data: the neighbor device hostname, the local interface (which port on your switch is being used), the remote interface (which port on the neighbor's switch is being used), and the device platform details (e.g., whether it is a Catalyst 9300 or an IP phone).
There are two primary flavors of this protocol you must memorize:
- CDP (Cisco Discovery Protocol): CDP is a proprietary Layer 2 protocol used to share hardware and software information between directly connected Cisco equipment. If you are in a pure Cisco environment, CDP is enabled by default and provides deeply integrated information.
- LLDP (Link Layer Discovery Protocol): Because modern networks rely on equipment from diverse manufacturers, we need a universal standard. LLDP is an IEEE vendor-neutral Layer 2 protocol used for network device discovery. Its official IEEE standard designation is 802.1AB.
Within the LLDP standard, there is a specialized extension called LLDP-MED (Media Endpoint Discovery). LLDP-MED is an extension of the Link Layer Discovery Protocol designed specifically for media endpoint devices like Voice over IP (VoIP) phones. It allows network switches to automatically assign VLAN configurations and Quality of Service (QoS) policies the moment a VoIP phone is plugged into the wall, streamlining network administration and ensuring flawless voice quality.