Imagine being tasked with outfitting a massive new corporate headquarters. If you know exactly how many desks, chairs, and server racks are required before signing the lease, you can order everything on day one, schedule delivery, and measure your success by how closely the final installation matches the original blueprint. In this scenario, predictive project scope is defined comprehensively during the initial project planning phase. Because the end state is fully understood, predictive project frameworks treat scope as a strictly fixed project constraint.
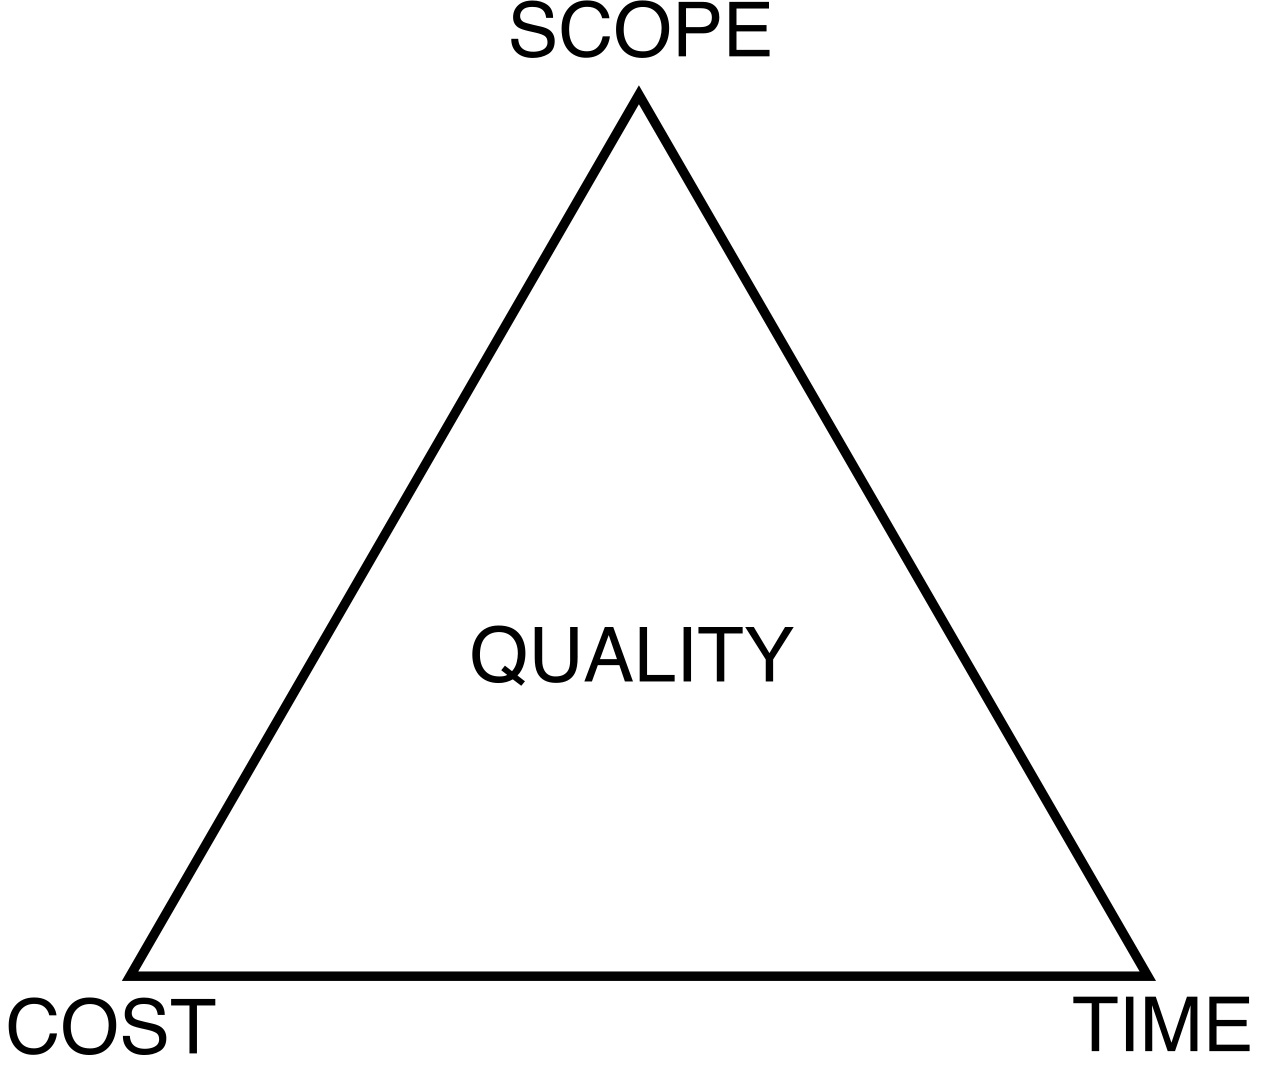
The project management triangle illustrates the predictive approach to project constraints, where scope is treated as a strictly fixed baseline alongside time and cost.
Now, imagine a profoundly different scenario: designing a proprietary AI-drivencustomer service platform for that same company. The end-users do not fully know what they need until they click through the first prototype. If you attempt to blueprint every button and database query on day one, you will spend millions building a perfectly functional system that no one actually wants to use. To survive in this environment, adaptive project frameworks treat scope as a flexible project constraint. We abandon the illusion of perfect foresight; instead, adaptive project scope is defined progressively throughout the project lifecycle. Because the terrain is constantly shifting, adaptive projects prioritize responding to change over following a predetermined project plan.
If we do not possess a massive, encyclopedic requirements document on day one, where does adaptive scope come from? It emerges through a deliberate, hierarchical flow of information, moving from the highly abstract to the highly concrete.
The origin point is the product vision, which serves as the primary high-level input for defining adaptive project scope. Think of the product vision as a compass heading—it tells the team why they are building the product and what ultimate value it will deliver to the customer.
From that vision, we draw a map. A product roadmap provides a visual timeline of high-level adaptive scope deliverables. It does not list granular tasks; rather, it blocks out major capabilities over upcoming quarters or releases.
All of these desired capabilities eventually funnel into a single, master ledger. The product backlog acts as the single source of truth for all adaptive project scope requirements. If an idea, feature, or bug fix is not in the product backlog, it does not exist to the project team.
In a traditional office setting, project scope often suffers from the "too many cooks" dilemma—five different department heads shouting for their features to be built first. Agile frameworks solve this mathematically by consolidating authority: the Product Owner holds sole accountability for prioritizing the product backlog scope. They alone order the list to maximize business value.
Breaking the Boulders: Epics and User Stories
Items sitting at the bottom of the product backlog are often massive and vaguely defined. We call these epics. An epic represents a large, unrefined body of project scope (e.g., "Overhaul the entire checkout payment gateway"). You cannot hand an epic directly to a development team and expect them to finish it in a two-week sprint.
To execute the work, agile teams must break epics down into smaller user stories prior to iteration execution. By the time work reaches the top of the backlog, it has been fractured into highly specific, manageable pieces. User stories represent the smallest executable units of scope in adaptive frameworks, written from the perspective of the end-user to ensure every ounce of effort delivers tangible value.
With the backlog refined, the team can plan for the future. Agile release planning uses the product backlog to determine the scope of future product deployments, grouping sets of user stories into logical release cycles that stakeholders can anticipate.
When an iteration (or sprint) begins, the team looks at the top of the prioritized product backlog and pulls in what they mathematically believe they can complete. The sprint backlog contains the specific scope elements committed by the development team for the current iteration. Once the sprint backlog is locked, the iteration begins.
To ensure the team stays synchronized during this sprint, they meet every 24 hours. Daily standup meetings function as frequent tracking events to assess team progress toward the sprint goal. This is not a status report to management; it is a tactical huddle for the team to inspect their alignment and adapt their daily plan.
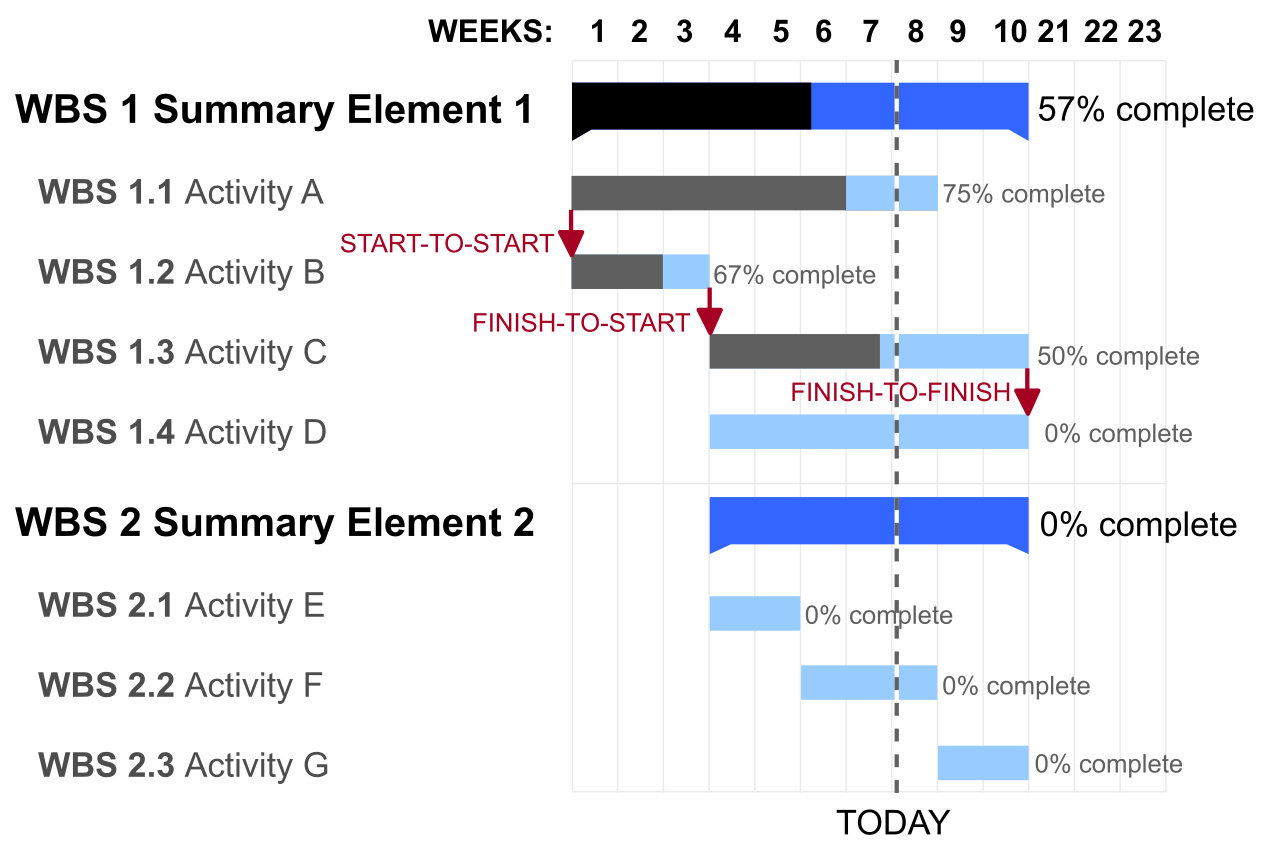
Why No Gantt Charts?Predictive tracking heavily utilizes Gantt charts to map task dependencies. In traditional projects, tasks are like dominoes; if task A is delayed, tasks B, C, and D are inherently late. Agile intentionally breaks this paradigm. Adaptive tracking avoids complex dependency mapping in favor of prioritizing independent user stories. By ensuring user stories can be developed and tested in isolation, agile teams prevent cascading delays and eliminate the need for intricate Gantt charts.
Unlike adaptive frameworks, predictive tracking relies heavily on Gantt charts to map complex, cascading task dependencies across a strict project timeline.
To pass the CAPM exam, you must clearly distinguish how predictive and adaptive frameworks measure success.
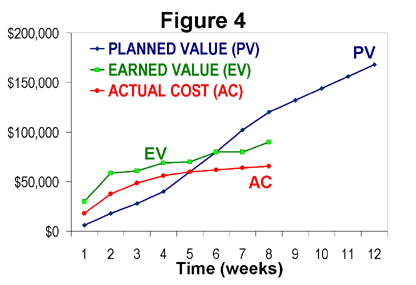
In predictive environments, you declare your destination upfront and draw a straight line to it. Therefore, predictive project tracking measures project performance against a formal approved baseline (the approved scope, schedule, and cost). If a stakeholder wants to add a new feature halfway through the project, predictive tracking requires formal change control processes to alter the approved project scope. It is a rigid, bureaucratic defense mechanism. To see if the project is healthy, predictive tracking relies on Earned Value Management (EVM) to mathematically measure overall project performance, combining cost and schedule variances into objective formulas.
In predictive projects, Earned Value Management (EVM) graphs are used to mathematically plot actual costs and earned value against a strictly defined initial performance baseline.
Adaptive projects abandon EVM and baselines entirely. Why? Because measuring progress against a baseline assumes the initial plan was perfect. In adaptive work, the plan is expected to be flawed. Instead, adaptive project tracking measures progress primarily through the frequent delivery of working product increments. The ultimate measure of success is not a green traffic light on a spreadsheet, but a piece of software or a business capability that a user can actually touch and interact with.
Because we deliver these working increments in short cycles, adaptive tracking enables project teams to incorporate changes based on continuous stakeholder feedback. The project adapts to reality, rather than forcing reality to adapt to a project plan.
Visualizing Progress and Bottlenecks
Data hidden in a spreadsheet changes no one's behavior. Adaptive teams use highly visible charts—often called "information radiators"—to make project data impossible to ignore.
To track time and remaining work, agile teams rely on two specific charts, and it is vital you do not confuse them:
A sprint burndown chart visualizes the exact amount of work remaining in a current iteration. It is a downward-sloping line. If the team committed to 40 hours of work, the line starts at 40 and must "burn down" to zero by the end of the two-week sprint.
A release burnup chart visualizes completed work plotted against the total project scope. Because adaptive scope is flexible, the total scope line might move up as new requirements are discovered. The completed work line rises to eventually intersect with the total scope line, showing progress across an entire product release.
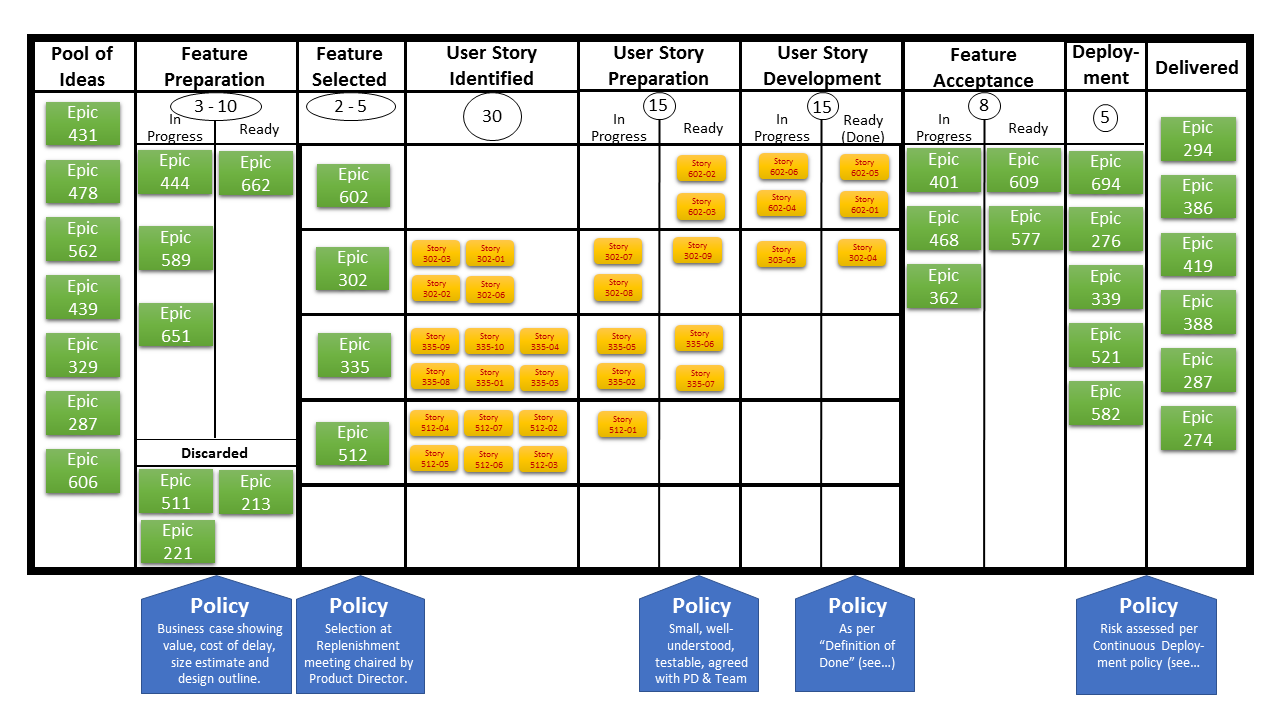
To track the actual flow of work, teams move away from lines and turn to boards. Kanban boards visually track adaptive project workflows, creating a transparent view of the factory floor. Mechanically, Kanban boards represent individual work items as cards moving through defined workflow columns (e.g., To Do, In Development, Testing, Done).
A Kanban board visualizes adaptive project workflows by tracking the movement of individual work items as cards across defined column states.
But how do you mathematically prove that your Kanban board is flowing efficiently? You use a specialized graph. Cumulative flow diagrams (CFDs) track the total number of work items in various workflow states over time. Imagine looking at the side of a canyon, viewing the different colored layers of sedimentary rock. A CFD stacks colored bands representing your Kanban columns over time.
Just as sedimentary rock layers form distinct, stacked geological bands in a canyon wall, a Cumulative Flow Diagram stacks colored workflow states over time to expose process behavior.
Source: SEUtahStrat by Matt Affolter (QFL247) ( talk ) (Transferred by Citypeek /Original uploaded by Matt Affolter (QFL247) ), CC BY-SA 3.0.
The Feynman-style insight: If the band for "Testing" suddenly bulges and gets incredibly wide while the band for "Done" stays flat, it means work is pooling in the testing phase like water behind a blocked dam. By spotting these expanding visual bands, agile teams use cumulative flow diagrams to identify workflow bottlenecks before they derail the project.
If we do not use the complex Earned Value Management formulas (like Estimate at Completion) to predict our future in adaptive projects, how do we know when we will finish the product backlog?
We use historical observation.
Instead of theoretical math, we look at the team's actual track record. Velocity is the historical average of story points completed by an agile team per iteration. If a team completed 30 story points in Sprint 1, 34 points in Sprint 2, and 26 points in Sprint 3, their velocity is 30 points per sprint.
Armed with this highly reliable historical data, adaptive tracking utilizes team velocity to forecast future iteration capacity. If the product release requires 150 points of work, and the team’s velocity is 30 points per sprint, the project manager can confidently forecast that the release will require exactly five sprints. It is empirical, it is rooted in reality, and it allows the project to maintain a sustainable, highly predictable pace amidst a sea of changing requirements.