Predictive Project Controls
Not sure you’re ready?
Take the ~3-minute readiness diagnostic and see where you stand.
A blueprint of a skyscraper is a masterpiece of intention, but it cannot tell you if the steel shipments are late, or if the concrete pour is over budget. In the physical world, intention strictly diverges from reality. As a project professional, your job is not merely to draft the plans, but to pilot the project through the messy, unpredictable friction of actual work. To do this, you must measure the exact distance between what you planned to happen and what is actually happening at any given moment. This act of measurement and correction is the essence of predictive project controls.
In a predictive (or waterfall) environment, we map out the scope, time, and cost of a project before execution begins. But how do we enforce that map? We use highly structured artifacts to baseline our intentions, tracking mechanisms to monitor friction, and a mathematical framework called Earned Value Management to diagnose the health of the project in real-time.
Let us dissect the anatomy of predictive project controls, starting with the physical documents we use to govern the work, and ending with the mathematics of variance.
Before you can control a project, you must have a physical or digital manifestation of your plans. In this methodology, a predictive project artifact is any document, template, or output created to manage a plan-driven project. Think of these artifacts as the governing laws and ledgers of your project's universe.
The genesis of any formal initiative is the Project Charter. This is a predictive artifact that formally authorizes the existence of a project. It gives the project manager the executive authority to apply organizational resources to project activities. Without a charter, you do not have a project; you merely have a well-intentioned hobby.
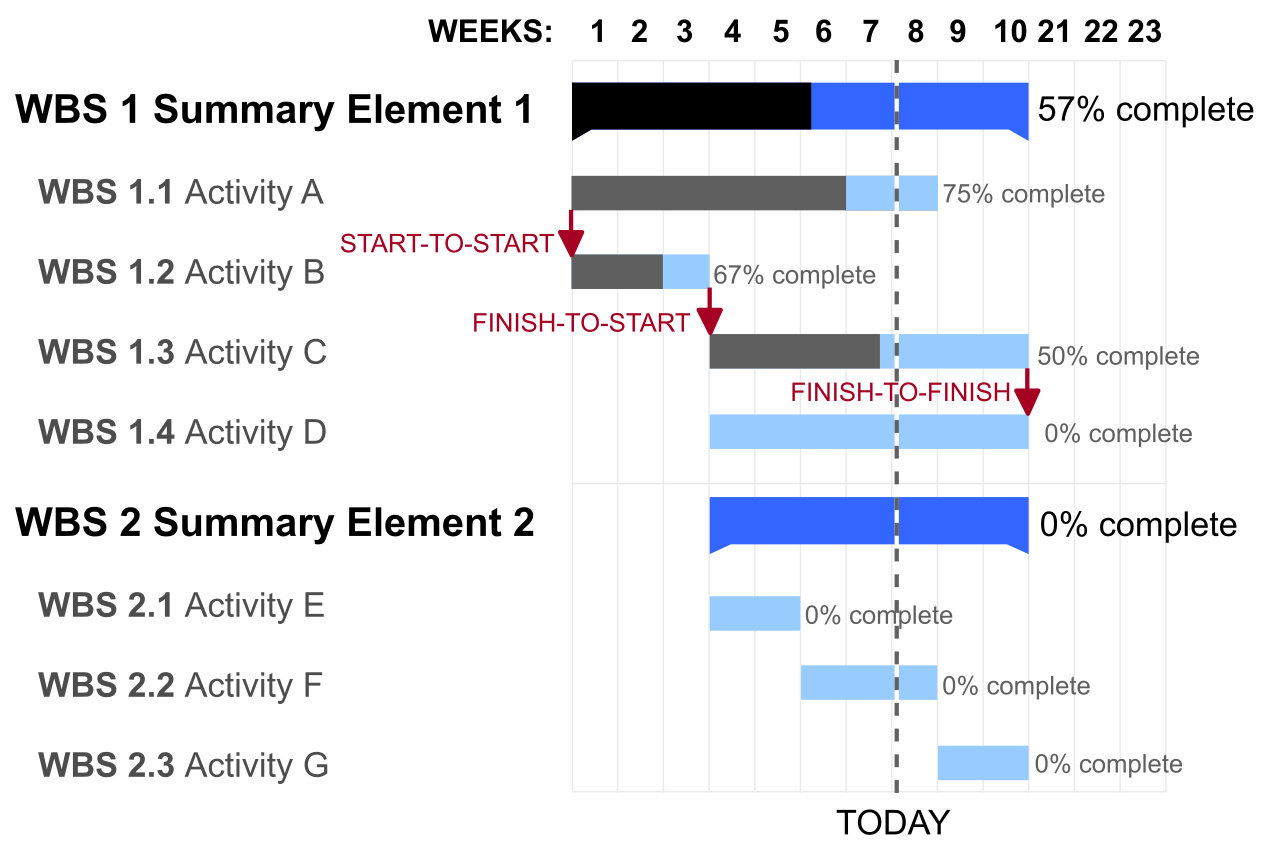
Once authorized, the project team develops the Project Management Plan. This is not a simple schedule or a Gantt chart. The Project Management Plan is a comprehensive predictive artifact that defines exactly how the project is executed, monitored, and controlled. It contains the sub-plans for how you will handle everything from resources and communications to risks and procurement.
The Triad of Baselines
Embedded within the Project Management Plan are your three fundamental metrics of success, known as the baselines. A baseline is a frozen, approved version of a plan. Once established, it is the fixed target against which all future performance is judged.
- The Scope Baseline: What exactly are we building? The Scope Baseline is a predictive artifact comprising three crucial components: the approved project scope statement, the Work Breakdown Structure, and the Work Breakdown Structure dictionary.
-
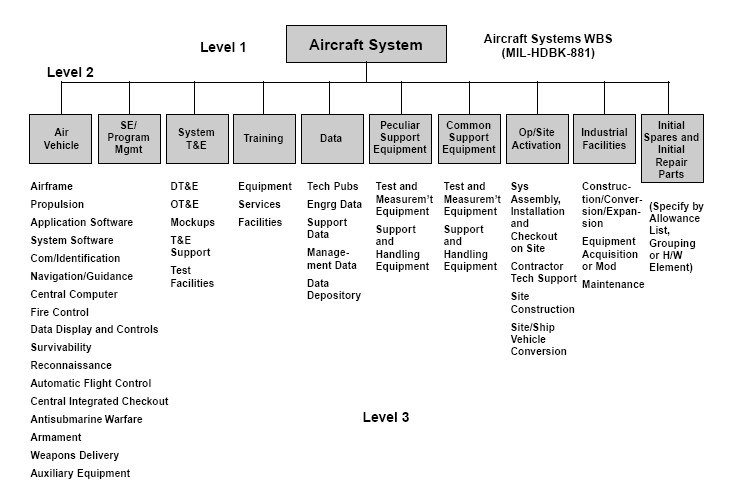
The Work Breakdown Structure (WBS) is a hierarchical decomposition of the total scope of work to be carried out by the project team. It breaks massive deliverables down into manageable work packages.
-
Because a box on a chart does not hold enough instruction for a team to execute, it is accompanied by the Work Breakdown Structure dictionary, a predictive artifact providing detailed deliverable, activity, and scheduling information about each component in the Work Breakdown Structure.
-
- The Cost Baseline: How much are we authorized to spend to achieve that scope? The Cost Baseline is the approved version of the time-phased project budget. It represents the funds you are expected to spend over the timeline of the project. A critical rule for the exam and for the real world: The Cost Baseline excludes project management reserves. Management reserves are withheld by executive leadership for unforeseen, "unknown-unknown" risks. They are not part of the project manager's standard operating budget.
- The Schedule Baseline: When will this work be done? The Schedule Baseline is the approved version of a schedule model used as a basis for comparison to actual results. Because time is rigid, the Schedule Baseline can only be changed through formal change control procedures. You cannot simply slide a deadline backward in your software because a vendor was late; you must formally request a change to the baseline.
If the baselines are your planned destination, your registers and logs are the dashboard instruments telling you what is happening on the road. As a project coordinator or manager, you will live inside these documents daily.
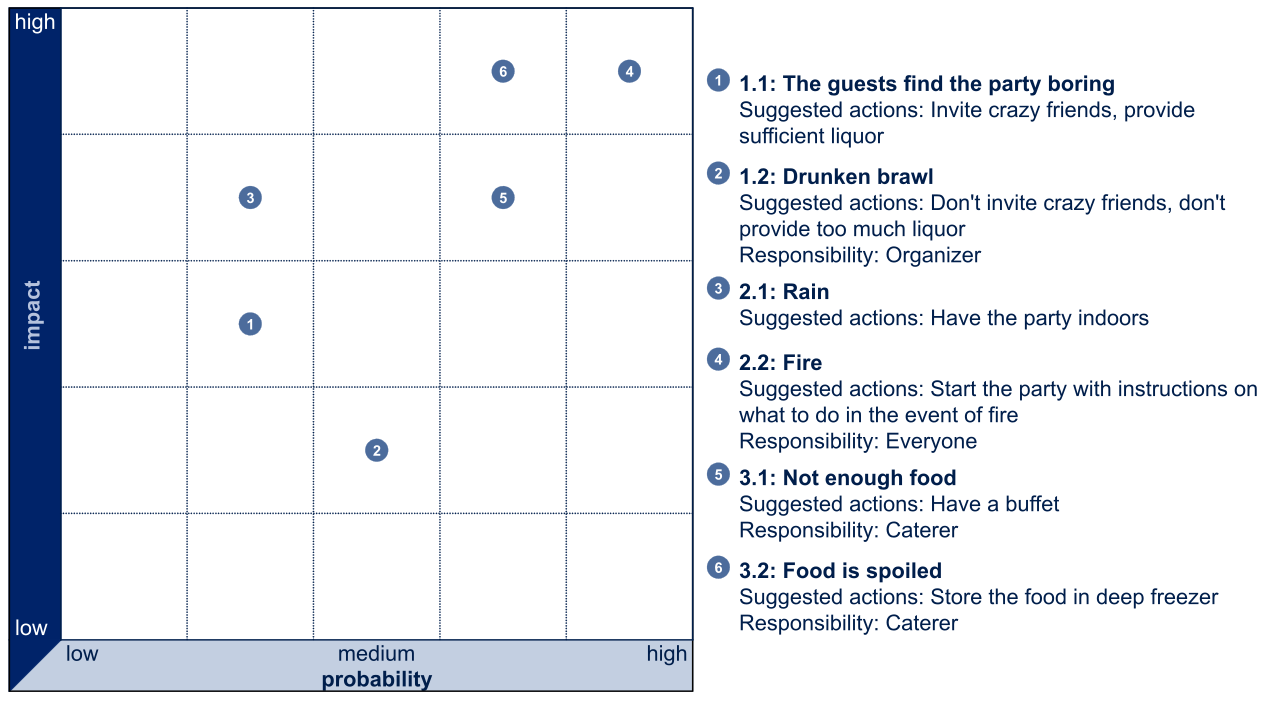
- The Risk Register: A predictive artifact containing the details of identified individual project risks. It outlines what might go wrong (or right), the probability of it happening, the potential impact, and the planned response.
- The Issue Log: While a risk is something that might happen, an issue is a risk that has happened. The Issue Log is a predictive project document used to record and monitor items under discussion or in dispute. If a vendor's truck breaks down and delays delivery, it moves from a theoretical risk to a concrete entry in the Issue Log.
- The Change Log: Remember that baselines can only be changed formally? The Change Log is a predictive artifact used to document all formal changes submitted during a project, tracking whether they were approved, deferred, or rejected.
- The Requirements Traceability Matrix: How do you prove that the final product actually does what the client asked for six months ago? The Requirements Traceability Matrix is a predictive grid linking product requirements from their origin to the deliverables that satisfy them. It ensures no requirement is accidentally dropped during development.
- The Lessons Learned Register: Project management is highly iterative across a career. The Lessons Learned Register is a predictive artifact used to record knowledge gained during a project to improve future performance. It ensures the organization does not pay the tuition for the same mistake twice.
With our artifacts and baselines established, we enter the active phase of project controls. Project controls encompass the data gathering, management, and analytical processes used to predict, understand, and influence the time and cost outcomes of a project.
The core analytical engine of project controls is variance analysis, which is the technique used to determine the cause and degree of difference between the baseline (your plan) and actual project performance (reality).
To perform variance analysis systematically, the industry standard relies on Earned Value Management (EVM). EVM is a methodology that combines scope, schedule, and resource measurements to assess project performance.
Many aspiring project professionals find EVM intimidating because it introduces a new alphabet soup of acronyms. But if we ground it in reality, the logic is brilliantly simple. EVM asks three foundational questions at any given moment in a project:
- How much work did we plan to do by today?
- How much work did we actually accomplish by today?
- How much did we actually spend to accomplish that work?
These three questions correspond to the three foundational pillars of EVM. Let us look at them through an analogy. Imagine you are hired to paint 10 identical rooms. You plan to paint 1 room per day. Each room is budgeted to cost $100 in paint and labor. Therefore, the total project will take 10 days and cost $1,000.
Now, imagine it is the end of Day 4.
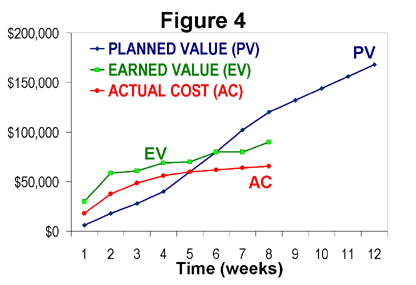
1. Planned Value (PV)
Planned Value is the authorized budget assigned to the scheduled work to be accomplished for a given activity.
- Intuition: By Day 4, according to our baseline, we should have painted 4 rooms. At $100 a room, our Planned Value is $400. We planned to have $400 worth of value created by today.
2. Earned Value (EV)
Earned Value is the measure of work performed expressed in terms of the budget authorized for that specific work.
- Intuition: You walk the job site on Day 4. You find that your team has only finished 3 rooms. You don't measure their progress in hours spent sweating; you measure it in the budgeted value of the work they completed. 3 rooms at the budgeted $100 each means your Earned Value is $300. You have physically "earned" $300 worth of your total baseline.
3. Actual Cost (AC)
Actual Cost is the total realized cost incurred in accomplishing work on an activity during a specific time period.
- Intuition: You look at your receipts and payroll. To paint those 3 rooms, you had to buy extra primer and pay your crew overtime. It actually cost you $450. Your Actual Cost is $450.
The Day 4 Reality Check:
- PV: $400 (We should have 4 rooms done)
- EV: $300 (We actually got 3 rooms done)
- AC: $450 (We spent $450 doing it)
Without doing a single complex calculation, your intuition is already screaming at you: We are behind schedule (only 3 rooms instead of 4) and we are over budget (we spent $450 to get $300 worth of work).
EVM simply formalizes this intuition into strict mathematical formulas.
There are two ways to express the gap between expectation and reality: as an absolute number (Variance) or as a ratio of efficiency (Index).
Analyzing Cost
Cost Variance (CV) calculates the amount of budget deficit or surplus at a given point in time during a project. To find it, you simply subtract what you spent from the value of the work you completed.
Cost Variance Formula: Cost Variance = Earned Value - Actual Cost (CV = EV - AC)
Let us apply this to our painting project: CV = \$300 (EV) - \$450 (AC) = -\$150.
Because you are subtracting your actual expenditure from the value of the work, the resulting number tells you exactly how much money you are bleeding (or saving).
| Cost Variance Result | Meaning | Real-World Translation |
|---|---|---|
| Positive (+) | A positive Cost Variance indicates the project is operating under budget. | You spent less than you planned for the work done. You are saving money! |
| Zero (0) | A Cost Variance of zero indicates the project is exactly on budget. | You spent precisely what the baseline dictated for the work done. |
| Negative (-) | A negative Cost Variance indicates the project is operating over budget. | You spent more than you planned for the work done. You are bleeding money. |
Variance tells you the exact dollar amount you are off, but it doesn't scale well when communicating to executives. Being down $150 is a disaster on a $1,000 project, but a rounding error on a $100 million project. To express the efficiency of your spending, we use the Cost Performance Index (CPI).
Cost Performance Index is a measure of the cost efficiency of budgeted resources expressed as the ratio of earned value to actual cost. Instead of subtracting, we divide.
Cost Performance Index Formula: Cost Performance Index = Earned Value / Actual Cost (CPI = EV / AC)
In our project: CPI = \$300 (EV) / \$450 (AC) = 0.66.
Think of an index as "cents on the dollar." A CPI of 0.66 means that for every $1.00 you spend, you are only getting $0.66 worth of actual project value.
| Cost Performance Index | Meaning |
|---|---|
| Greater than 1.0 | Indicates a cost underrun for project performance to date. Highly efficient. |
| Exactly 1.0 | You are earning exactly $1 of value for every $1 spent. |
| Less than 1.0 | Indicates a cost overrun for project work completed. Highly inefficient. |
Analyzing Schedule
Similarly, we can translate our schedule into mathematical terms using the exact same logic. However, instead of comparing Earned Value to Actual Costs, we compare Earned Value to what we planned to have done by now (Planned Value).
Schedule Variance (SV) measures schedule performance expressed as the difference between the earned value and the planned value.
Schedule Variance Formula: Schedule Variance = Earned Value - Planned Value (SV = EV - PV)
In our painting project: SV = \$300 (EV) - \$400 (PV) = -\$100.
Wait—why is schedule variance expressed in dollars? In EVM, we translate time into the budgeted cost of the work scheduled. Being down $100 in Schedule Variance means you are one room behind schedule.
| Schedule Variance Result | Meaning |
|---|---|
| Positive (+) | A positive Schedule Variance indicates the project is progressing ahead of schedule. |
| Zero (0) | A Schedule Variance of zero indicates the project is progressing exactly on schedule. |
| Negative (-) | A negative Schedule Variance indicates the project is progressing behind schedule. |
To find our schedule efficiency, we use the Schedule Performance Index (SPI), which is a measure of schedule efficiency expressed as the ratio of earned value to planned value.
Schedule Performance Index Formula: Schedule Performance Index = Earned Value / Planned Value (SPI = EV / PV)
In our project: SPI = \$300 (EV) / \$400 (PV) = 0.75.
An SPI of 0.75 means you are progressing at only 75% of the speed you originally planned.
| Schedule Performance Index | Meaning |
|---|---|
| Greater than 1.0 | Indicates more work was completed than was originally planned. |
| Exactly 1.0 | You are progressing at exactly the planned rate. |
| Less than 1.0 | Indicates less work was completed than was originally planned. |
Professor's Tip for the Exam: If a variance is negative, it's bad. If an index is under 1.0, it's bad. Earned Value (EV) always comes FIRST in every formula.
- CV = EV - AC
- SV = EV - PV
- CPI = EV / AC
- SPI = EV / PV
Knowing your project is bleeding money and falling behind schedule is utterly useless if you do nothing to correct it. Measurement without action is just observation. That is why the Project Management Body of Knowledge formally dictates ongoing control processes.
Control Schedule is the predictive project management process of monitoring the status of the project to update the project schedule and managing changes to the schedule baseline. If your SPI drops to 0.75, you engage in the Control Schedule process to figure out how to compress the timeline—perhaps by crashing the schedule (adding resources) or fast-tracking (doing sequential activities in parallel).
Simultaneously, Control Costs is the predictive project management process of monitoring the status of the project to update the project costs and managing changes to the cost baseline. If your CPI is a dismal 0.66, the Control Costs process requires you to review procurement contracts, reduce scope (via formal change control), or find cheaper materials to stop the financial bleeding.
Summary
Predictive project controls transform project management from an exercise in hope into a discipline of mathematics and rigor. By documenting intention through artifacts and baselines (Scope, Cost, Schedule), tracking friction through registers and logs, and calculating reality using EVM formulas (CV, SV, CPI, SPI), you gain the ultimate superpower as a project coordinator: the ability to see the exact future outcome of a project while there is still time to alter its course.