Quality and Integration Management
Not sure you’re ready?
Take the ~3-minute readiness diagnostic and see where you stand.
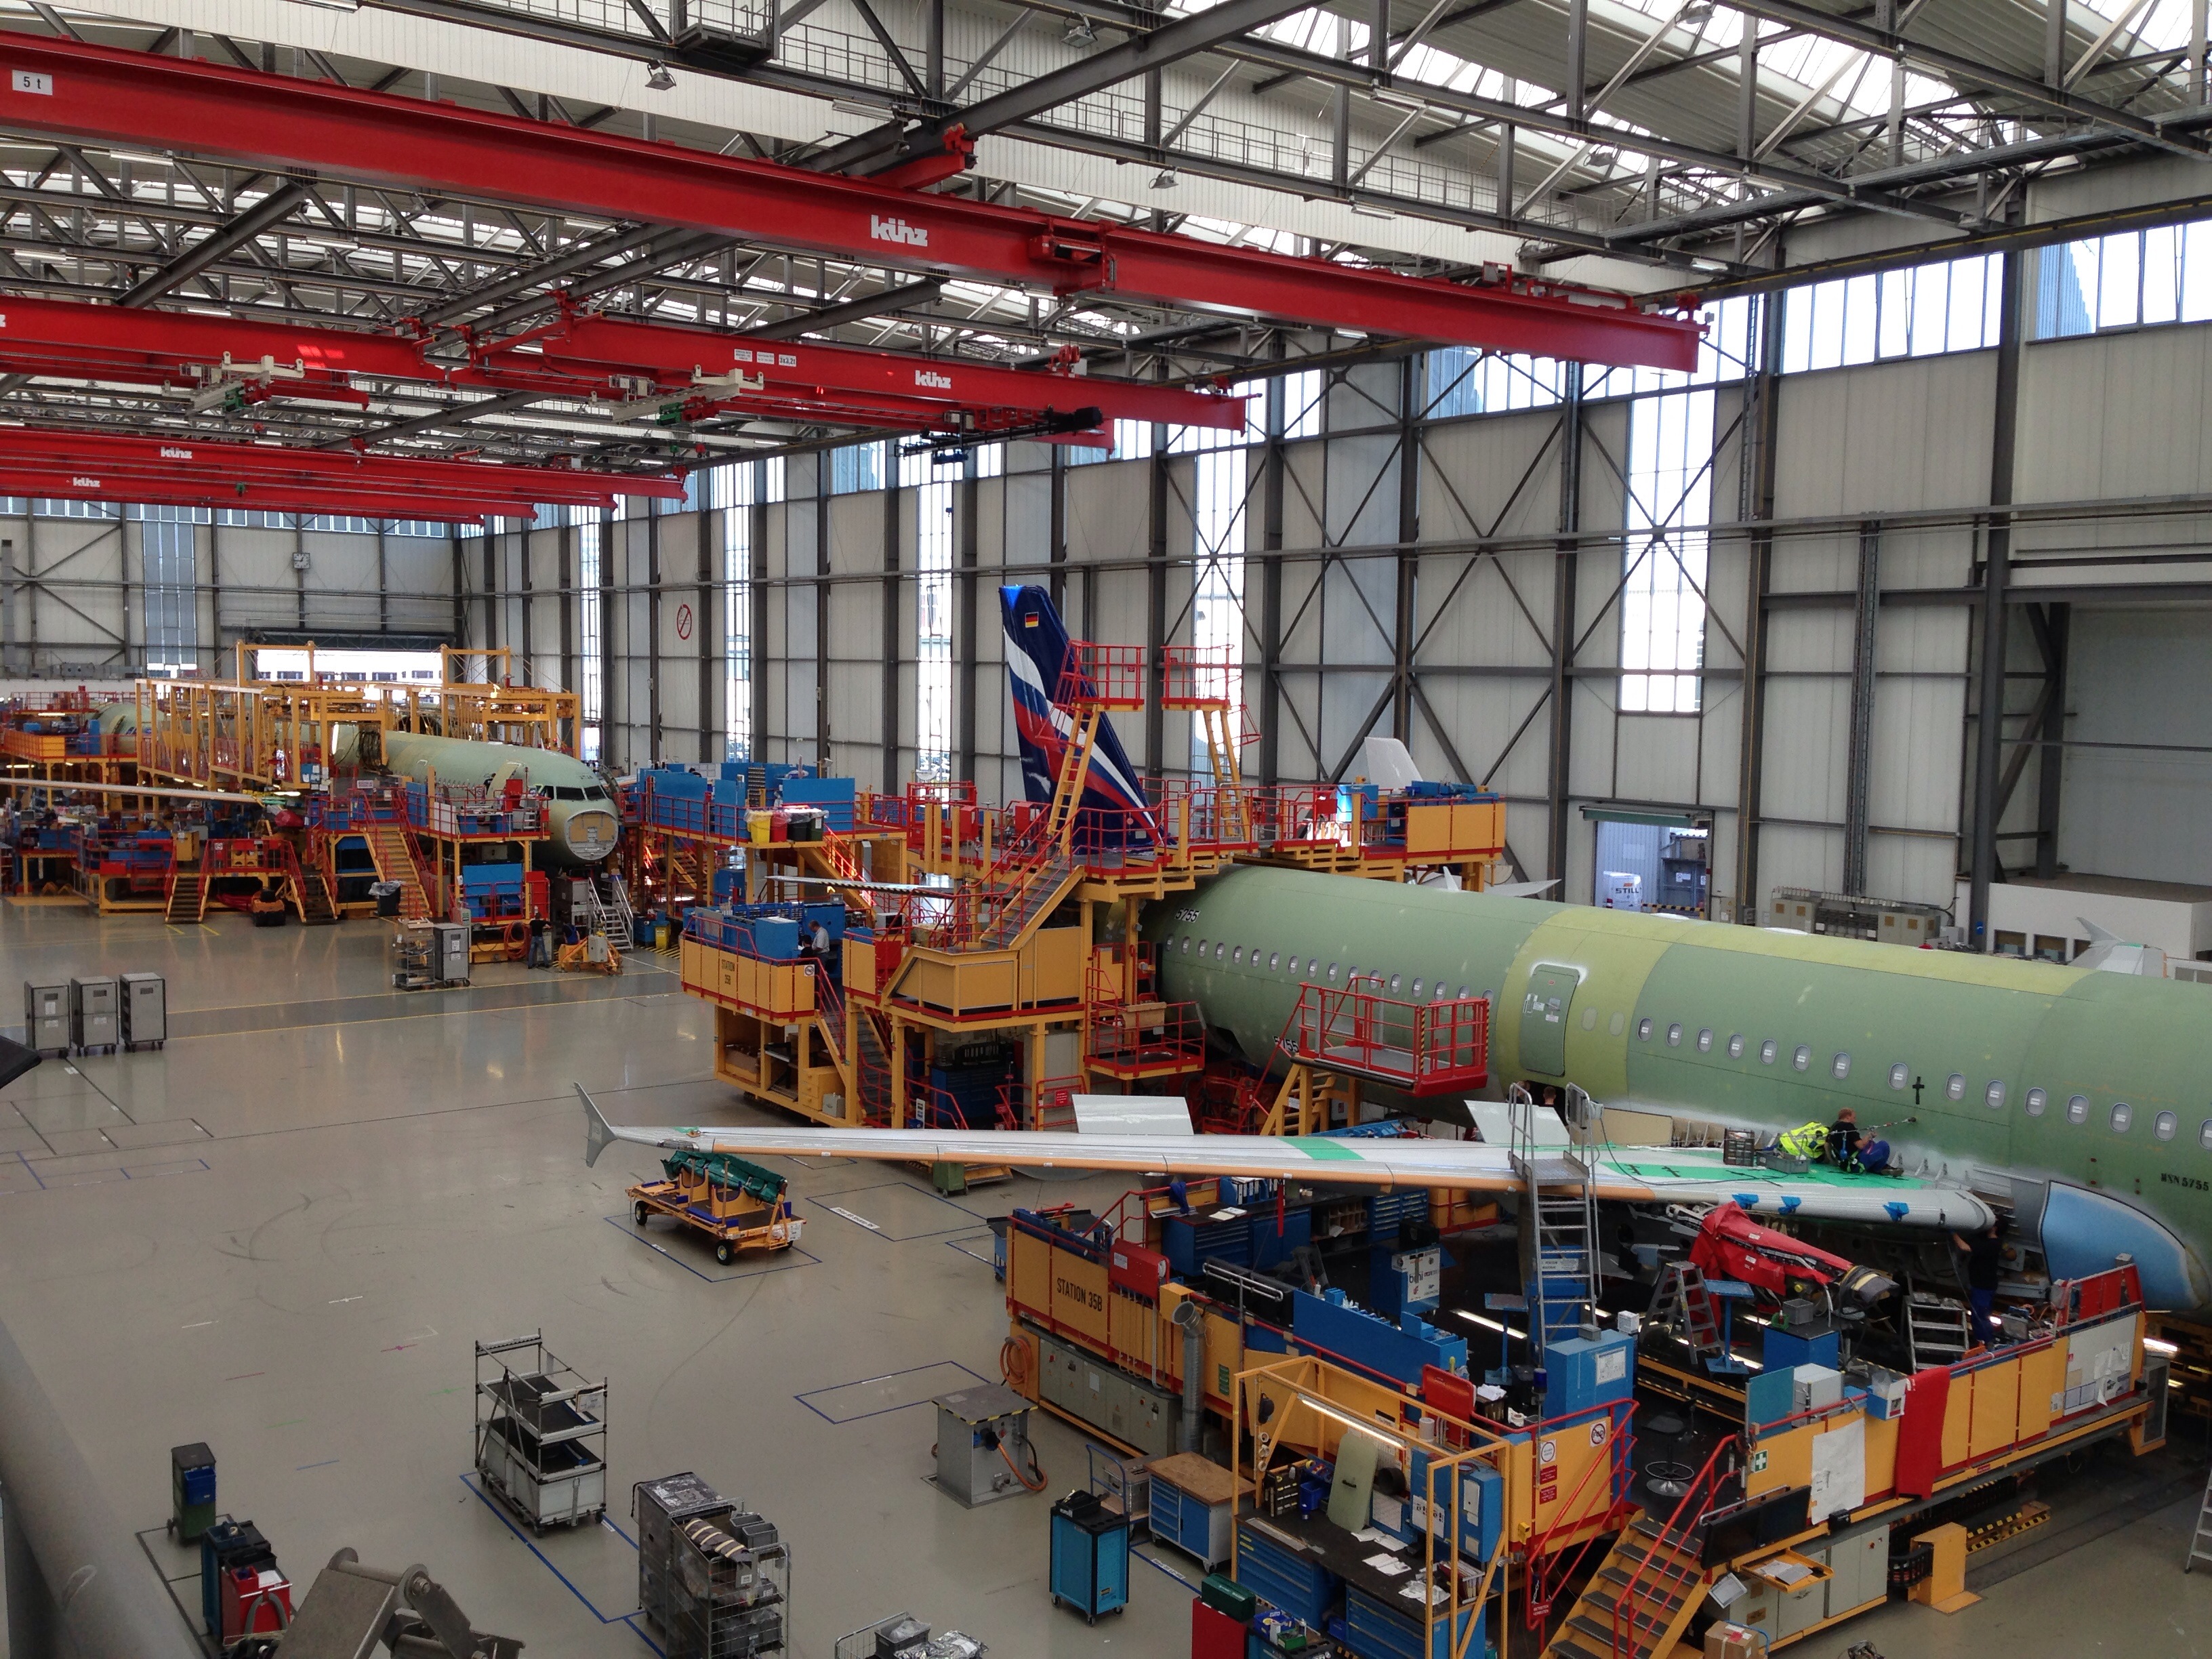
Designing a commercial airliner requires independent engineering teams to construct the avionics, the hydraulics, the cabin interior, and the turbofan engines. If the engine team optimizes solely for maximum thrust without coordinating with the structural engineers, the airframe will literally tear itself apart in flight. The discipline that prevents this catastrophic isolation is integration. Once integrated, the aircraft must perform flawlessly; a poorly cast turbine blade or a failing altimeter is unacceptable. This is the domain of quality. Together, integration and quality act as the central nervous system and the structural integrity of any successful project. In this guide, we will explore the precise mechanics of both.
When working on a complex initiative, it is tempting to view a project as merely a collection of isolated tasks. This is a profound mistake. Project integration management includes the processes required to combine and coordinate all project management activities. It is the physics of making disparate pieces work together.
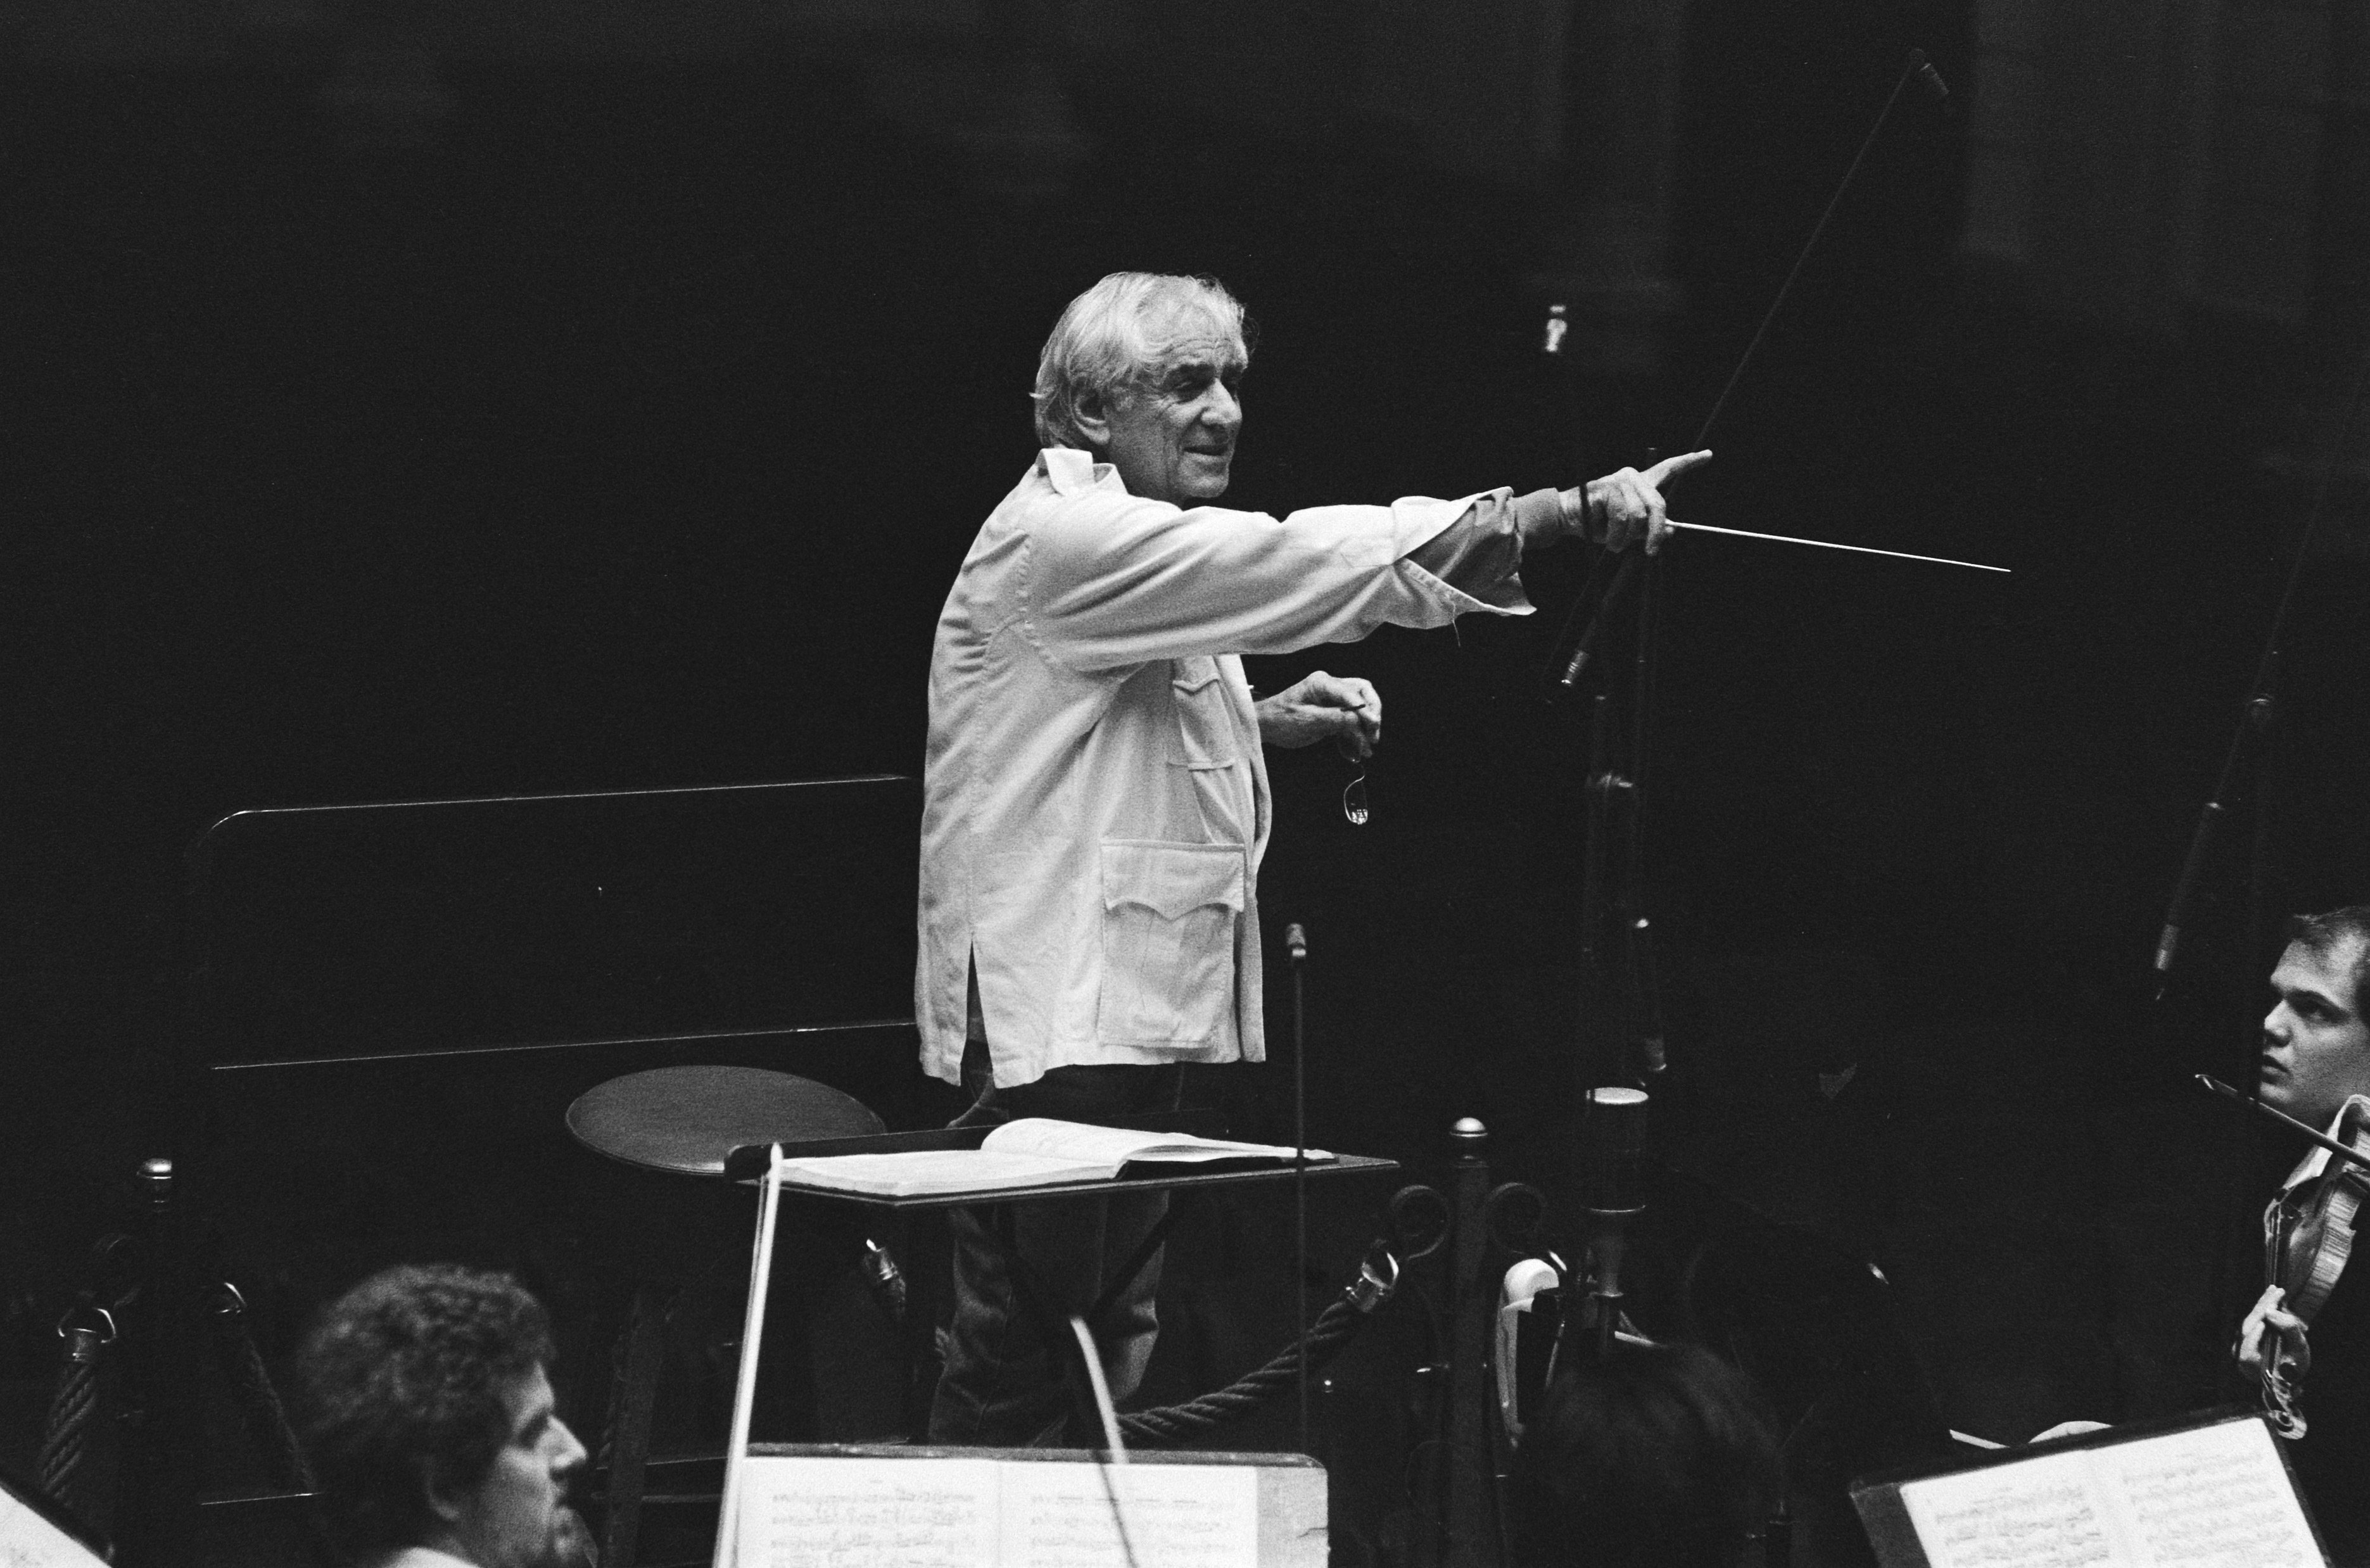
Because integration requires a holistic view of the entire endeavor, it carries a unique burden of accountability. You can hire a scheduler to build a timeline, or an analyst to gather requirements, but the project manager is solely responsible for project integration management. This core accountability is absolute; project integration management cannot be delegated to other project team members. You are the orchestra conductor. You do not play the instruments, but you alone are responsible for the symphony.
The Lifecycle of Integration
Integration spans the entire life of the project, executing specific processes at each critical juncture.
1. Initiation: The Spark
A project does not legally exist within an organization until it is formally recognized. The Develop Project Charter process formally authorizes the existence of a project. The charter is not a detailed project plan; it is a fundamental mandate. By officially assigning the project manager, the project charter provides the project manager with the authority to apply organizational resources to project activities. Without this document, you are simply an employee with an idea.
2. Planning: The Blueprint
With authority granted, the project manager must consolidate all planning efforts. The Develop Project Management Plan process defines and integrates all subsidiary project plans—such as your scope, schedule, cost, and quality plans. This master document acts as the ultimate rulebook. Not only does it outline the path forward, as the project management plan defines how the project is executed, but it also establishes the boundaries for governance, because the project management plan defines how the project is monitored and controlled.
3. Execution: Leading and Learning
Execution is where capital is spent and physical work is performed. Direct and Manage Project Work is the process of leading the work defined in the project management plan.
As your team builds the product, they generate invaluable intellectual capital. Integration requires capturing this. Manage Project Knowledge is the process of using existing knowledge to achieve project objectives, ensuring you do not repeat past mistakes. But knowledge is dynamic; as you solve novel problems, Manage Project Knowledge involves creating new knowledge to achieve project objectives.
We categorize this knowledge into two distinct types:
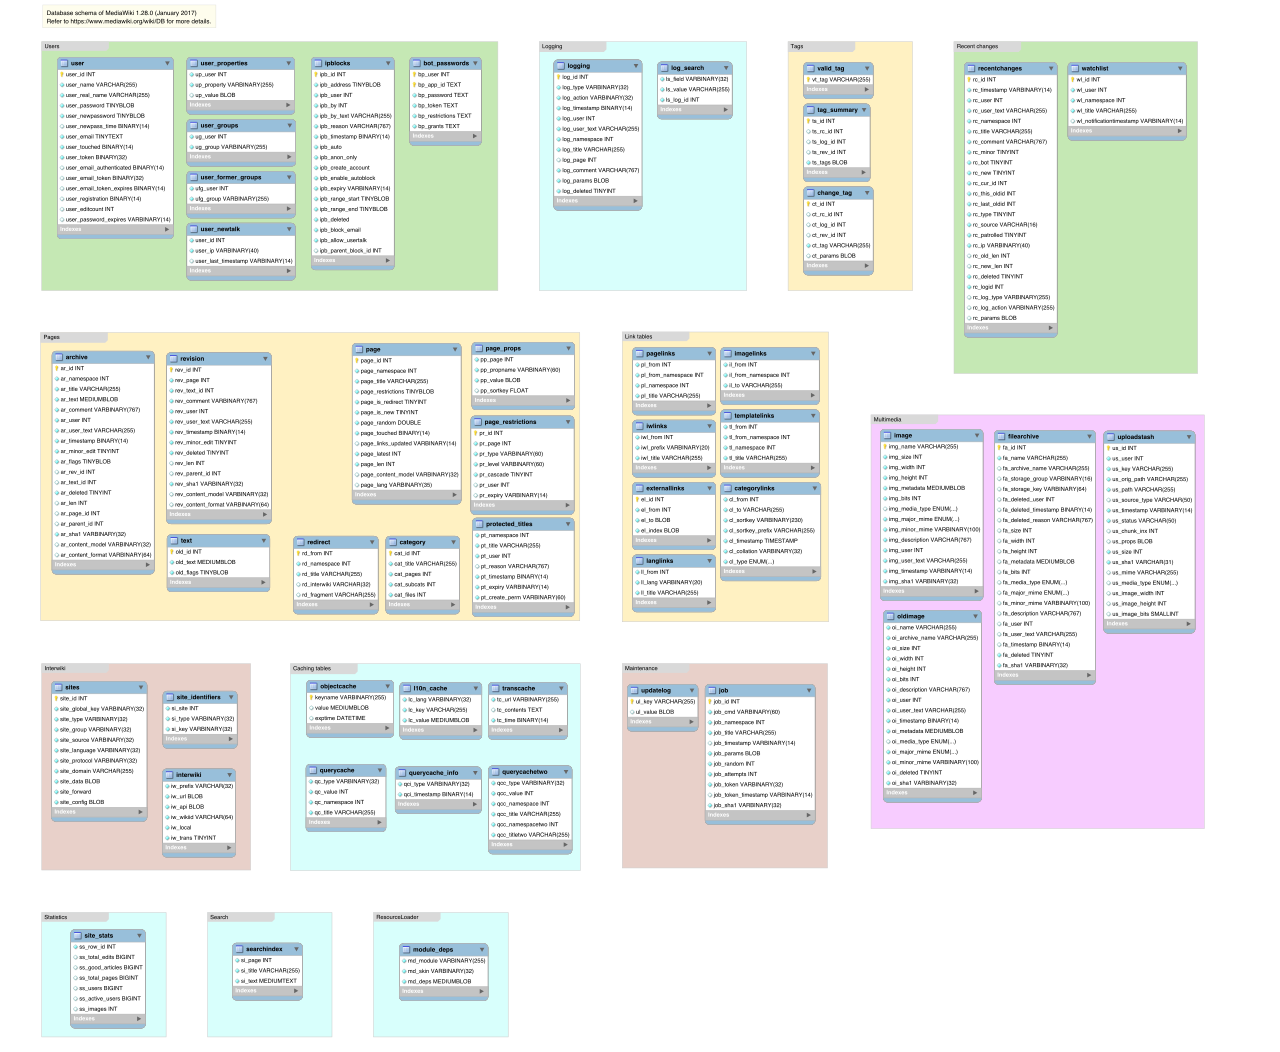
- Explicit Knowledge: This is straightforward and easily documented. Explicit knowledge can be readily codified using words, pictures, or numbers. A database schema, a financial spreadsheet, and a technical manual are all explicit.
- Tacit Knowledge: This is deeply intuitive and harder to share. Tacit knowledge is personal knowledge that is difficult to express. You cannot easily write down a senior developer's intuition for identifying fragile code. Thus, tacit knowledge includes personal beliefs, experience, and insights. Capturing tacit knowledge often requires shadowing, mentoring, and collaborative discussions.
4. Monitoring and Controlling: Guarding the Baseline
As work proceeds, reality will inevitably diverge from the plan. Monitor and Control Project Work is the process of tracking project progress against the performance objectives.
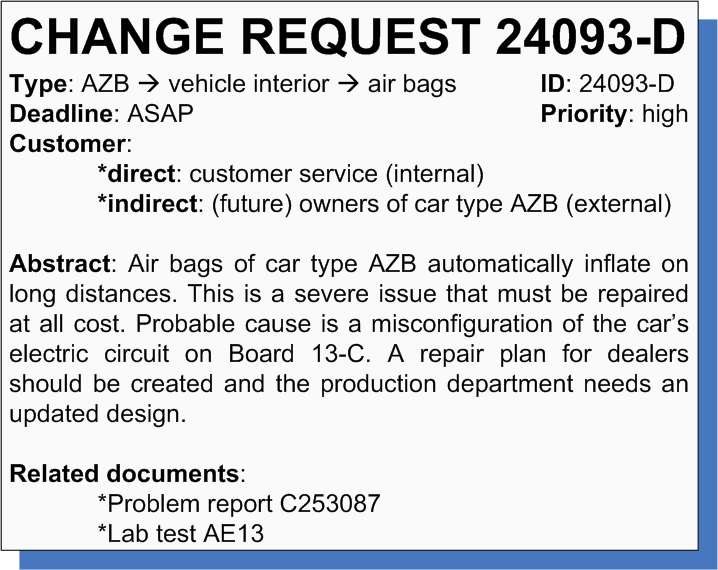
When variances occur, stakeholders will request changes. Change is not inherently bad, but unmanaged change destroys integration. Therefore, Perform Integrated Change Control is the process of reviewing all project change requests. This process ensures that a change to the schedule is evaluated for its impact on cost, scope, and quality before a decision is made. Naturally, Perform Integrated Change Control includes managing approved changes to project deliverables.
To maintain objectivity, organizations often utilize a dedicated committee. The Change Control Board is a formally chartered group responsible for reviewing and evaluating project changes. This board acts as the project's supreme court; the Change Control Board holds the authority to approve, defer, or reject change requests. Once they issue a ruling, documentation must immediately catch up with reality, as approved change requests frequently require updates to the project management plan.
5. Closing: The Formal Conclusion
Projects are temporary endeavors; they must end. Close Project or Phase is the process of finalizing all activities to formally complete a project.
Closing is more than just stopping work. It ensures that value is securely handed over. The Close Project or Phase process finalizes the transfer of the final product to the customer. Administratively, the wisdom gained throughout the lifecycle must be preserved for future teams. Therefore, lessons learned documentation must be formally archived during the Close Project or Phase process.
In casual conversation, we often conflate the concept of "luxury" with the concept of "quality." In project management, this conflation is a fatal trap. Project quality management ensures the project requirements are met and validated. It is entirely about fulfilling the promise you made to the stakeholder.
The Classic Trap: Quality vs. Grade
To master quality management, we must fiercely separate it from grade.
Quality is the degree to which a set of inherent characteristics fulfills requirements. Grade is a category assigned to deliverables having the same functional use but different technical characteristics.
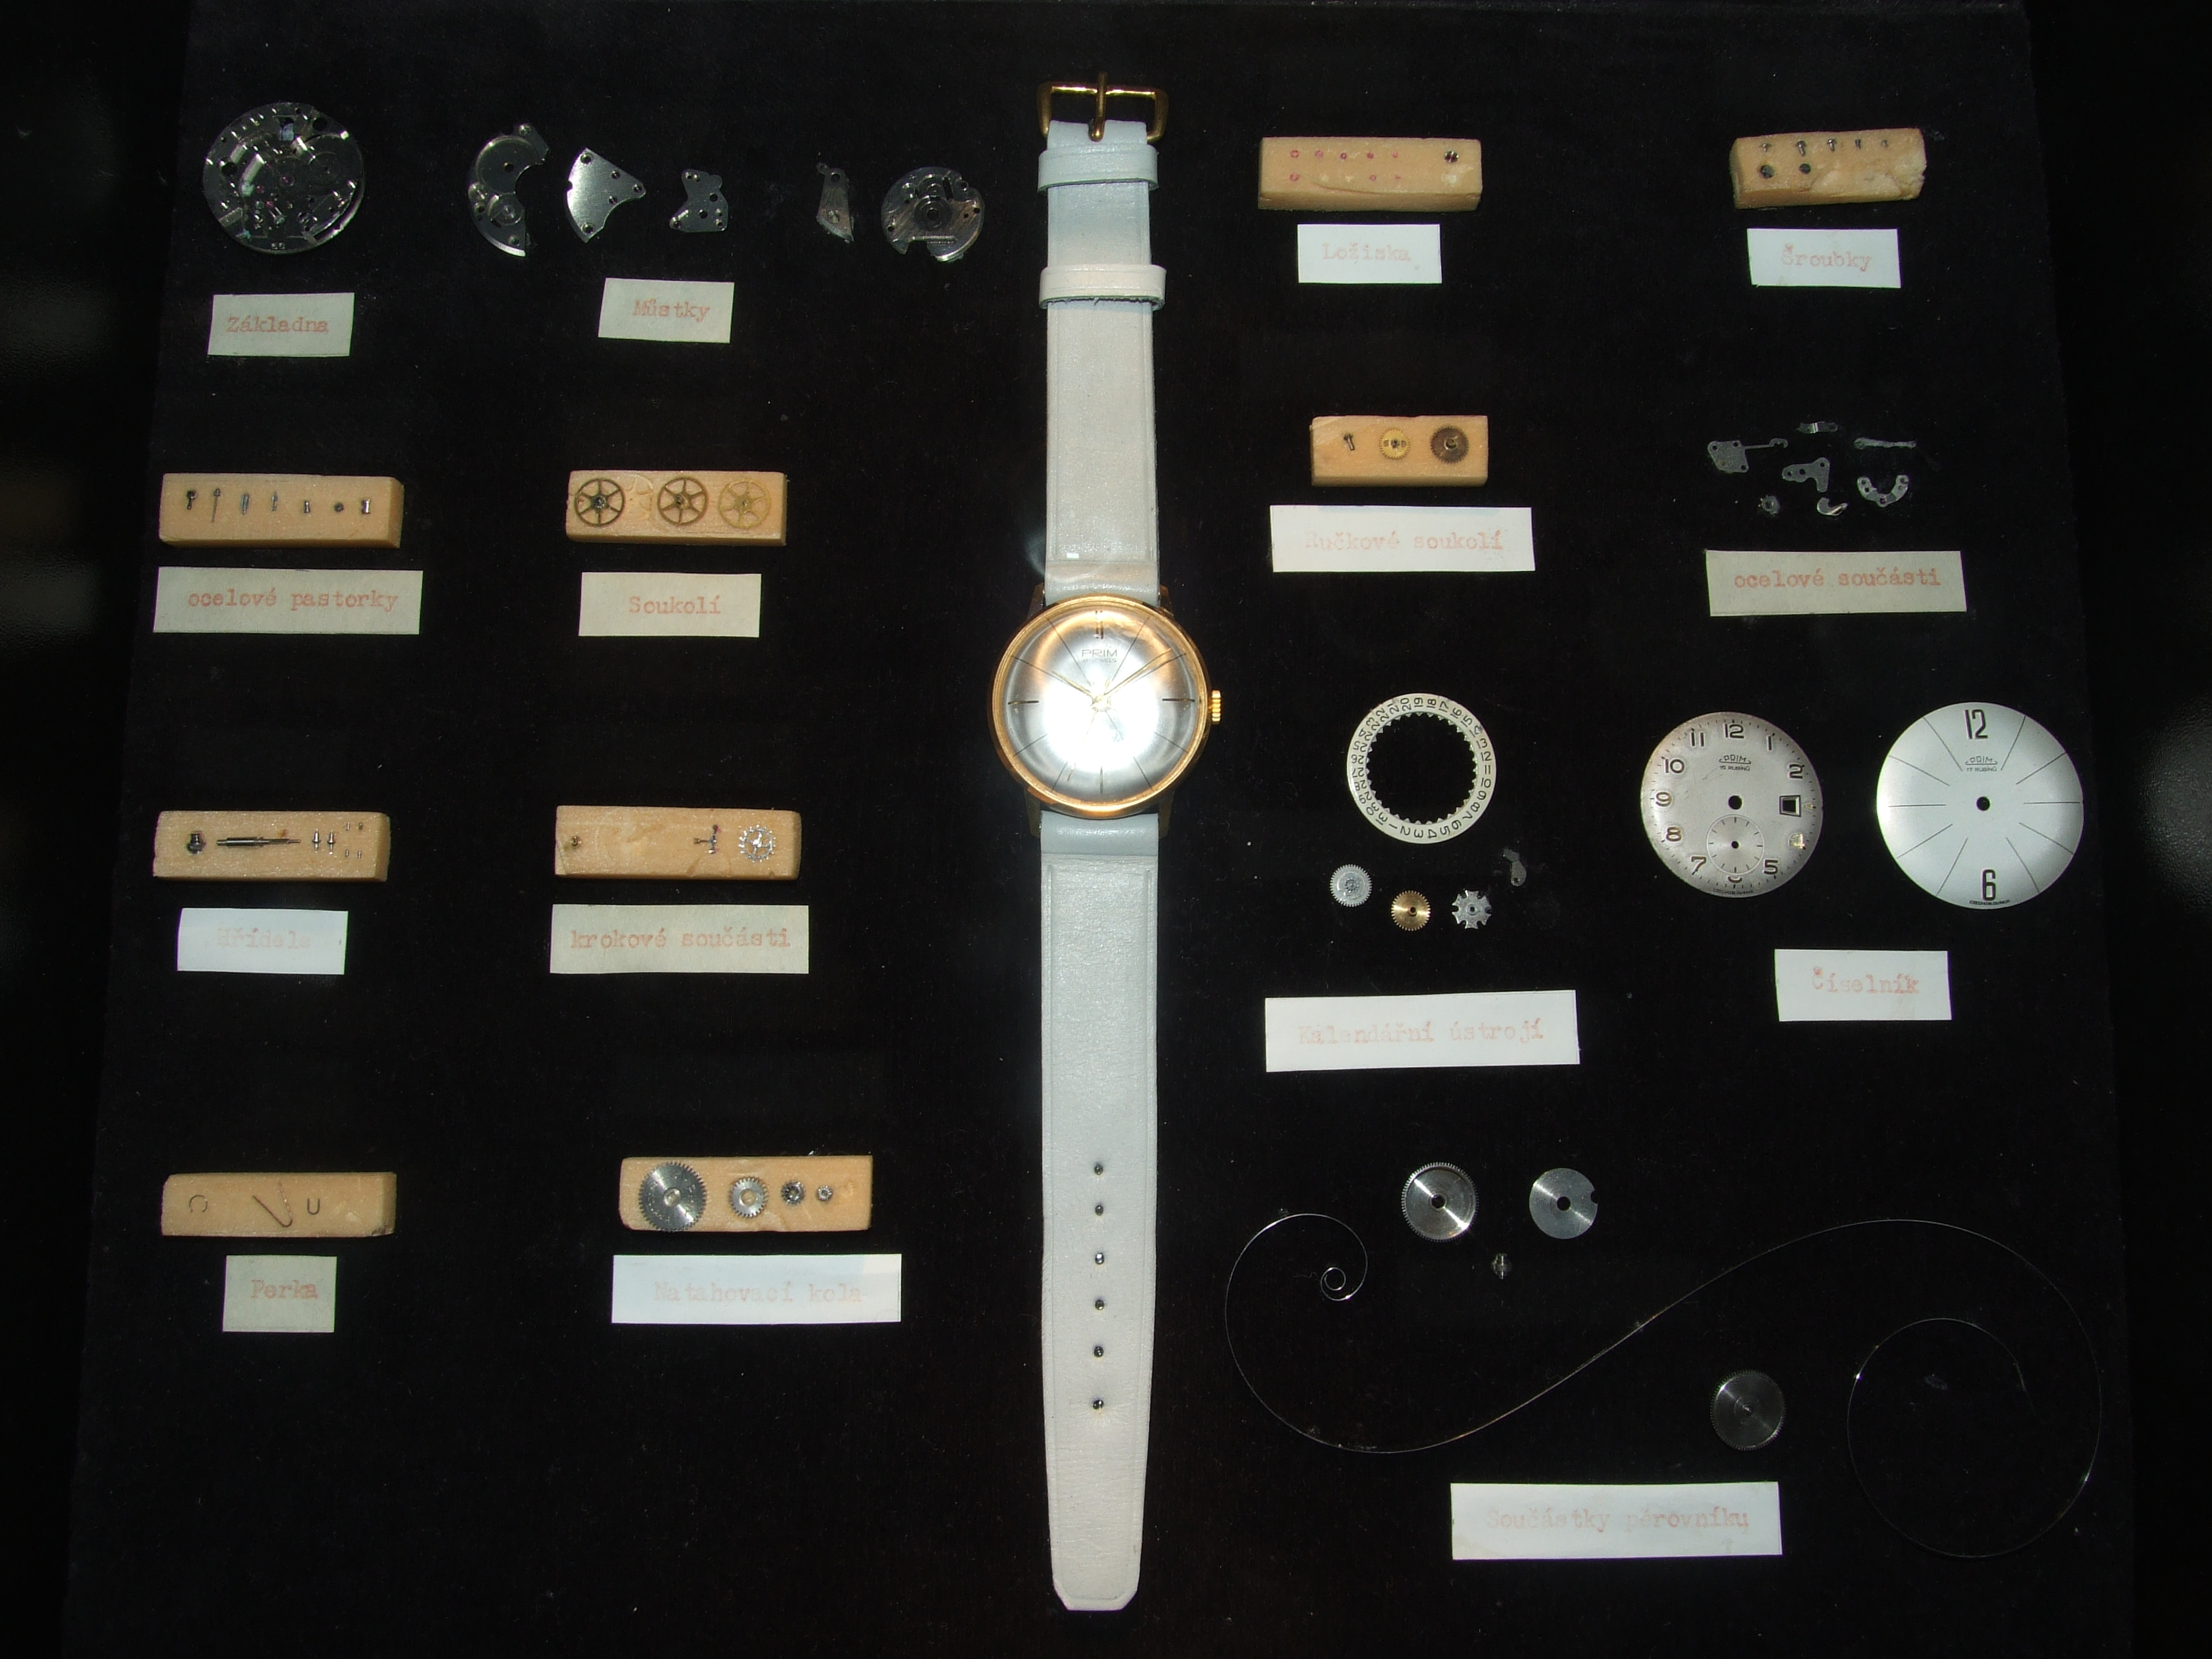
Consider a $15 basic digital watch and a $15,000 diamond-encrusted mechanical timepiece. They share the same functional use (telling time), but they belong to entirely different categories. The digital watch is a low-grade item, while the mechanical watch is a high-grade item.
Now, imagine the $15 digital watch keeps perfect time and its battery lasts for exactly as long as advertised. It fulfills its requirements flawlessly. Therefore, it is a high-quality product. Conversely, imagine the $15,000 luxury watch loses five minutes an hour and its diamonds randomly fall off. It fails its requirements. It is a low-quality product.
This distinction dictates a fundamental rule of project management:
- Low grade is not inherently a problem if the deliverable meets the assigned quality requirements.
- Low quality is inherently a problem in project management.
You can intentionally choose to build a low-grade solution to save money or time, but you can never intentionally choose to deliver low quality.
Planning Quality and the Cost of Quality
During the planning phase, we must mathematically define what "meeting requirements" actually looks like. The Plan Quality Management process identifies specific quality requirements for the project. Once these targets are set, the quality management plan specifies how the project team will implement organizational quality policies.
A central philosophy in quality planning is the realization that stopping an error early is vastly cheaper than catching it late.
- Prevention keeps errors out of a project process. (e.g., training staff, buying better materials).
- Inspection keeps errors out of the hands of the customer. (e.g., testing the final product on an assembly line).
Economically, we frame this using the Cost of Quality (CoQ) framework. Cost of Quality includes all costs incurred over the life of a product to prevent nonconformance to requirements.
We split the Cost of Quality into two distinct buckets: the money we spend to ensure things go right, and the money we lose when things go wrong.
| Cost Category | Sub-Category | What it Includes |
|---|---|---|
| Cost of Conformance | Prevention Costs | Training, robust materials, process documentation. Cost of Conformance includes prevention costs. |
| Appraisal Costs | Destructive testing, software QA testing, inspections. Cost of Conformance includes appraisal costs. | |
| Cost of Nonconformance | Internal Failure Costs | Rework, scrap, fixing bugs before the product ships. Cost of Nonconformance includes internal failure costs. |
| External Failure Costs | Warranty work, liabilities, lawsuits, lost reputation. Cost of Nonconformance includes external failure costs. |
By spending money proactively on the Cost of Conformance, a project manager dramatically reduces the devastating financial impacts of the Cost of Nonconformance.
Execution vs. Monitoring: Manage Quality vs. Control Quality
The CAPM exam requires you to clearly distinguish between managing quality and controlling quality. They sound synonymous, but they operate on completely different timelines and targets.
Manage Quality is the process of translating the quality management plan into executable quality activities. This is a forward-looking, systemic effort. When you manage quality, you aren't looking at a broken widget; you are looking at the factory machine that produced it. Manage Quality focuses on improving the project processes. A key tool here is the audit. Quality audits determine if project activities comply with organizational policies.
In contrast, Control Quality is the process of monitoring and recording results of executing the quality management activities. This is backward-looking and product-focused. When you control quality, you hold the widget in your hand to see if it is broken. Control Quality focuses on verifying that project deliverables meet the required standards.
The Quality Toolkit
When a process fails, or when variations threaten the project's stability, project managers rely on specific analytical tools to diagnose the physical reality of the problem.
1. The Cause-and-Effect Diagram
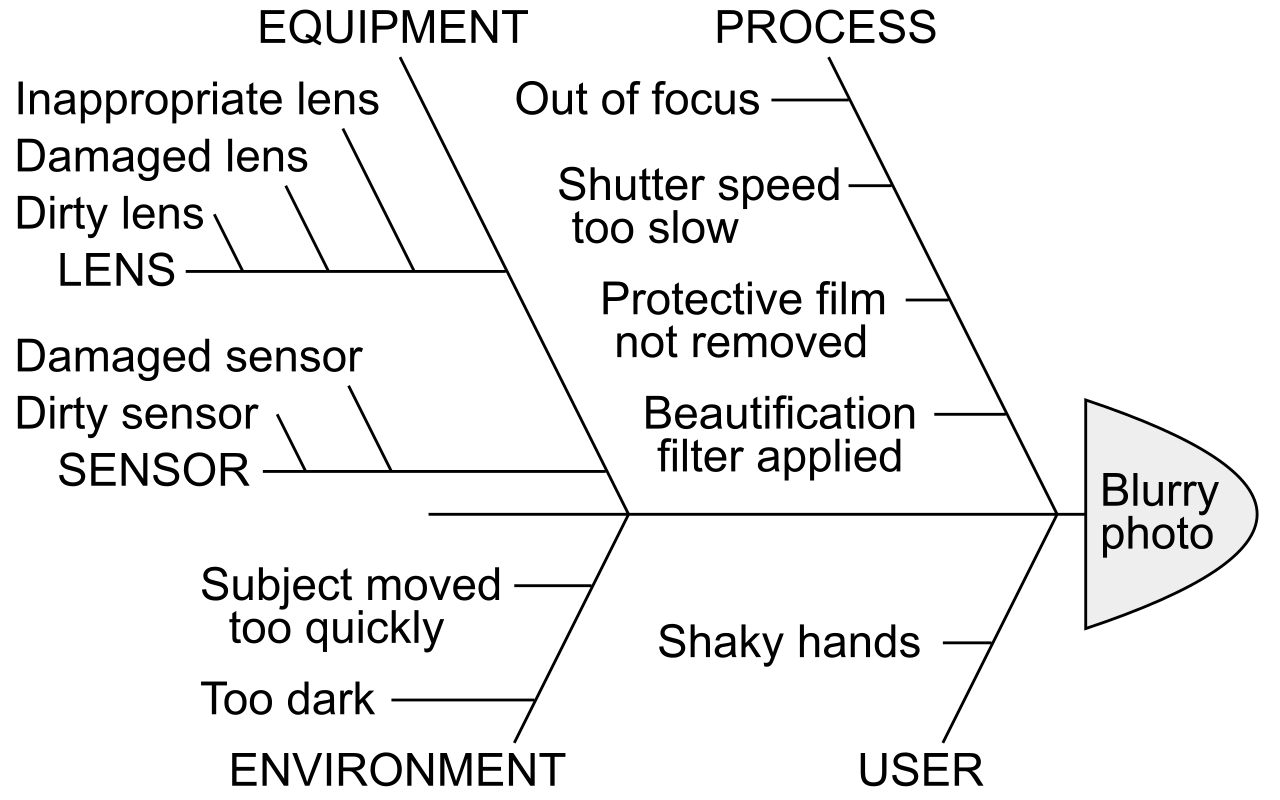
When faced with a complex defect, you must dissect the root cause without bias. A cause-and-effect diagram breaks down the potential causes of a problem into discrete categories (often categorized into Methods, Machines, Materials, and Manpower). Because of its distinct visual shape—a central spine leading to a "head" (the problem) with diverging "ribs" for the categories—a cause-and-effect diagram is also known as a Fishbone diagram. Furthermore, to honor the quality pioneer who invented it, a cause-and-effect diagram is also known as an Ishikawa diagram.
2. The Pareto Chart
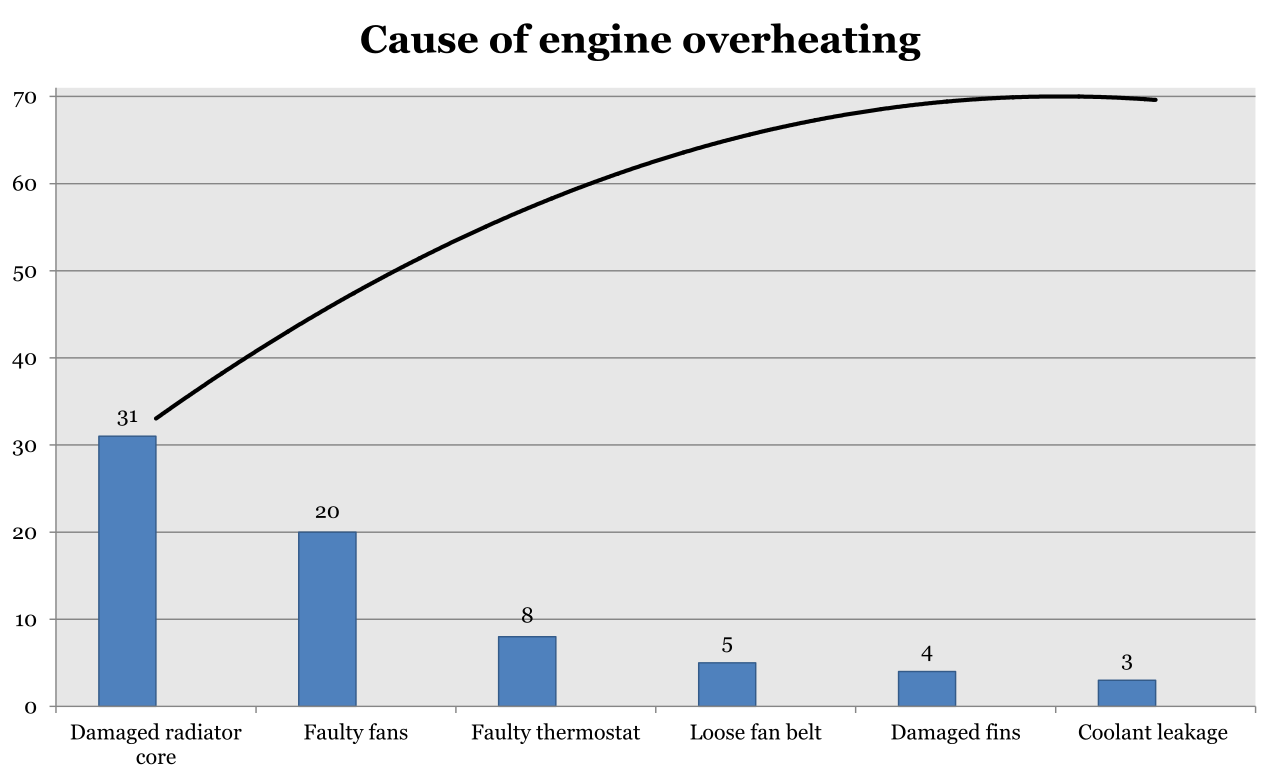
If your software application has a hundred different bugs, where do you allocate your limited QA resources? You use a Pareto chart. A Pareto chart is a type of histogram used to identify the most frequent sources of problems. It relies on the Pareto principle, a statistical phenomenon found across economics and engineering. The 80/20 rule in a Pareto chart suggests that 80 percent of problems are due to 20 percent of causes. By organizing defect categories by frequency from highest to lowest, the Pareto chart immediately visualizes which vital few causes to eliminate first to achieve the most massive improvement in quality.
3. Control Charts
A project manager must know if a recurring process is functioning normally or spiraling out of control. Control charts determine whether a process is stable or has predictable performance.
A control chart plots your process data points chronologically against a central mean (average) and predetermined Upper and Lower Control Limits. If a data point breaches an outer limit, the process is mathematically out of control.
However, statistics can reveal systemic flaws before a process completely breaches its limits. Watch the data points dancing around the mean. If a process is truly stable and random, data points should alternate normally above and below the average. If they don't, a hidden bias has infected your system. The Rule of Seven states that seven consecutive data points on one side of the mean in a control chart indicate an out-of-control process. Even if those seven points are well within the acceptable boundaries, their lack of randomness proves the system is no longer behaving predictably.
Integration ensures that a project’s countless variables are orchestrated into a single, cohesive reality. Quality ensures that the resulting reality functions exactly as promised. Master both, and you possess the foundational architecture of elite project management.