Plan and Optimize Quality: Execution
Not sure you’re ready?
Take the ~3-minute readiness diagnostic and see where you stand.
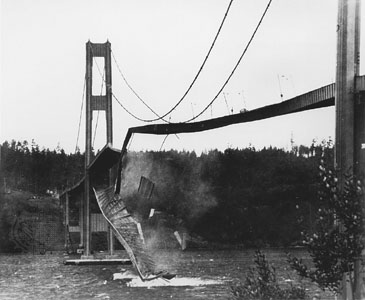
When an engineer specifies the grade of steel for a suspension bridge, they are not merely filing paperwork; they are calculating the exact threshold between structural integrity and catastrophic failure. Quality in project management operates on the exact same physical and economic laws. It is not an abstract administrative hurdle, nor is it a checklist tacked onto the end of a project. Quality is the conscious design of a system that produces predictable, valuable outcomes while rigorously eliminating waste and variance. If you manage a project by waiting until the product is finished to check if it works, you are not managing quality—you are merely observing your own mistakes.
To master project quality for the PMP exam, we must understand how to construct a process that prevents defects, the financial mechanics of investing in quality, and the statistical tools used to unearth the root causes of failure. We will explore how predictive, agile, and hybrid environments approach these challenges, translating abstract theories into the daily reality of delivering value.
Before we adjust a single process, we must understand how quality impacts the balance sheet. Every decision you make regarding quality has a financial consequence. The Cost of Quality framework evaluates the total financial cost incurred by investing in preventing nonconformance and repairing product defects.
Think of this framework as a scale. On one side, you have the money you spend proactively to guarantee success. On the other side, you have the money you bleed out when things inevitably break.
Cost of Conformance
The Cost of Conformance represents money spent during the project execution to avoid failures and ensure quality standards are met. You are investing capital to do it right the first time. Prevention costs and appraisal costs are the two primary categories within the Cost of Conformance.
- Prevention Costs: This is money spent keeping defects out of the process entirely. Building a highly capable team by training team members is classified as a prevention cost. Similarly, documenting processes and standardizing workflows are examples of prevention costs, as they remove the ambiguity that leads to human error. Even physical investments, such as purchasing testing equipment and performing routine equipment maintenance are considered prevention costs.
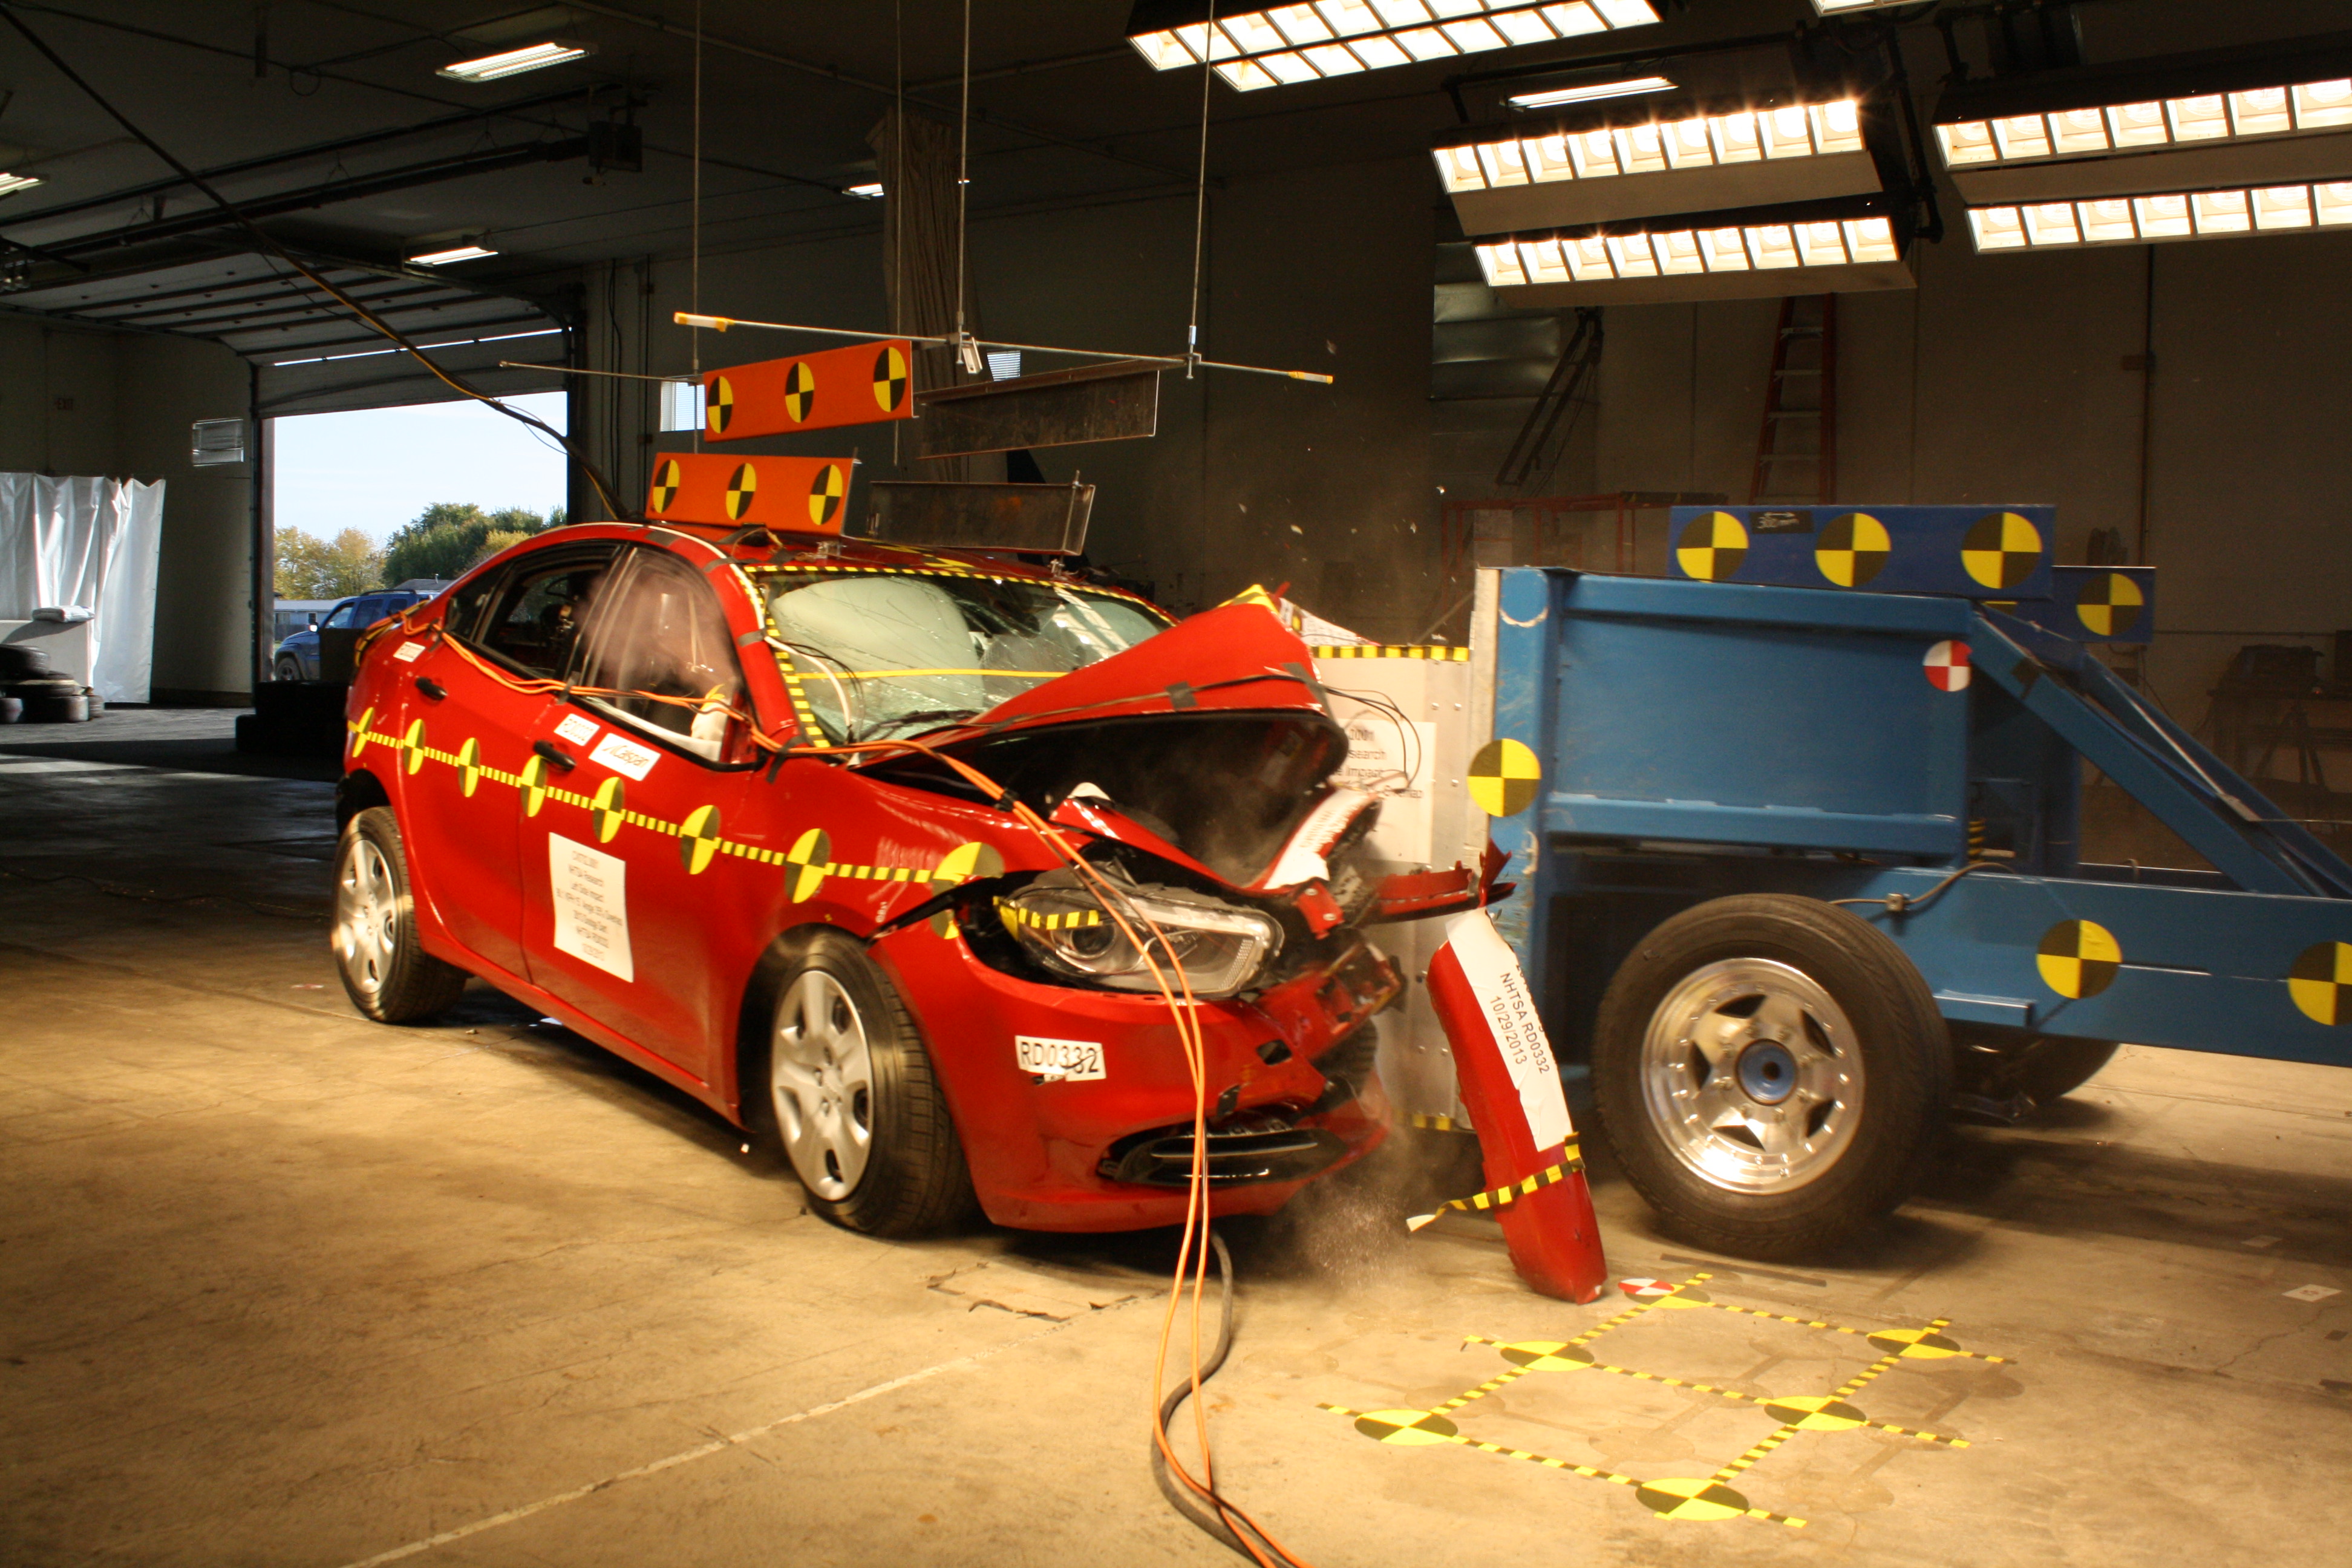
- Appraisal Costs: This is the money spent assessing what you have built to ensure it meets the standard before it leaves your hands. Routine inspections and audits are considered appraisal costs. Testing products to assess quality is an example of an appraisal cost. Interestingly, losses associated with destructive testing are classified as appraisal costs—if you must intentionally crash a car to verify its safety rating, the cost of that destroyed vehicle is the price of appraisal.
Cost of Nonconformance
If you underinvest in conformance, you will pay a much steeper penalty later. The Cost of Nonconformance represents money spent during and after the project due to failures in meeting quality expectations. Internal failure costs and external failure costs are the two primary categories within the Cost of Nonconformance.
- Internal Failure Costs: These are defects caught before the customer ever sees the product. Reworking a defective product before the customer receives the product is an internal failure cost. If the product is beyond repair, scrapping a defective product entirely is classified as an internal failure cost. You lose the materials, the labor, and the time, but you save your reputation.
- External Failure Costs: This is the nightmare scenario. The defect has escaped your facility and reached the public. Fulfilling warranty work is an example of an external failure cost. But the financial bleeding doesn't stop at warranties; lost business due to a defective product reaching the market is an external failure cost, as are the legal liabilities resulting from product defects.
The Professor's Rule of Thumb: A $1 investment in prevention often saves $10 in appraisal, $100 in internal failure, and $1,000 in external failure.
One of the most vital distinctions in project management is knowing the difference between evaluating the process and evaluating the product. The Project Management Body of Knowledge separates these into two distinct processes.
Manage Quality (Process Focus)
Manage Quality is the process of translating the quality management plan into executable quality activities. Think of this as looking at the factory floor. The Manage Quality process focuses heavily on improving the overall processes used to produce project deliverables. By refining how the work is done, you inherently improve what is produced. Quality assurance activities fall under the Manage Quality process in the Project Management Body of Knowledge framework.
To manage quality effectively, we deploy specific techniques:
- Design for X: Much like solving for X in an algebraic equation, Design for X is a set of technical guidelines applied during the design of a product to optimize a specific characteristic. The X in Design for X can represent characteristics like reliability, deployment, assembly, manufacturing, or serviceability. If X is "assembly," you design the product with fewer parts so it is easier to put together.
- Quality Audits: You cannot always grade your own homework. A quality audit is a structured, independent process to determine if project activities comply with organizational policies and procedures. Quality audits proactively identify good practices, gaps, and nonconformities to improve subsequent project activities.
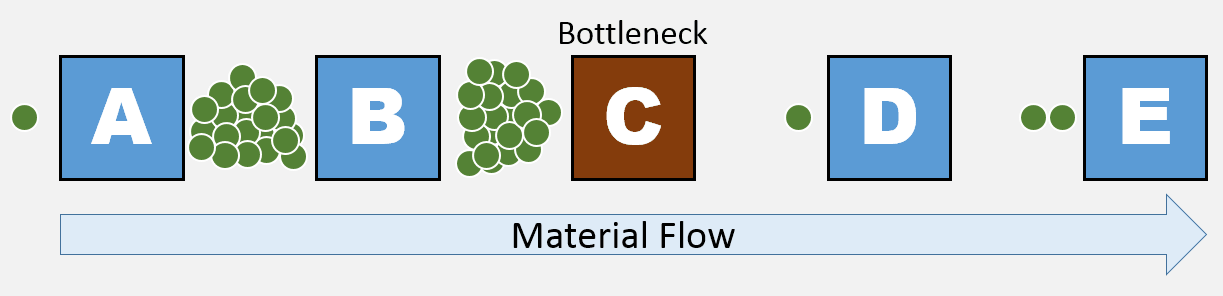
- Process Analysis: When the assembly line slows down, process analysis identifies opportunities for process improvements based on problems or bottlenecks experienced on the project.
Control Quality (Product Focus)
If Manage Quality is evaluating the factory floor, Control Quality is picking up the finished widget coming off the conveyor belt and inspecting it. Control Quality is the process of monitoring and recording results of executing the quality activities to assess performance. The Control Quality process focuses on verifying the correctness of the actual deliverables produced by the project team.
When you are controlling quality, raw data is useless until it is visualized and analyzed. We rely on statistical tools to reveal the hidden mechanics of a process.
Control Charts
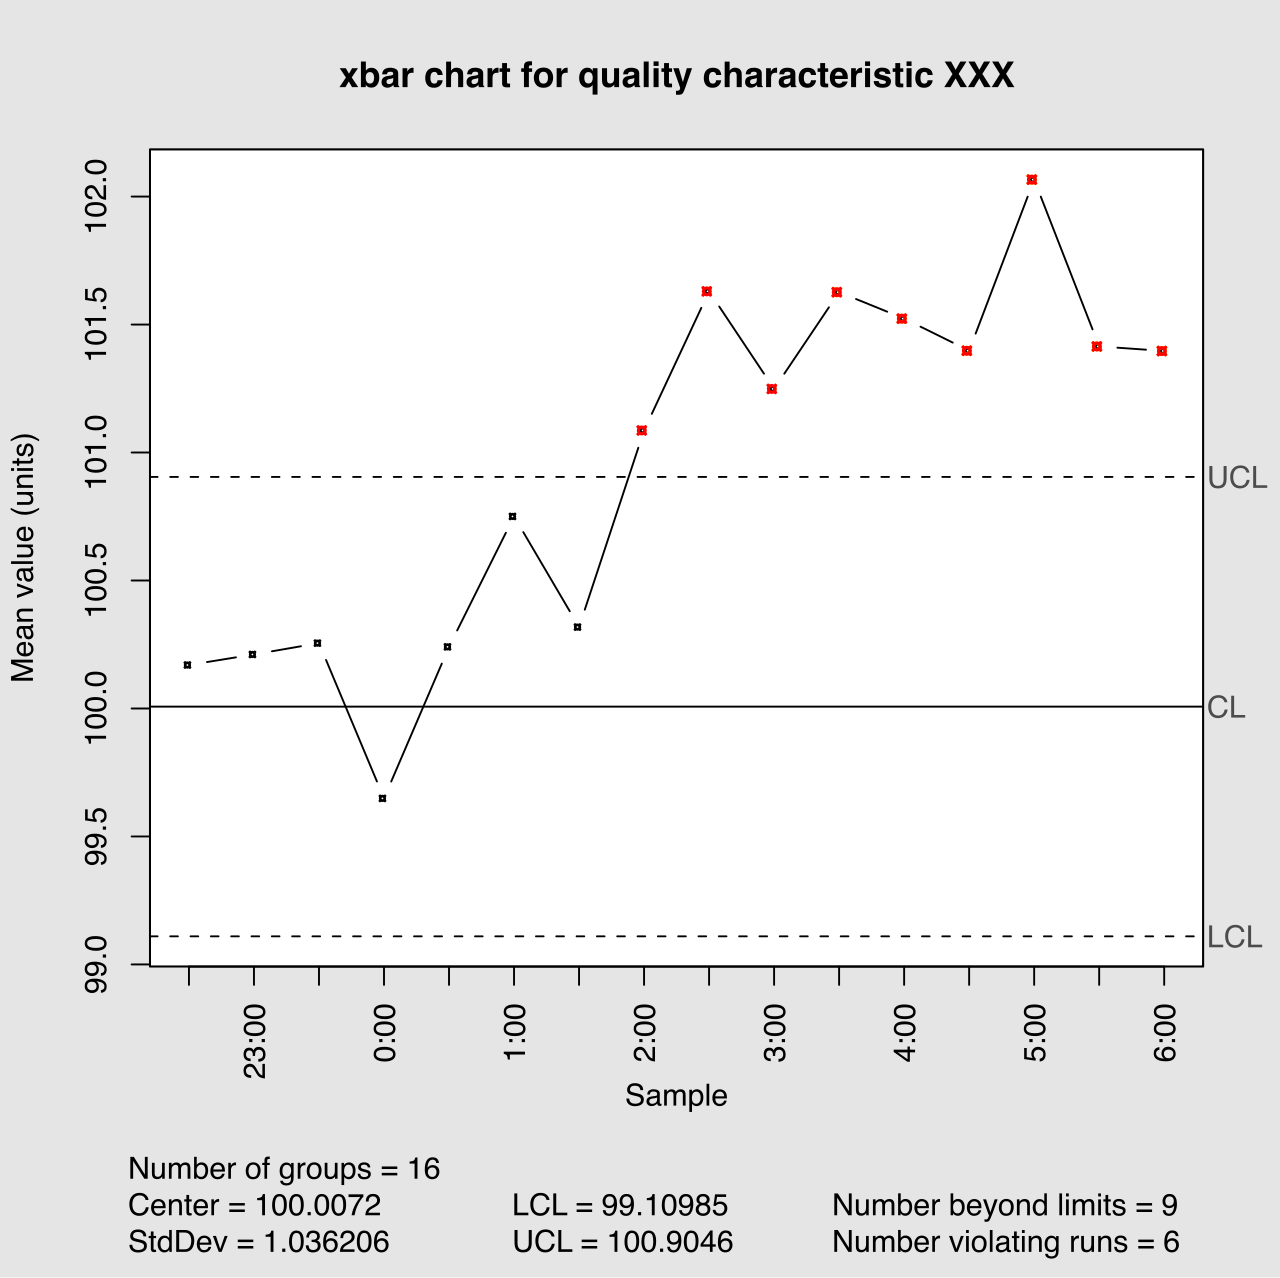
Imagine you are filling 1-liter bottles of water. Some will have 1.01 liters, others 0.99 liters. That is normal variation. But how do you know when the filling machine is broken? A control chart is a graphical display of process data over time plotted against established upper and lower control limits.
Upper and lower control limits on a control chart are typically set at plus or minus three standard deviations from the mean. These limits represent the mathematical boundaries of normal, expected variation.
- A process is considered out of control if a single data point falls outside the upper or lower control limits on a control chart. This implies a specific, assignable cause broke the system.
- Alternatively, we look for non-random patterns within the limits. The Rule of Seven states that a process is out of control if seven consecutive data points fall on one side of the mean in a control chart. Even if these points are within the control limits, probability dictates that seven consecutive points above or below average is a statistical anomaly requiring investigation.
Finding the Root Cause
When a defect is found, we must dissect it.
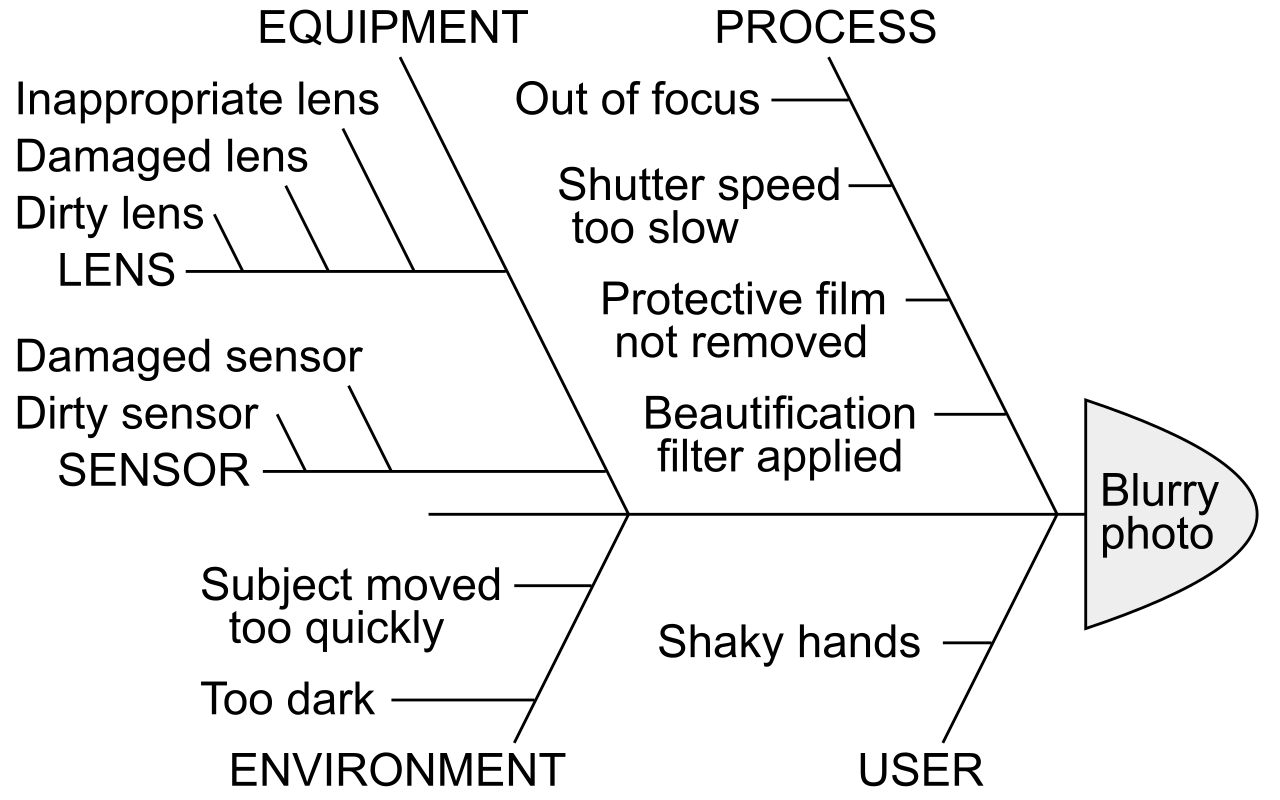
- Cause-and-effect diagrams trace an undesirable project effect or defect back to its underlying root cause. Because of their visual structure, cause-and-effect diagrams are commonly known as fishbone diagrams or Ishikawa diagrams. You place the defect at the "head" of the fish, and trace categories of causes (e.g., equipment, materials, people) along the "bones."
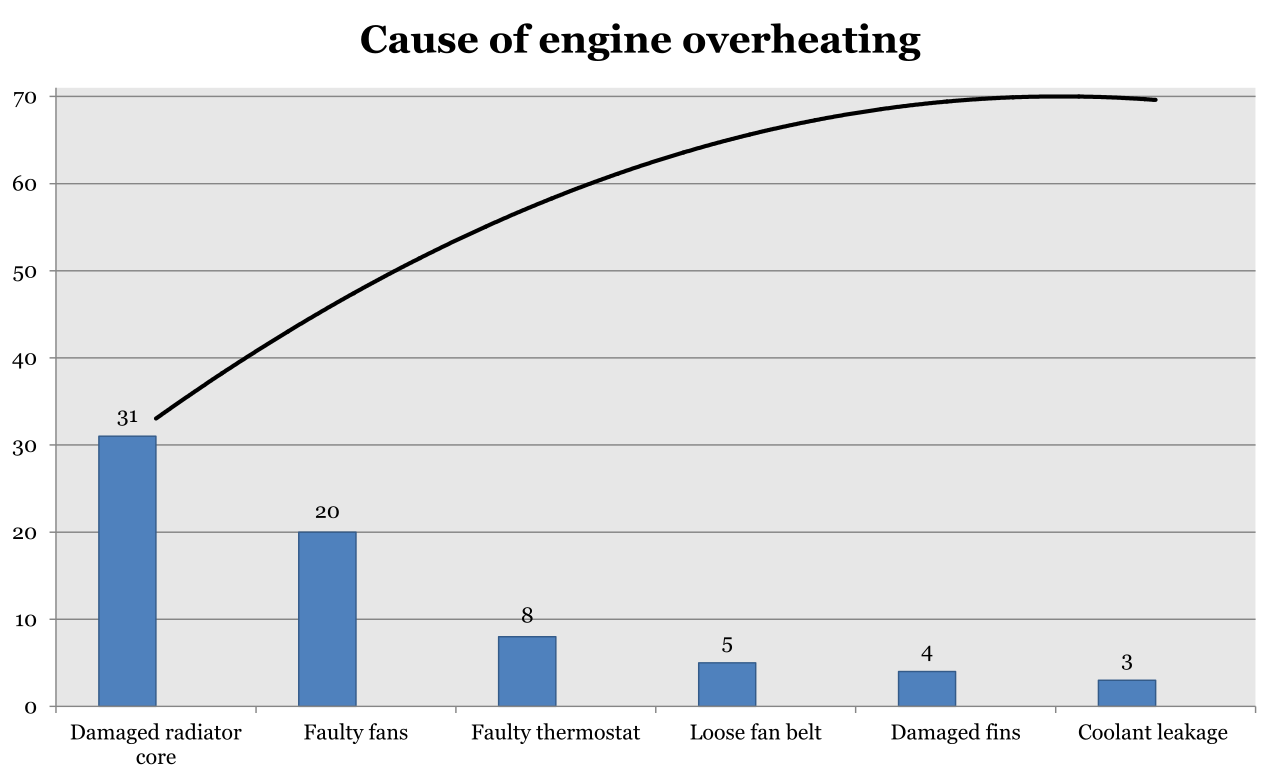
- Pareto charts are a form of vertical bar chart used to identify the vital few sources responsible for the most effects or defects. This is rooted in a fascinating mathematical observation: The Pareto principle states that eighty percent of problems are often due to twenty percent of the underlying causes. Fix the top 20% of the causes, and you eliminate 80% of your headaches.
Measuring Relationships and Frequencies
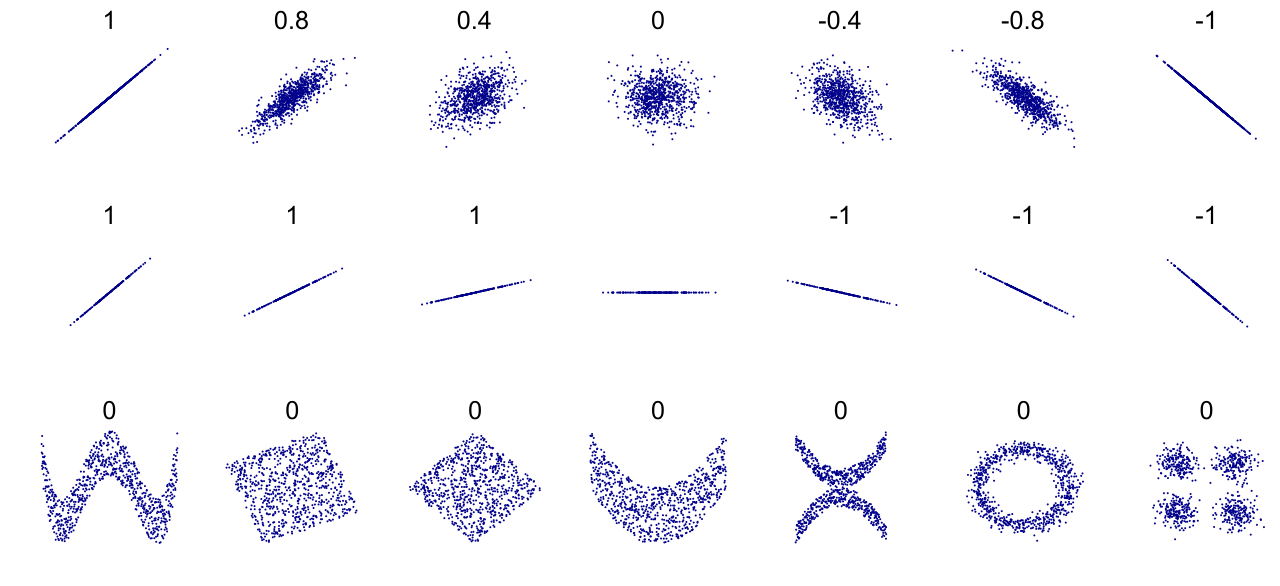
- Scatter diagrams plot data points to show the mathematical relationship between two separate variables. For example, does an increase in factory temperature correlate with an increase in warped steel? Scatter diagrams are used in quality management to determine if a correlation exists between an independent variable and a dependent variable.
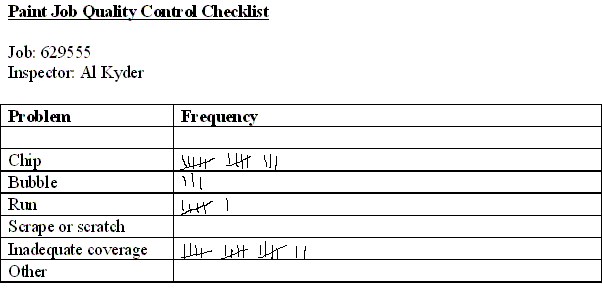
- When you need to gather raw data from the field efficiently, a checksheet is a formatted tally sheet used to systematically gather data on the frequency of a defect or event.
Statistical Sampling and Probability Rules
You do not need to drink an entire pot of soup to know if it needs salt. A single spoonful is enough, provided the soup is well-stirred. This is the essence of sampling. Statistical sampling involves choosing part of a population of interest for inspection instead of inspecting the entire population. Statistical sampling is primarily used when testing is destructive, expensive, or when inspecting the entire population takes too much time.
When analyzing the probabilities of defects in these samples, project managers must understand basic probability rules, such as mutual exclusivity. Mutual exclusivity in quality states that two specific events cannot occur at the exact same time. For instance, a single product unit cannot simultaneously pass the final inspection flawlessly and be categorized as a critical failure.
Quality is not a destination; it is an endless pursuit. Continuous improvement is an ongoing organizational effort to improve products, services, or processes incrementally over time. Over the decades, brilliant engineers have codified this pursuit into specific methodologies.
The PDCA Cycle
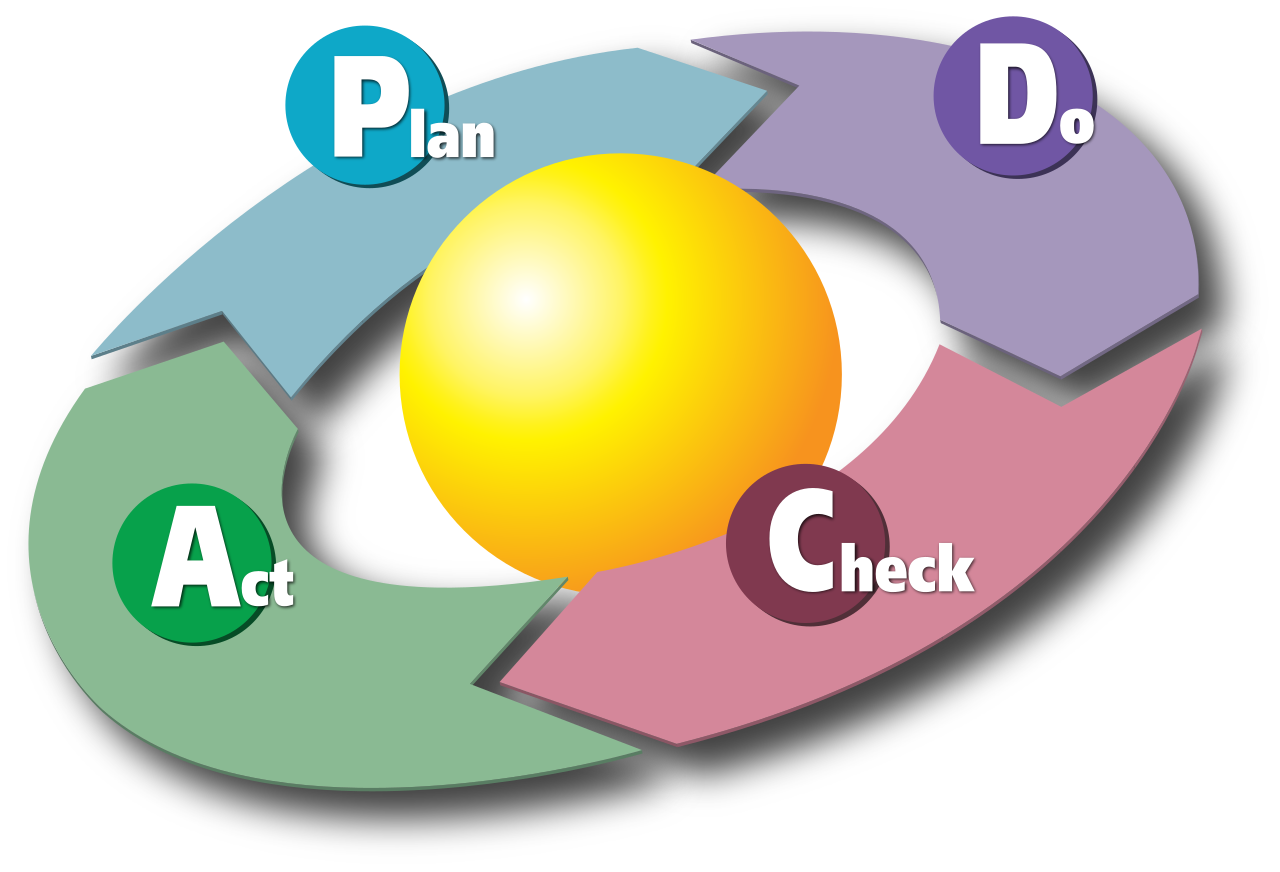
At the heart of continuous improvement is the scientific method applied to management. The Plan-Do-Check-Act cycle is a four-step iterative management method used for the control and continuous improvement of processes. The Plan-Do-Check-Act cycle is alternatively referred to as the Deming cycle or the Shewhart cycle. You plan a change, do a small test, check the results, and act to implement it permanently if successful.
Total Quality Management and Kaizen
Total Quality Management is an organization-wide management approach centered on quality and based on the participation of all members. TQM insists that everyone, from the CEO to the janitor, is responsible for quality.
A closely related concept is Kaizen. Kaizen is a Japanese business philosophy regarding the continuous improvement of working practices and personal efficiency. The Kaizen approach emphasizes making small, incremental changes on a regular basis rather than relying on massive single overhauls.
Six Sigma and Lean
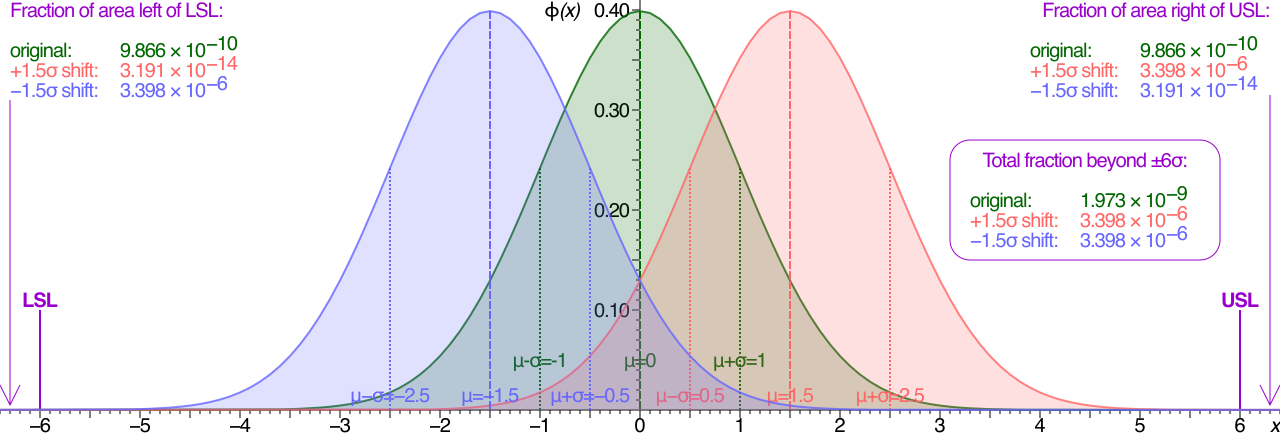
For organizations requiring extreme precision, qualitative philosophy is not enough. Six Sigma is a highly disciplined, data-driven methodology for eliminating defects and improving overall process quality. To achieve a "six sigma" level of stability, the variation must be incredibly tight: The Six Sigma methodology aims for a statistical defect rate of 3.4 defects per one million opportunities.
- To achieve this, practitioners use a rigorous framework. DMAIC stands for Define, Measure, Analyze, Improve, and Control. DMAIC is the core operational problem-solving methodology used to execute Six Sigma continuous improvement projects.
While Six Sigma hunts defects, Lean hunts waste. Lean manufacturing focuses on minimizing waste within production systems while simultaneously maximizing overall productivity. Lean aims to eliminate anything that does not add value to the customer.
- A prime example of Lean in action is the management of inventory. Just-In-Time manufacturing is an inventory strategy intended to increase efficiency and decrease waste by receiving goods only as they are needed. Instead of paying to warehouse thousands of parts, the parts arrive on the exact day they are needed for assembly.
In highly predictive (waterfall) environments, we often see a massive, distinct phase dedicated to quality assurance and testing right before deployment. Agile environments flip this paradigm. If change is constant, testing must be constant.
Agile projects integrate quality activities continuously throughout the lifecycle rather than waiting for a distinct and final quality testing phase. We build quality into the very rhythm of the work.
Built-in Review Mechanisms
- Agile retrospectives act as a built-in mechanism for process evaluation and continuous improvement at the end of every iteration. Instead of waiting for a post-mortem at the end of a year-long project, the team inspects and adapts their workflow every two weeks.
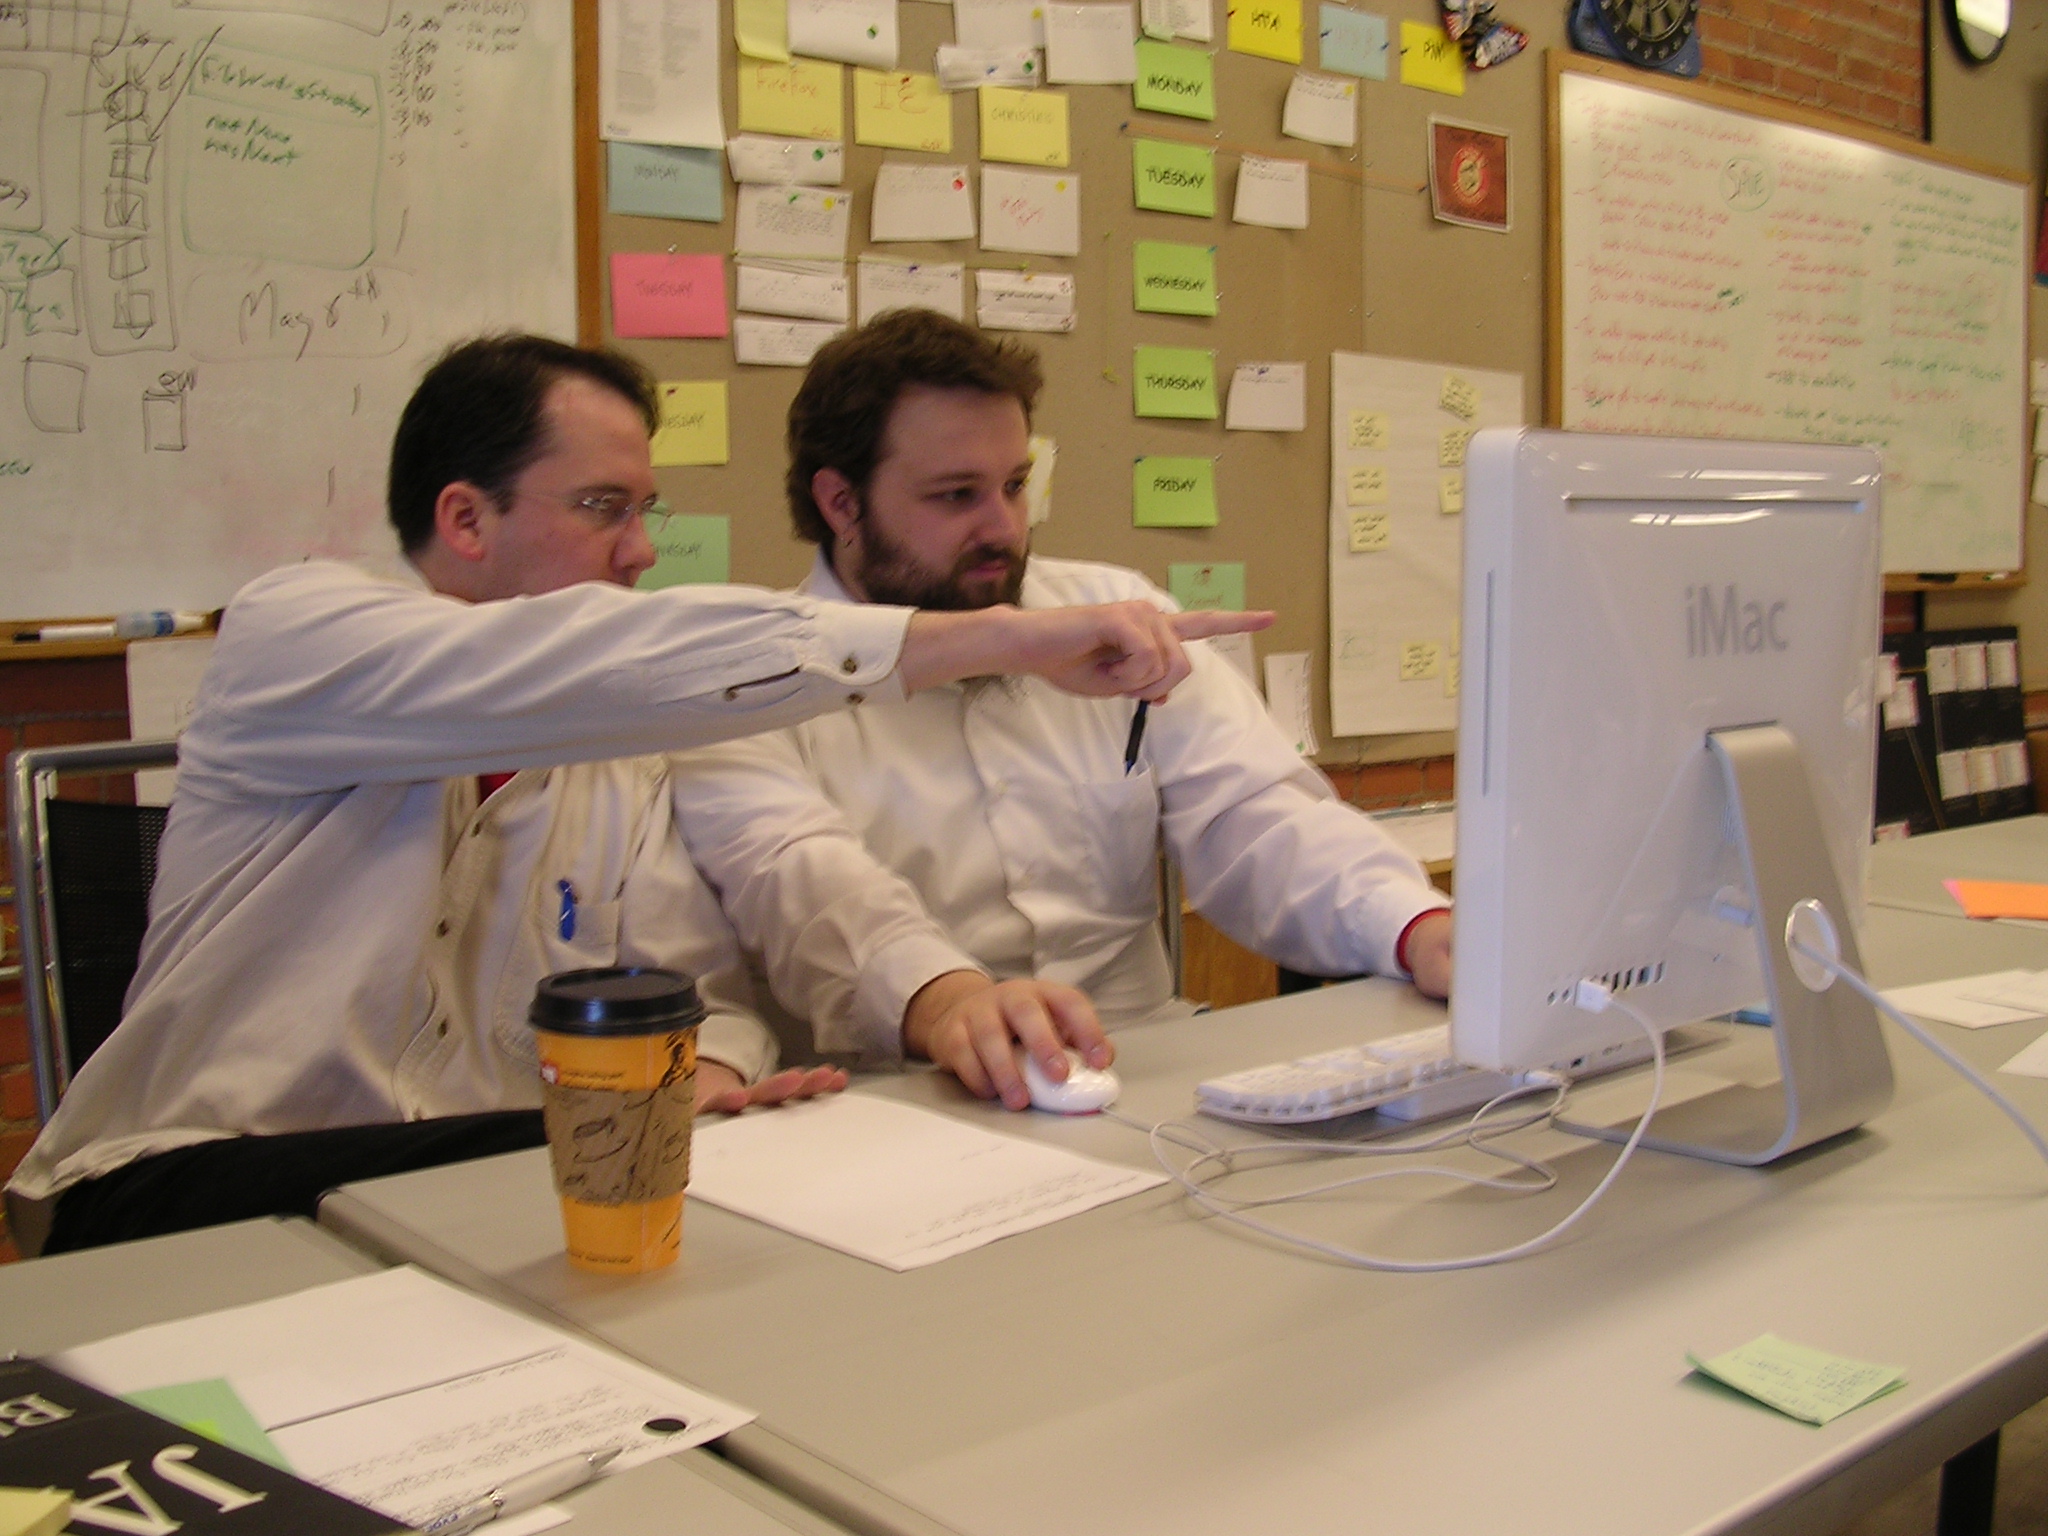
- Code review is not relegated to a separate QA team. Pair programming serves as an ongoing quality review by having one developer write code while another reviews the code simultaneously.
Shifting Testing to the Front
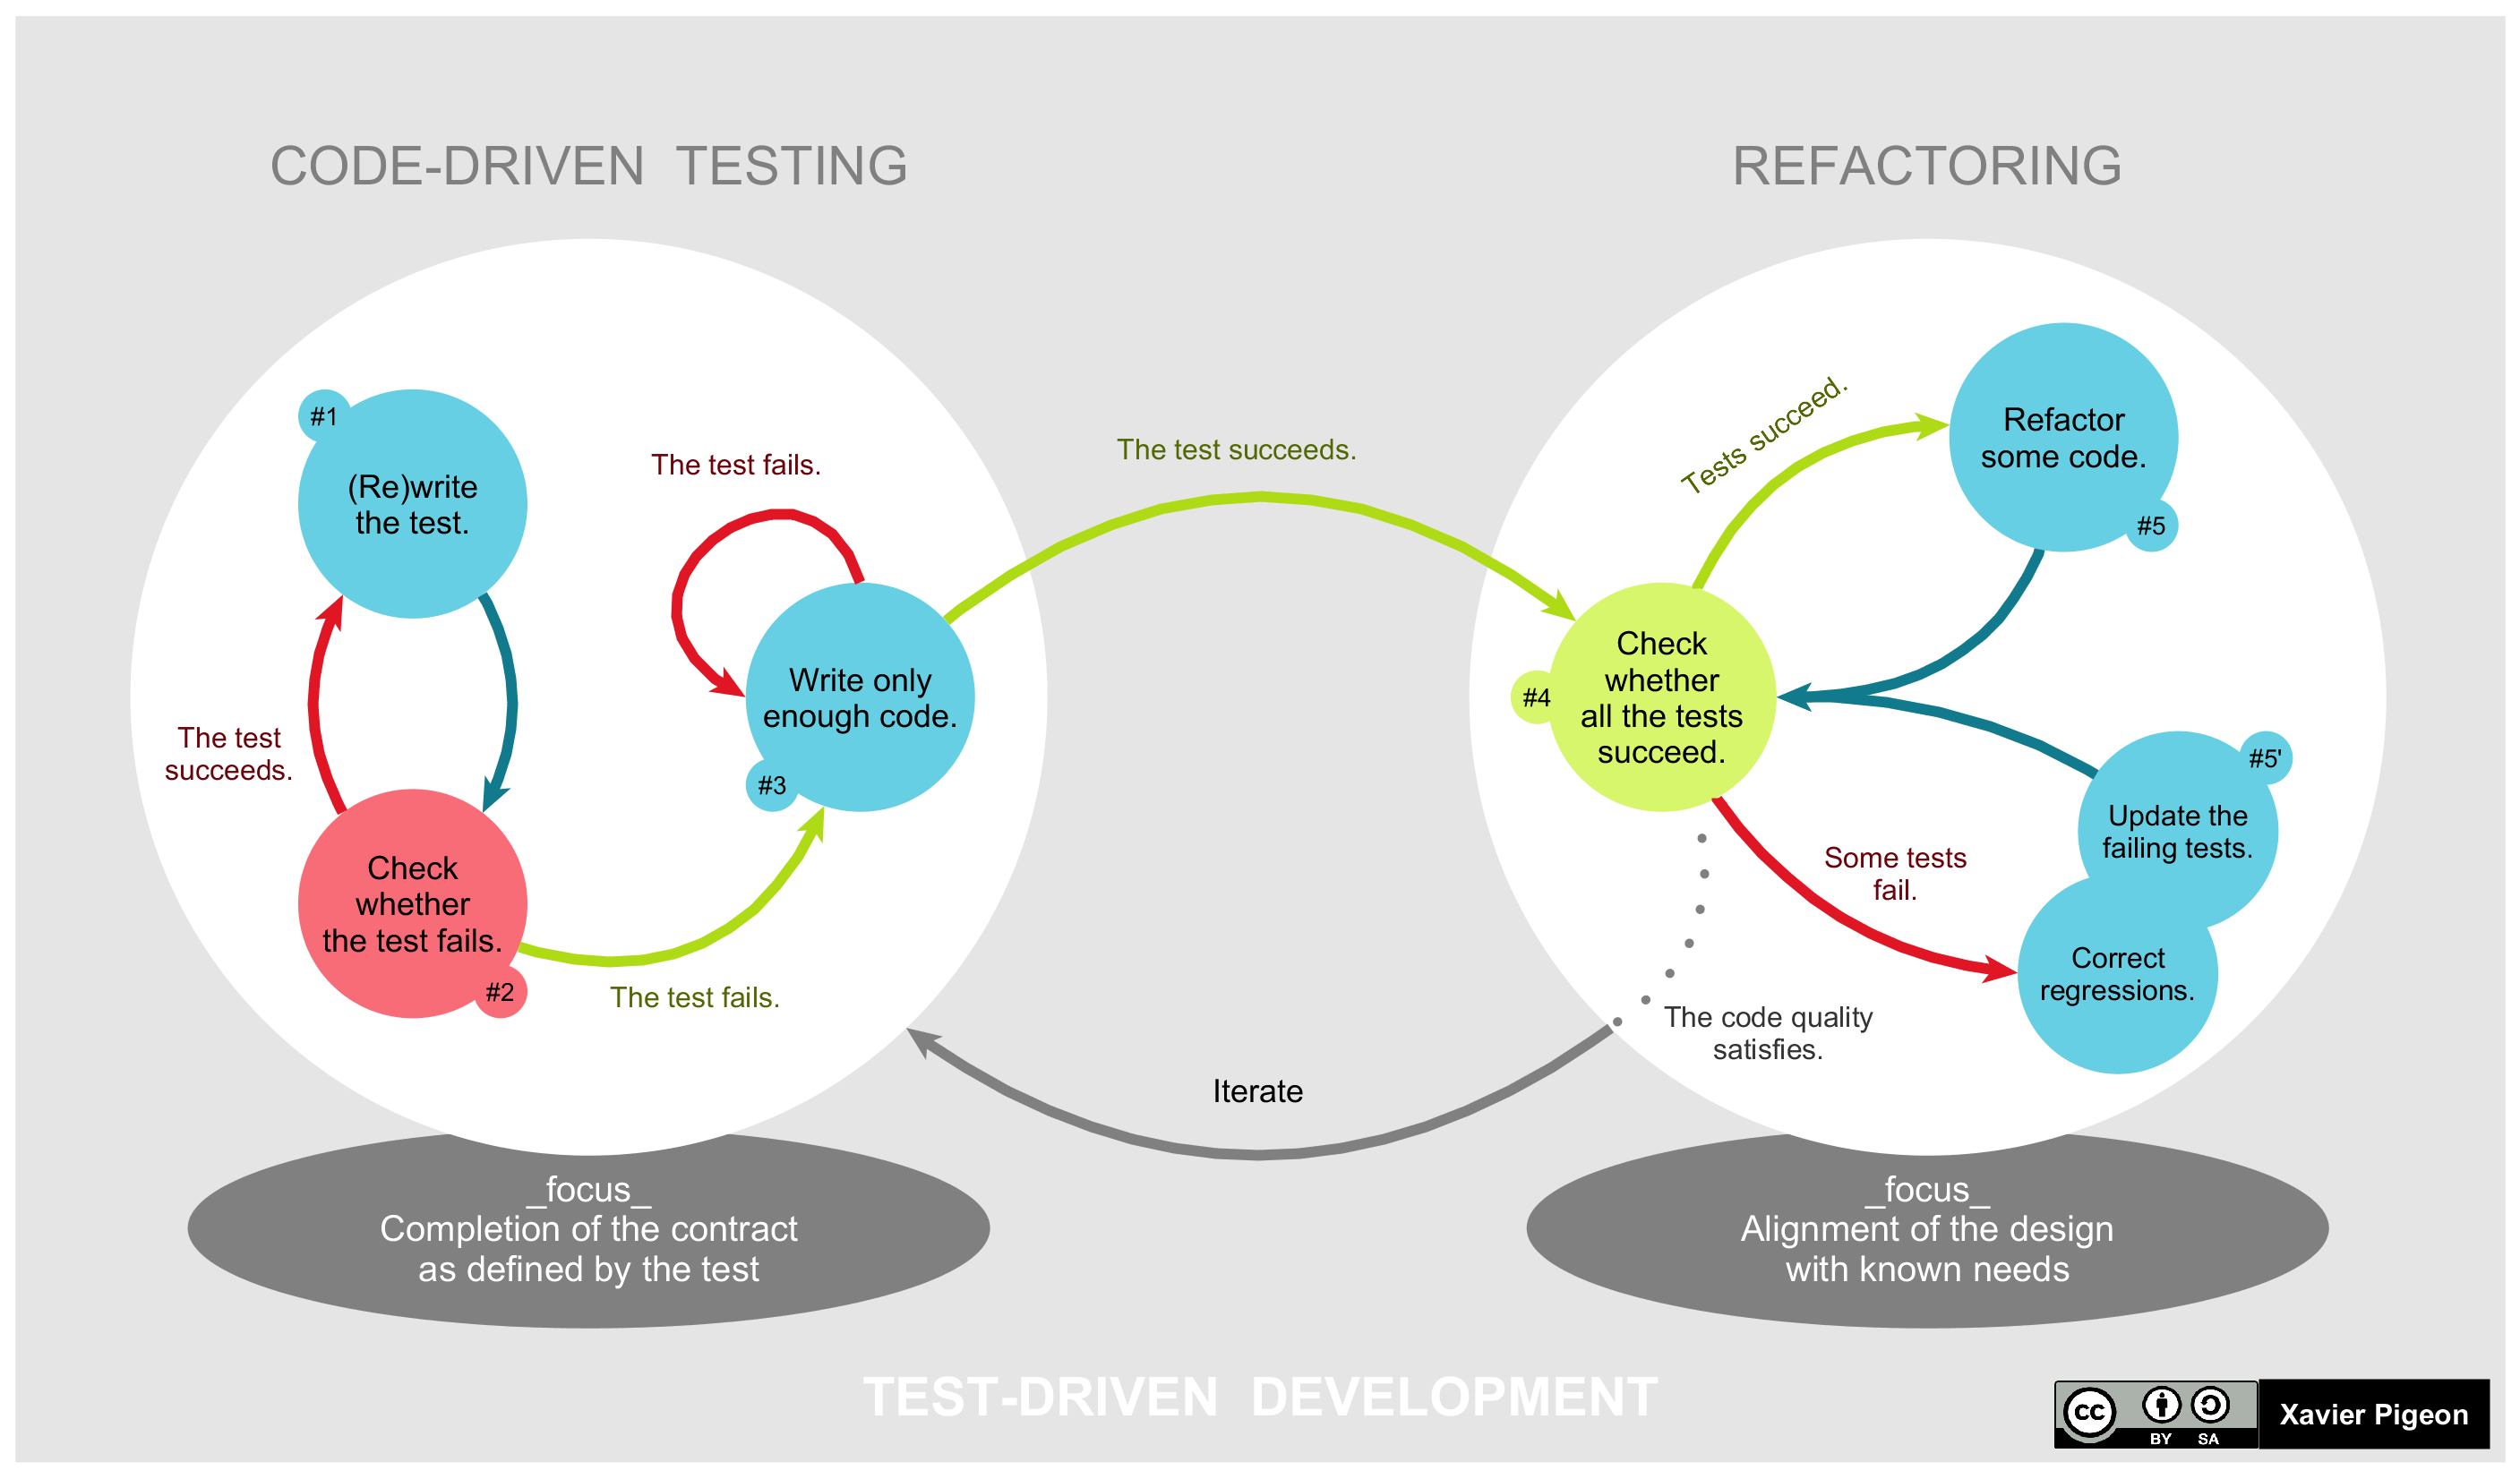
Agile teams do not write a feature and then figure out how to test it. They do the reverse. Test-driven development is an agile practice dictating that automated quality tests must be written before writing the functional code itself. By defining exactly how the code will be verified before a single line is written, the architecture inherently conforms to quality standards.
Defining What "Done" Means
To prevent scope creep and ensure uniform quality, agile teams utilize two critical agreements:
- The Definition of Done establishes the baseline quality criteria a product increment must meet before the increment is officially considered complete. This is a macro-level checklist applied to everything. (e.g., "All code must be peer-reviewed, pass automated testing, and have updated documentation.")
- Acceptance criteria define the specific functional conditions a software feature must satisfy to be accepted by a user or product owner. This is micro-level. (e.g., "For the login feature, the user must be locked out after three failed password attempts.")
Summary
Whether you are plotting a scatter diagram on a factory floor or participating in an agile retrospective, your role as a project manager remains the same. You are the architect of the system. By ruthlessly analyzing the Cost of Quality, distinguishing between the process (Manage Quality) and the product (Control Quality), and deeply embedding a culture of Continuous Improvement, you transform quality from an administrative afterthought into your project's most powerful strategic advantage.