Plan and Optimize Quality: Requirements
Not sure you’re ready?
Take the ~3-minute readiness diagnostic and see where you stand.
Consider the engineering behind a cardiac pacemaker. It lacks a sleek graphical interface, Bluetooth connectivity, or titanium finishes—it is low in technical bells and whistles. Yet, if it functions flawlessly and keeps a patient’s heart beating in perfect rhythm, it is an absolute success. Now consider a luxury vehicle’s state-of-the-art infotainment system, packed with every conceivable feature, that freezes every time the driver attempts to use the GPS. This distinction is the bedrock of project quality management: understanding the vast difference between what a deliverable is supposed to do and how well it actually does it. In professional project management, quality is not a vague, artistic aspiration for excellence; it is a rigorous, quantifiable discipline of fulfilling predefined requirements. Planning and optimizing quality means architecting a system where defects are starved of the oxygen they need to survive, regulatory mandates are treated as uncompromising physical laws, and the exact tools needed to measure success are calibrated before a single line of code is written or a single brick is laid.
To master project quality, we must strip away the colloquial use of the word and adopt its strict technical definition. Quality is the degree to which a set of inherent characteristics of a product or service fulfills project requirements. It is entirely binary: you either met the requirement, or you did not.
Grade, on the other hand, is a category assigned to deliverables that have the same functional use but possess different technical characteristics. The pacemaker is low grade; the luxury infotainment system is high grade.
Understanding the interplay between these two concepts is essential for any project manager:
- A project deliverable can have high quality but a low grade without being considered a failure. A basic, no-frills internal reporting tool that perfectly aggregates data with zero crashes is a massive success.
- A project deliverable with low quality and a high grade is generally considered a problem because it fails to meet core requirements. A complex, feature-rich software application that constantly corrupts user data is a failure, regardless of its impressive feature list.
The Peril of "Over-Delivering" Project managers often feel tempted to impress stakeholders by delivering more than what was asked. This is known as gold plating—the addition of unrequested features or enhancements to a product or deliverable beyond the approved scope. You might think you are doing the customer a favor, but gold plating is strictly prohibited in professional project management because it introduces undocumented risks, delays, and unapproved costs. Deliver exactly what was requested, to the exact standard required. Nothing more, nothing less.
The modern discipline of quality management rests on the shoulders of several foundational thinkers whose theories dictate how we plan our projects today:
-
Joseph Juran defined quality management practically, framing it simply as "fitness for use by the customer." If the customer cannot use it for its intended purpose, it lacks quality.
-
Philip Crosby shifted the economic perspective of the discipline. He developed the Zero Defects quality theory, which boldly asserts that "quality is free." Crosby proved that the money spent on doing things right the first time is always less than the cost of fixing failures later.
-
W. Edwards Deming popularized the Plan-Do-Check-Act (PDCA) cycle, creating a sustainable loop for continuous process improvement.
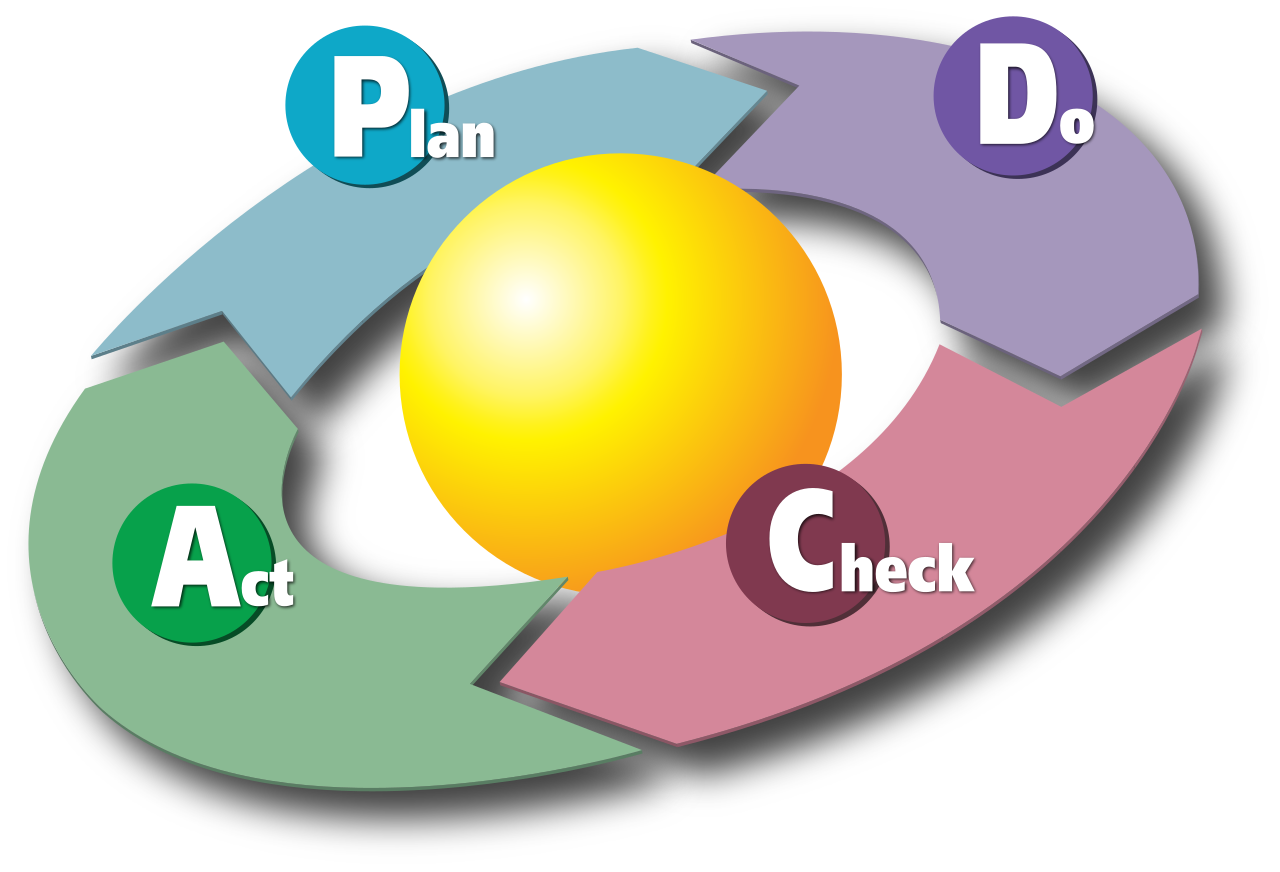
The Plan-Do-Check-Act (PDCA) cycle establishes a continuous loop for process improvement. Source: PDCA Cycle by Karn-b - Karn Bulsuk ( http://www.bulsuk.com ). Originally published at http://www.bulsuk.com/2009/02/taking-first-step-with-pdca.html, CC BY 4.0. -
Kaoru Ishikawa developed the fishbone diagram (also known as the Ishikawa or cause-and-effect diagram), which remains the premier visual tool used for root cause analysis in quality management.
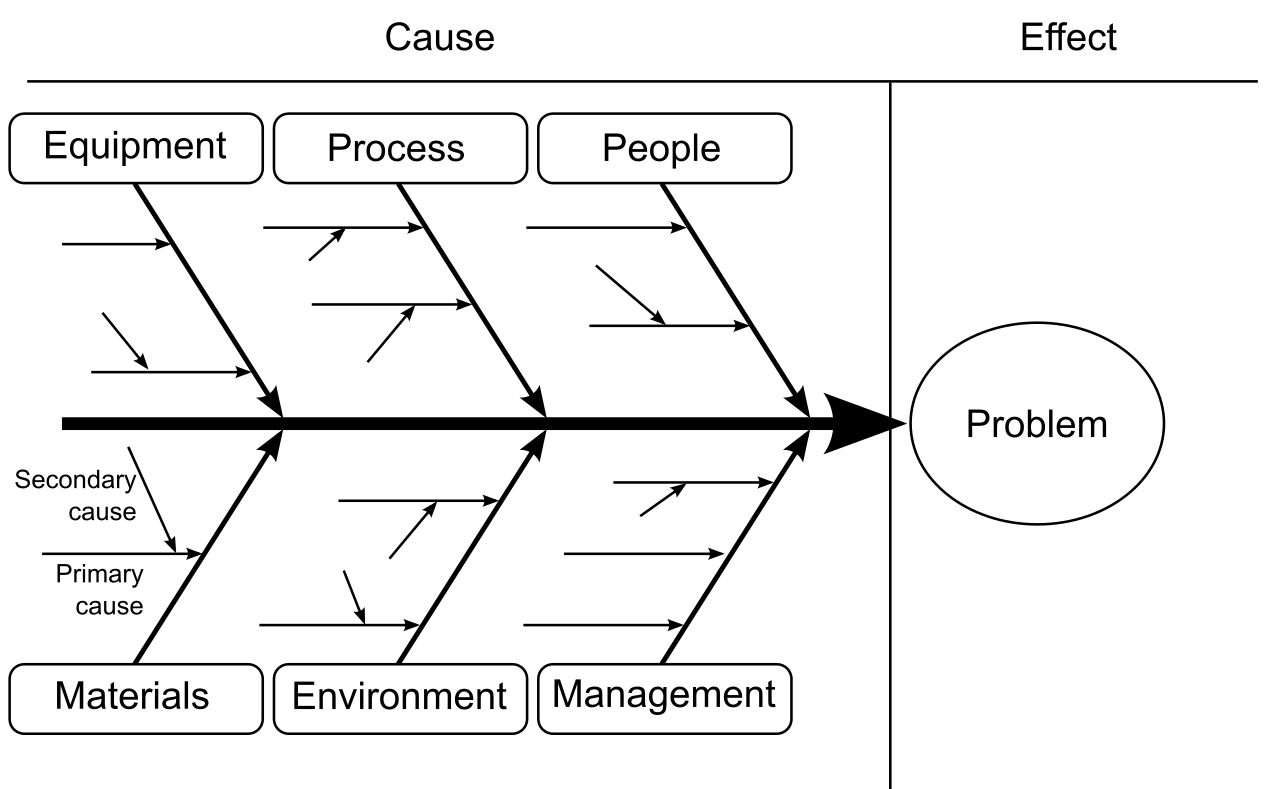
An Ishikawa, or fishbone, diagram categorizes potential causes of a problem to help identify its root cause. Source: Ishikawa Fishbone Diagram by FabianLange at de.wikipedia, CC BY-SA 3.0.
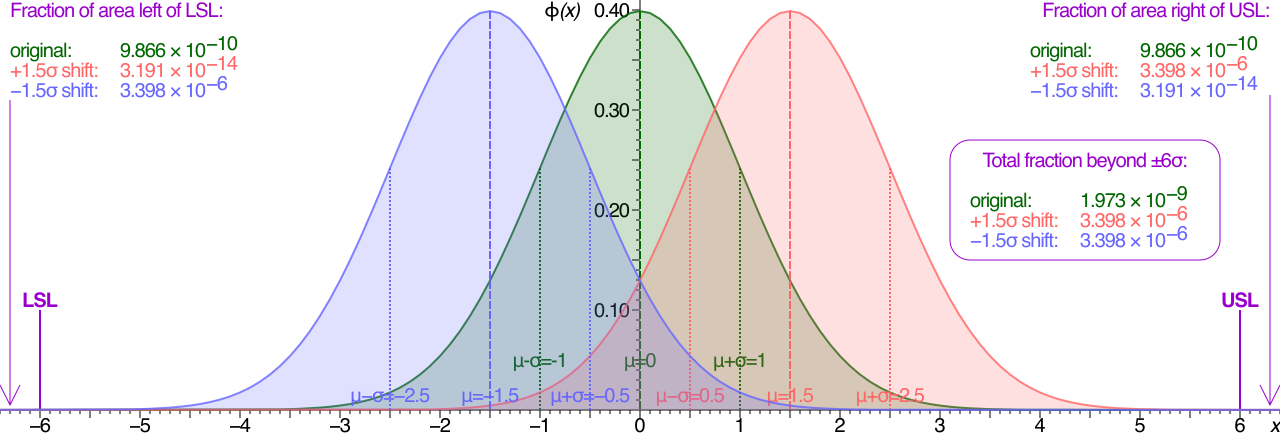
These philosophies evolved into powerful modern frameworks. Lean, for example, is a quality management approach focused entirely on eliminating waste from the production process. A primary component of Lean is Just-in-Time manufacturing, an inventory strategy that decreases waste by receiving goods only precisely as they are needed, minimizing storage costs and reducing the risk of material degradation. Conversely, Six Sigma is a quality methodology striving for a standard of no more than 3.4 defects per million opportunities, heavily relying on statistical analysis to minimize variation.
The Plan Quality Management process identifies the specific quality requirements and standards for the project and its deliverables. Crucially, this process should be performed in parallel with other planning processes to ensure schedule and cost plans accommodate quality needs. You cannot finalize a schedule or budget until you know the rigorousness of the testing required.
The primary output of this process is the Quality Management Plan, which documents how the project team will demonstrate compliance with identified quality requirements.
At the heart of this plan is a philosophical shift from reaction to anticipation:
- Prevention is the proactive act of keeping errors out of the project process.
- Inspection is the reactive act of keeping errors out of the hands of the customer.
Prevention is vastly superior. Inspection means the defect has already occurred; you are just trying to catch it before it escapes the building. Prevention means engineering the environment so the defect mathematically cannot happen.
The Mandate of Regulatory Compliance
You do not build a bridge or release a pharmaceutical drug based merely on what the sponsor wants; you build it to the laws of the land. Regulatory compliance requirements mandate that project deliverables meet specific governmental, legal, or industry standards.
It is the project manager's fiduciary duty to ensure these rules are met. Regulatory compliance checks must be explicitly integrated into the quality management plan to avoid legal penalties and ensure safety. If a regulatory check is missed, the project fails, regardless of budget or schedule performance.
How do we prove to a sponsor that Crosby was right and "quality is free"? We use the Cost of Quality (COQ) framework. Cost of Quality includes all costs incurred over the life of a product by investing in preventing nonconformance to requirements, appraising a product or service for conformance to requirements, and failing to meet project requirements.
To justify these costs, project managers use a cost-benefit analysis for quality planning, which compares the cost of a quality step to the expected financial benefit of executing that step.
We divide COQ into two main categories: the Cost of Conformance (money spent to avoid failures) and the Cost of Nonconformance (money spent because of failures).
| Category | Type | Definition & Examples |
|---|---|---|
| Cost of Conformance | Prevention costs | Costs incurred to keep defects out. These include training, document processes, equipment upgrades, and time spent doing the work right the first time. |
| Cost of Conformance | Appraisal costs | Costs incurred to measure the work. These include product testing, destructive testing loss, and formal inspections to assess quality. |
| Cost of Nonconformance | Internal failure costs | Occur when a defect is caught by the project team before the product reaches the customer. These primarily consist of rework and scrapped materials. |
| Cost of Nonconformance | External failure costs | Occur when a defect is discovered by the customer after the product is delivered. These are the most dangerous and include legal liabilities, warranty work, and lost future business. |
To effectively build the Quality Management Plan, project managers utilize specific analytical tools:
-
Benchmarking: This technique compares actual or planned project practices to those of comparable projects to identify best practices. Why reinvent the wheel when another organization has already perfected the axle?
-
Flowcharts: These are visual representations of a process that help project teams anticipate where quality problems might occur. By mapping the process step-by-step, bottlenecks and error-prone handoffs become obvious.
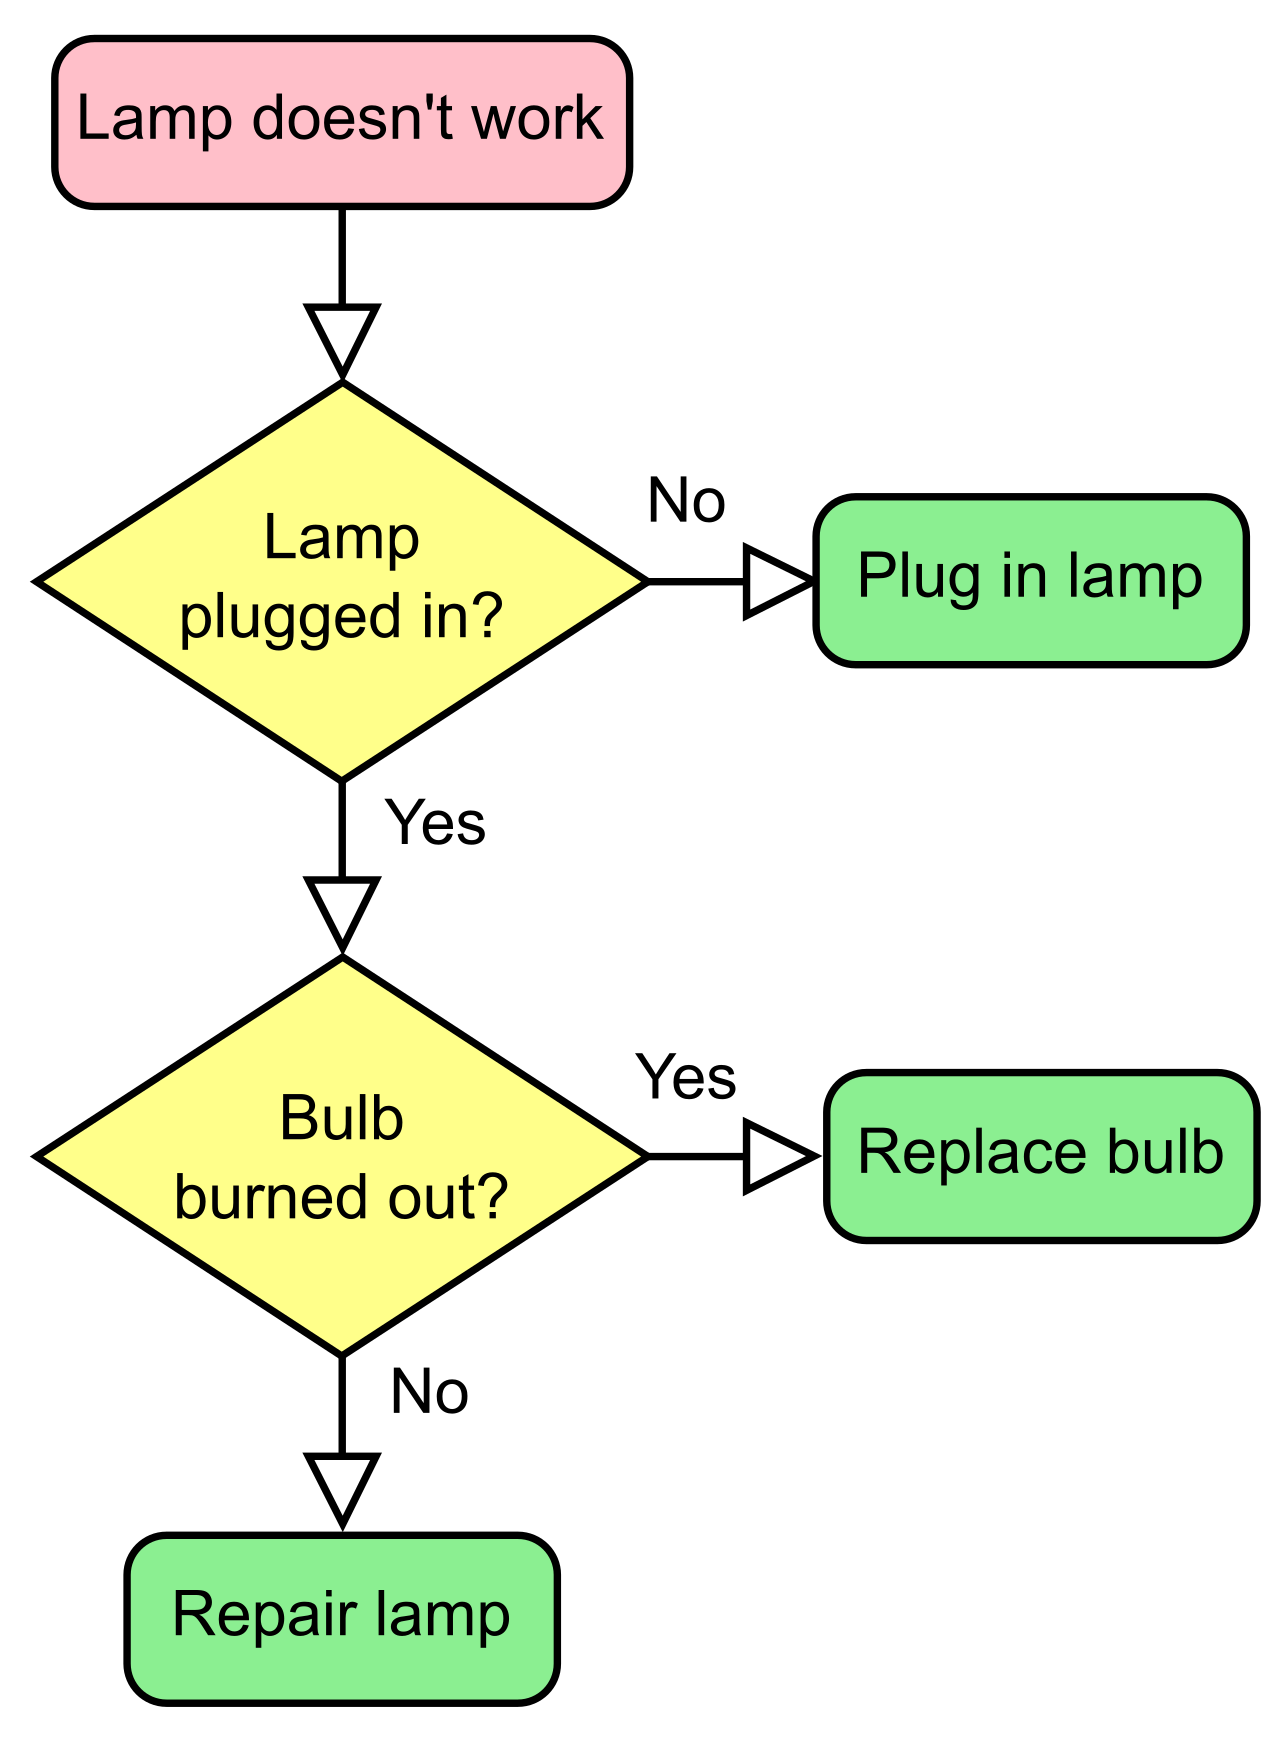
A flowchart visually maps out a process step-by-step, helping project teams anticipate bottlenecks and locate where quality failures might occur. Source: LampFlowchart by svg by Booyabazooka original png by Wapcaplet, CC BY-SA 3.0. -
Logical data models: In IT and data-heavy projects, these provide a visual representation of an organization's data to identify where data integrity issues may arise during project execution.
-
Matrix diagrams: These help project managers analyze the strength of relationships among different factors, causes, and objectives during quality planning.
-
Test and inspection planning: This involves explicitly determining how the project team will verify the product to meet the goals for its performance and reliability.
Ultimately, these tools help define a quality metric, which describes a specific project or product attribute and defines exactly how the control quality process will measure that attribute. "Fast response time" is a vague wish; "system responds to user query within 200 milliseconds" is a quality metric.
When evaluating deliverables, project managers must understand statistical principles to separate signal from noise.
First, understand how we sample the data:
- Attribute sampling determines whether a specific project result conforms to the defined quality standard or fails to conform. It is binary—pass or fail, yes or no. (e.g., Does the door lock click into place?)
- Variable sampling measures the degree of conformity of a project result on a continuous quantitative scale. (e.g., How much does this manufactured beam weigh? What is the exact temperature of the server room?)
Next, understand the boundaries of acceptability:
-
Tolerances represent the specified range of acceptable results for a given quality metric. Tolerances are dictated by the customer's requirements.
-
Control limits identify the statistical boundaries of common variation in a stable process. Control limits are dictated by the mathematics of your production system. If a process exceeds control limits, it is out of control, even if it hasn't breached the customer's tolerances yet.
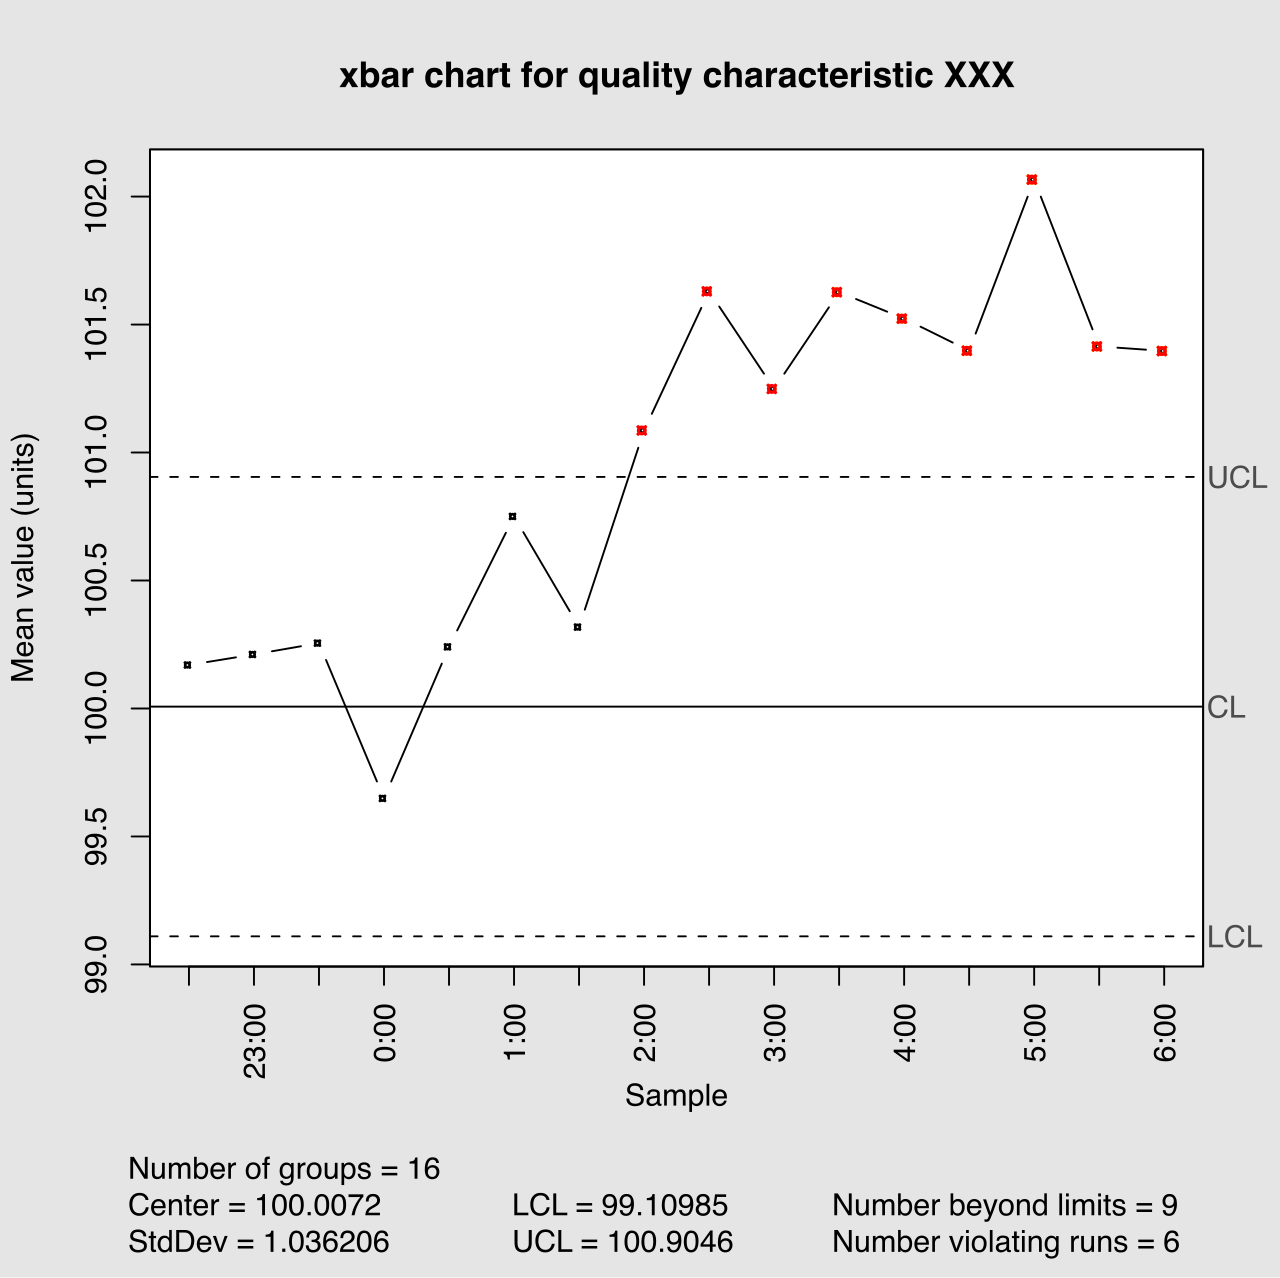
A control chart mapping process variation. If a data point consistently exceeds the upper or lower control limits, the process is considered statistically out of control and requires investigation. Source: Xbar chart for a paired xbar and s chart by DanielPenfield, CC BY-SA 3.0.
Finally, we apply laws of probability when predicting defects:
- Mutual exclusivity means two events cannot occur at the exact same time in quality probability assessments. A coin flip is heads or tails; it cannot be both.
- Statistical independence means the occurrence of one event does not affect the mathematical probability of another event occurring. Rolling a six on a die does not change the probability of rolling a six on your next turn.
In traditional predictive (Waterfall) projects, quality testing often happens in a dedicated phase near the end of the project lifecycle. This creates a massive risk: if a foundational flaw is discovered in month ten of a twelve-month project, the cost of rework is astronomical.
Agile frameworks solve this by pulling quality to the absolute forefront of the process.
Built-in quality in Agile ensures that quality standards are addressed continuously during development rather than in a distinct testing phase at the end. Quality is not a "phase"—it is a continuous state of being.
How does Agile achieve this?
-
Definition of Done (DoD): In Agile methodologies, quality requirements are often explicitly embedded within the Definition of Done. The Definition of Done ensures all Agile team members share a unified understanding of what it means for work to be complete and ready for release. If the code isn't peer-reviewed, documented, and passing all automated tests, it isn't "Done"—even if it seemingly works.
-
Test-Driven Development (TDD): This is an Agile quality practice where automated test cases are written before the functional code is developed. By writing the test first, developers are forced to write code explicitly designed to pass the exact quality requirement.
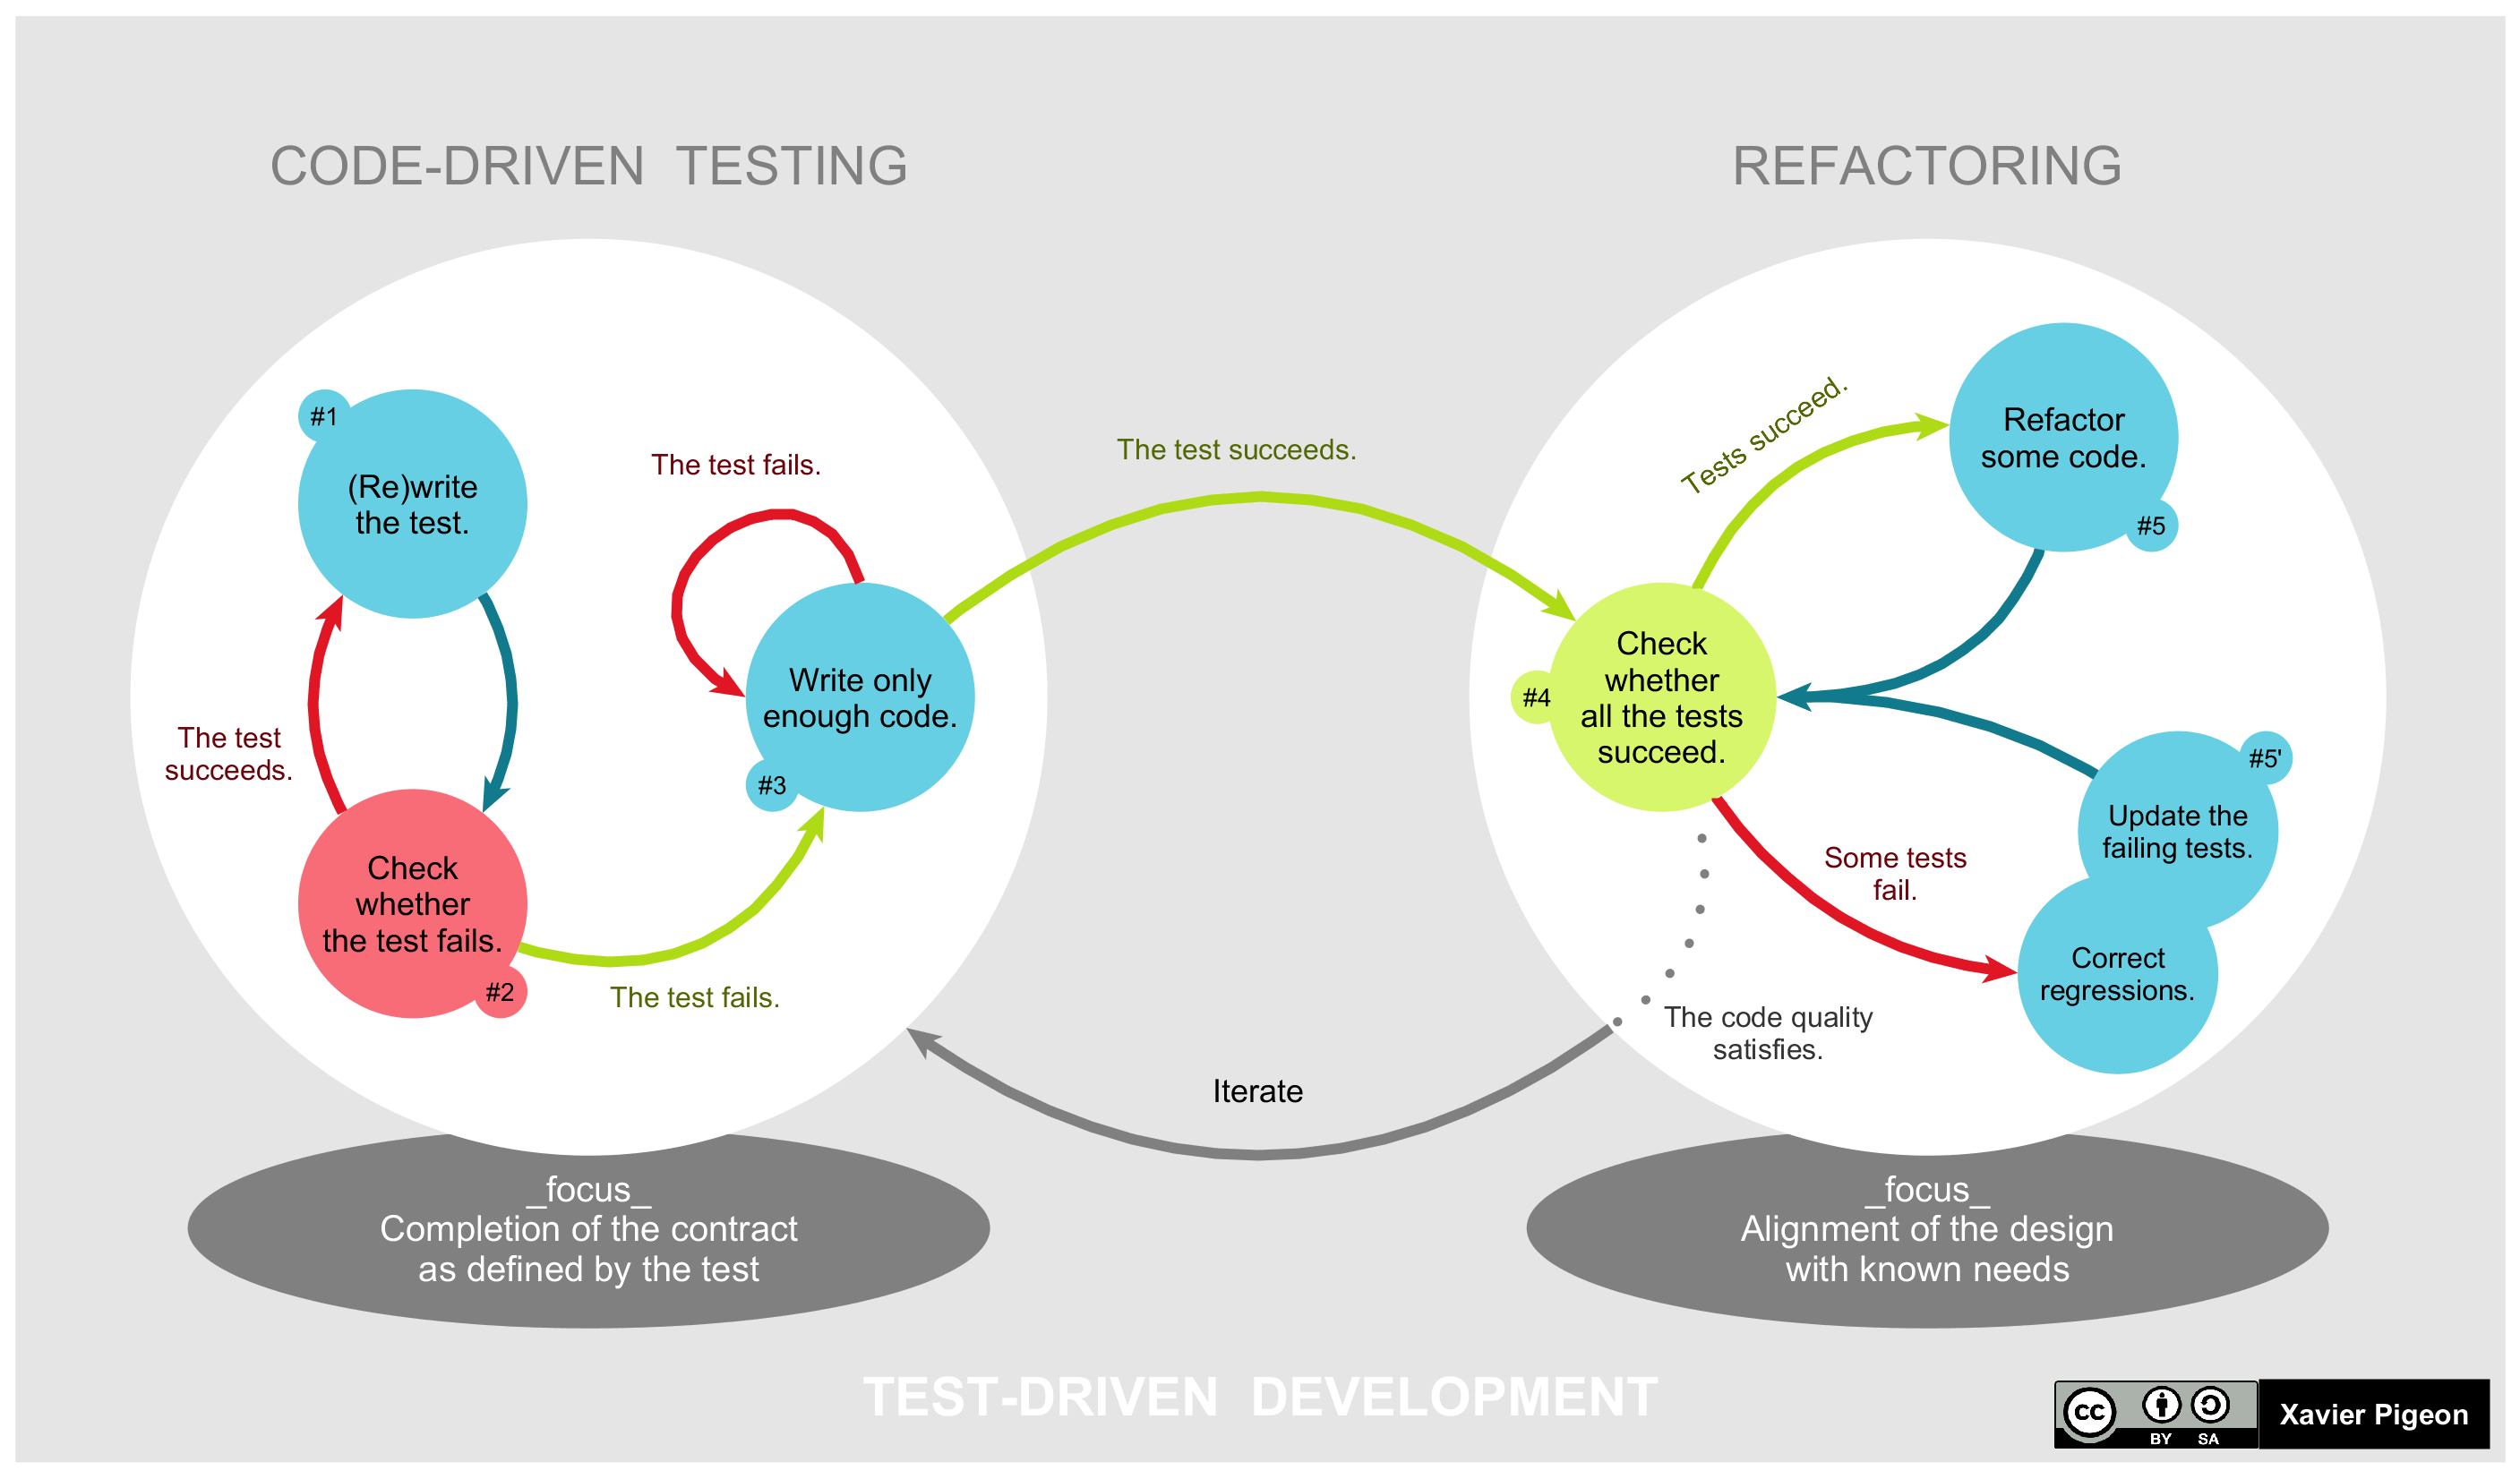
The Test-Driven Development (TDD) lifecycle requires developers to write a failing automated test before developing the minimal code needed to pass it. Source: TDD Global Lifecycle by Xarawn, CC BY-SA 4.0. -
Continuous Integration (CI): This is an Agile practice that frequently merges developer code to detect integration errors early in the cycle. By compiling everyone's code multiple times a day, conflicts are caught while they are small, rather than letting them fester into system-breaking catastrophes.
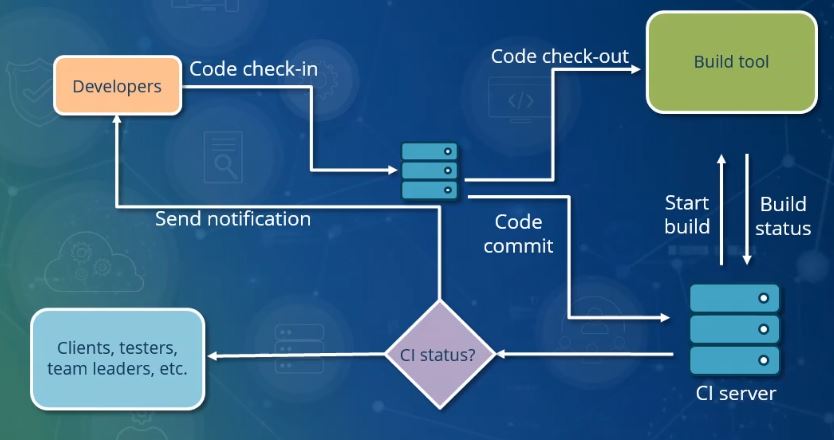
Continuous Integration (CI) automatically merges and tests developer code changes, identifying integration conflicts early in the cycle. Source: Continuous Integration by Pratik89Roy, CC BY-SA 4.0. -
Continuous Improvement: Agile projects utilize frequent retrospectives to continuously adjust and improve quality processes throughout the project lifecycle. The team doesn't wait for a "lessons learned" document at project closure; they inspect and adapt their quality practices every single iteration.
By establishing rigorous standards, leveraging statistical measurement, and integrating quality into the day-to-day habits of the team—whether through predictive Quality Management Plans or Agile built-in practices—project managers ensure that their final deliverables are not merely completed, but are functionally, legally, and mathematically fit for use.