Business and International Economic Factors
The global economy is a massive, interconnected machine of production, consumption, and capital allocation. As a securities professional, your mandate is to translate the rumblings of this machine into actionable reality for investors. A stock price does not exist in a vacuum; it is tethered to the fundamental health of the issuing corporation, which in turn is swept along by national economic cycles and international trade currents. Understanding these macroeconomic and microeconomic factors is not merely an academic exercise—it is the lens through which you will interpret market news, evaluate risk, and ultimately guide client capital.
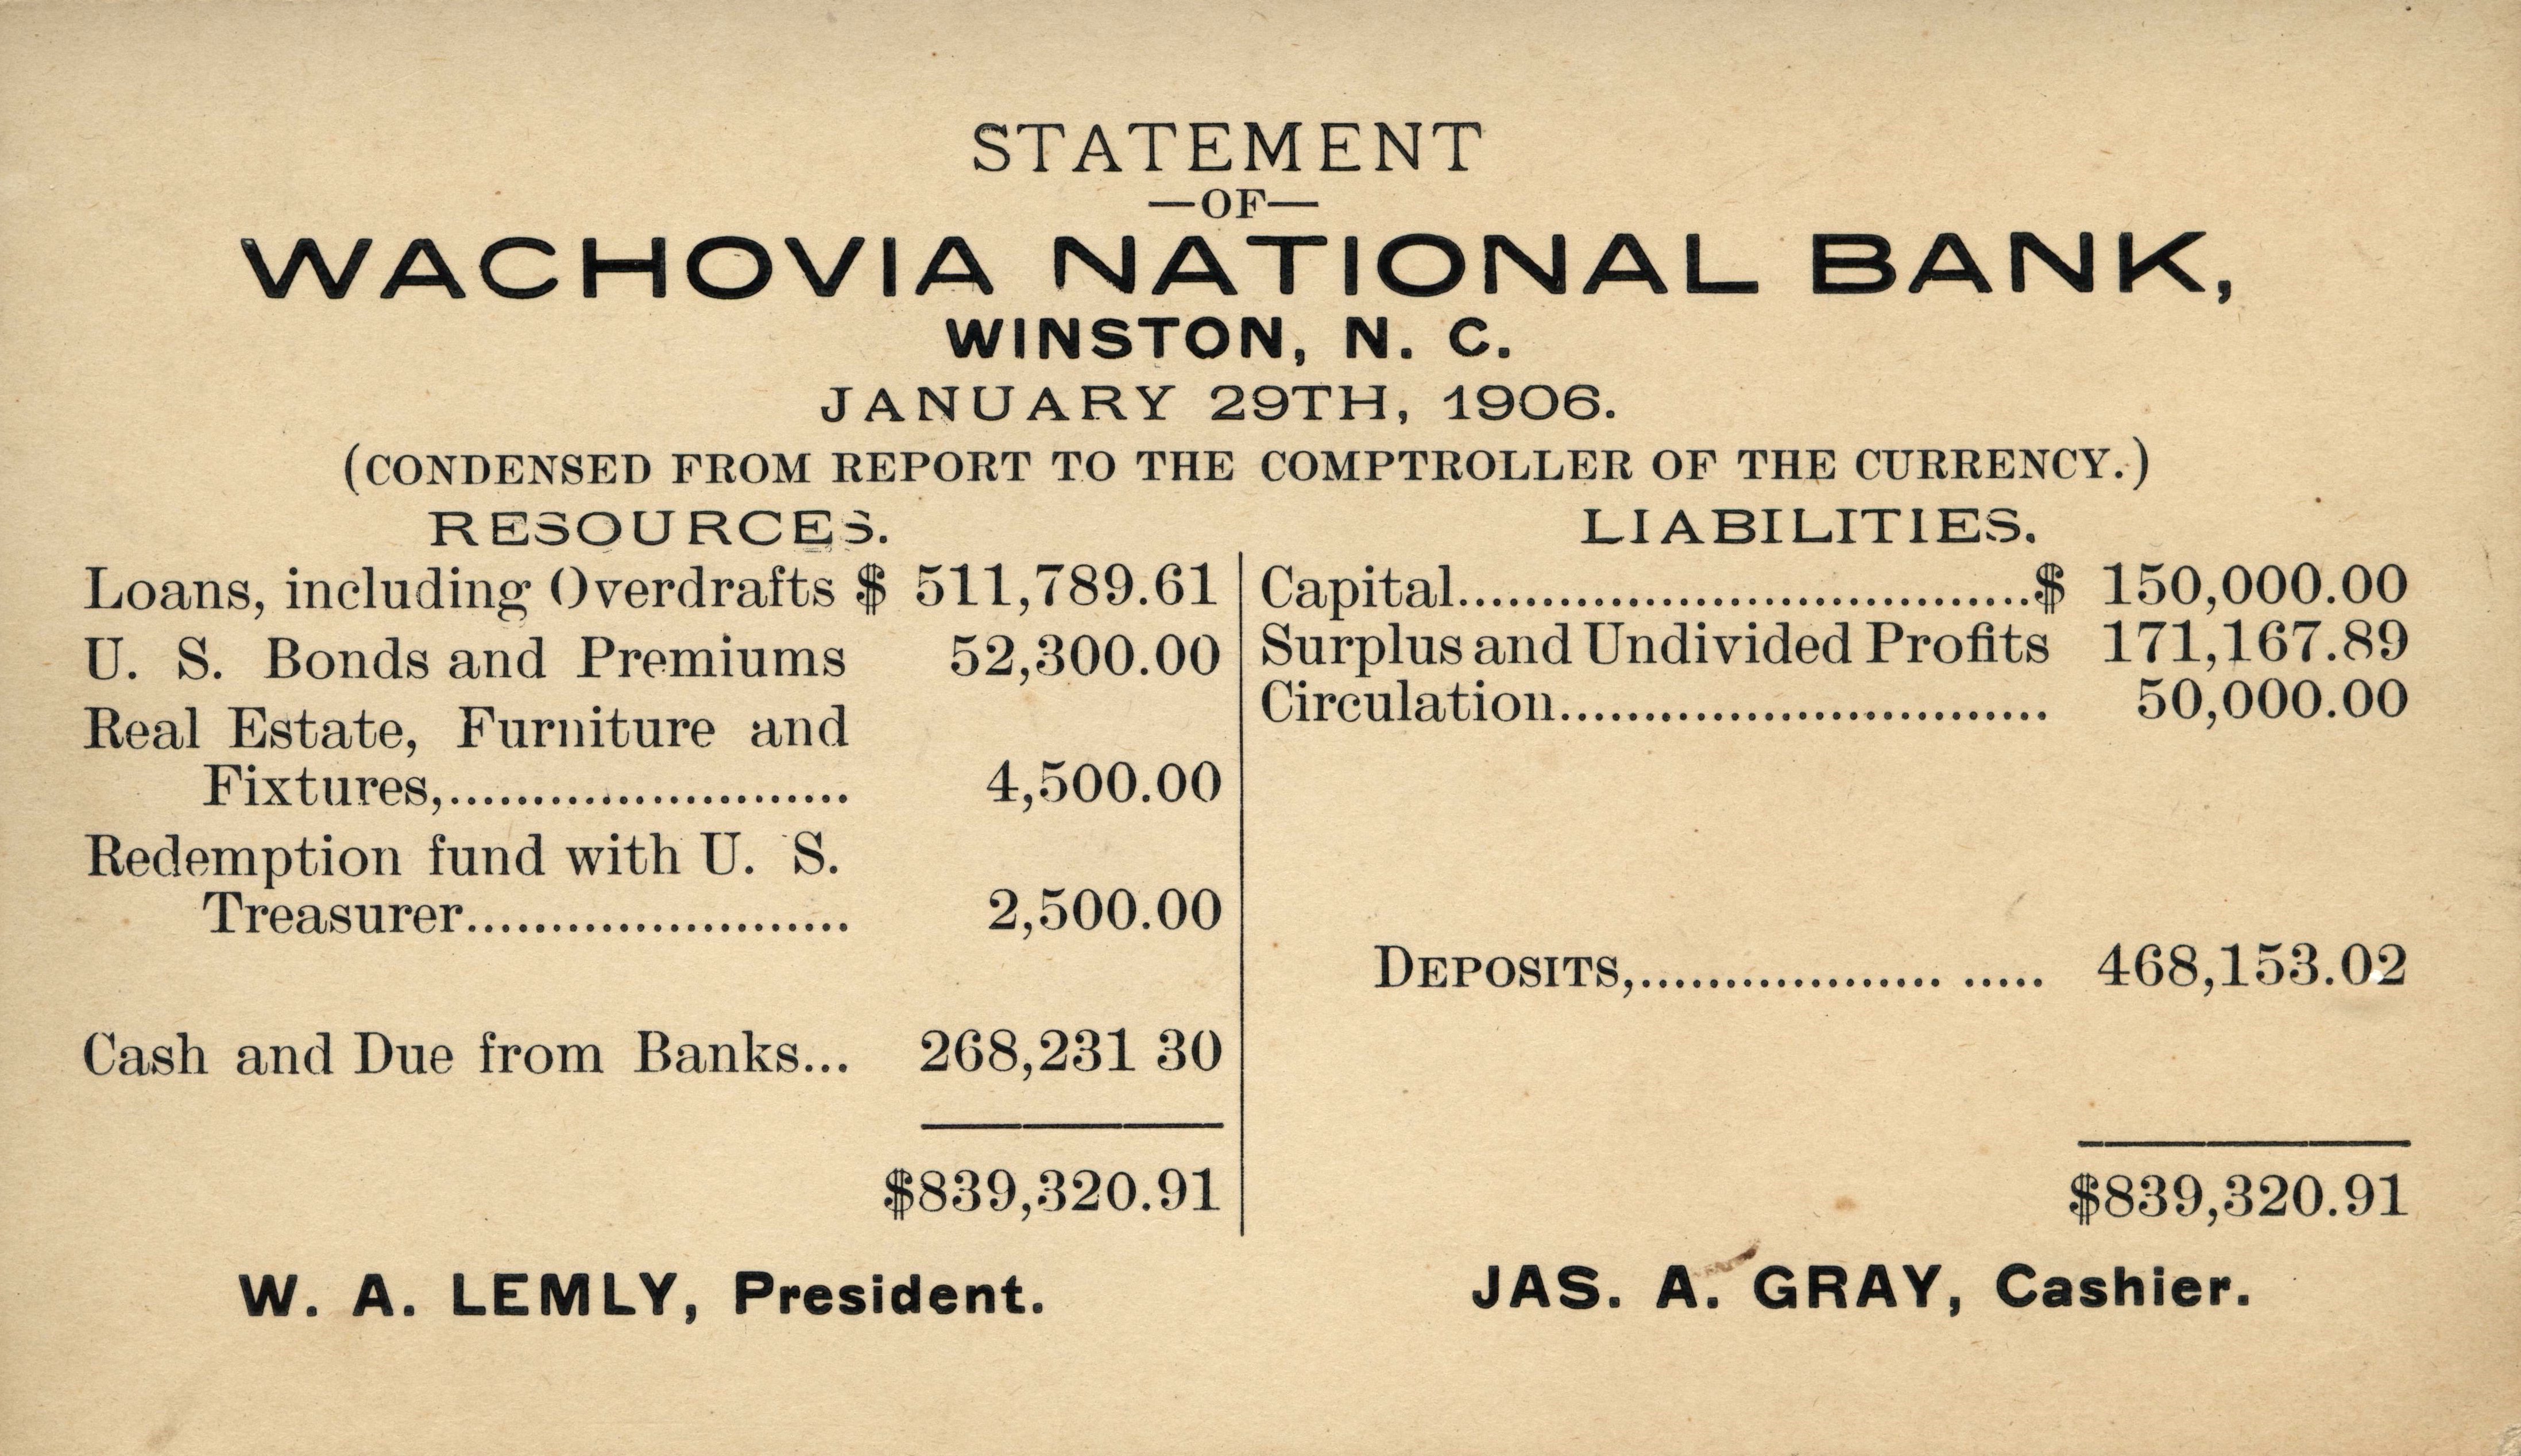
Before analyzing the broader economy, we must be able to measure the fundamental unit of capitalism: the corporation. To understand a company's financial health, analysts rely on three primary financial statements. Think of these documents as the medical charts of a business.
The Balance Sheet
A corporate balance sheet provides a snapshot of a company's financial position at a specific point in time. It freezes the business on a single day (like December 31st) and tallies up what it owns and what it owes.
The entire document rests on a single mathematical fulcrum, known as the fundamental balance sheet equation:
Total Assets = Total Liabilities + Shareholders' Equity
If a company buys a new $10 million factory (an asset), it must have paid for it by either taking on debt (a liability) or using investors' money (shareholders' equity). The scale must always balance.
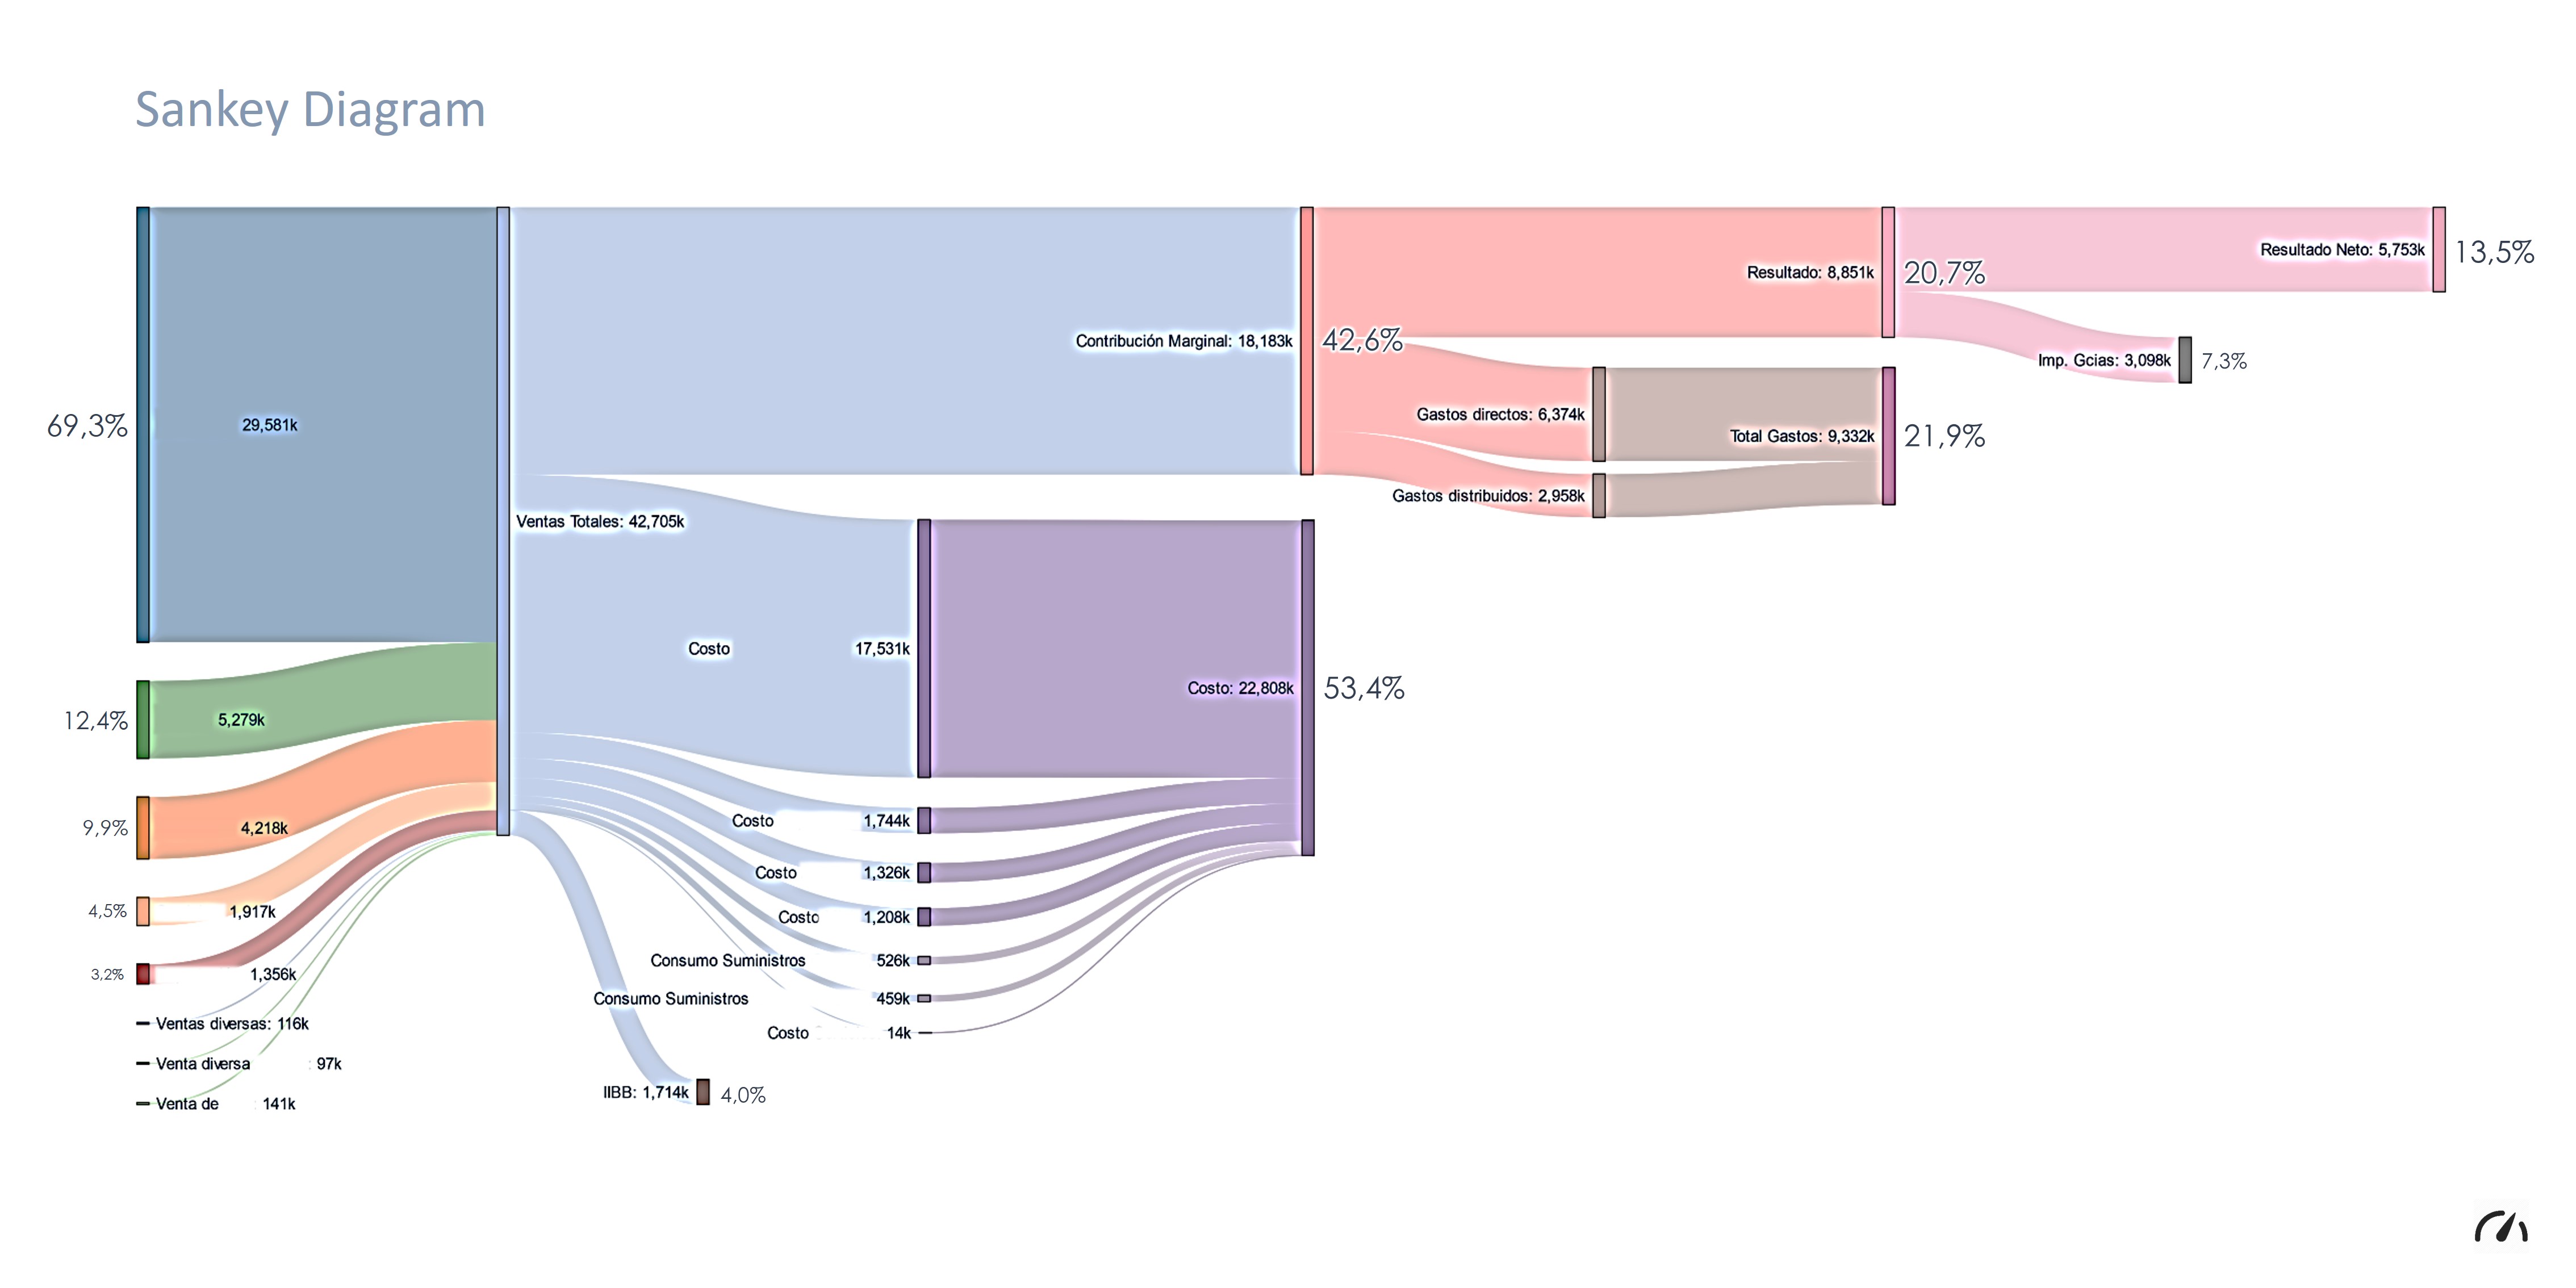
The Income Statement
If the balance sheet is a photograph, the corporate income statement is a video. It reports a company's revenues and expenses over a specific accounting period (such as a quarter or a full fiscal year).
This document reveals whether the company's core operations are actually profitable. An income statement calculates a company's net income by subtracting total expenses from total revenues. This "bottom line" is the figure most closely watched by investors.
The Statement of Cash Flows
Profits on an income statement can sometimes be obscured by accounting rules, but cash is physical reality. A statement of cash flows tracks the actual inflow and outflow of cash from three distinct areas:
- Operating activities: Cash generated from the day-to-day business.
- Investing activities: Cash spent on or generated from buying/selling assets like real estate or equipment.
- Financing activities: Cash moving between the company and its investors or creditors (like issuing bonds or paying dividends).
Zooming out from individual companies, we find that the broader economy behaves much like a living organism. It breathes in and out. The business cycle consists of four distinct sequential phases that dictate the rhythm of the financial markets.
The four phases of the business cycle are expansion, peak, contraction, and trough.
1. Expansion
An economic expansion is a period of overall economic growth and increasing industrial production. Businesses are thriving, factories are outputting more goods, and consumers are spending. Because companies are busy, they hire more workers; consequently, during an economic expansion, national unemployment rates generally fall. Simultaneously, the Gross Domestic Product (the total value of the economy's output) generally rises.
2. Peak
Eventually, the engine runs as fast as it possibly can. A peak represents the highest point of economic output within a single business cycle. At this stage, demand outpaces supply. Because everyone is trying to buy goods and hire workers, prices surge. Therefore, inflation often reaches its highest levels during the peak phase of a business cycle.
3. Contraction
Following the peak, the economy begins to cool down. An economic contraction is a period of declining economic activity and falling industrial production. Companies realize they have over-expanded and begin to pull back. During an economic contraction, the Gross Domestic Product generally falls, and as businesses lay off workers, national unemployment rates generally rise.
When a contraction becomes severe, economists apply specific terminology based on the duration of the decline:
Recession: Defined by economists as two consecutive quarters (six months) of declining Gross Domestic Product. Depression: Defined as a severe economic downturn lasting for at least six consecutive quarters (18 months).
4. Trough
The bleeding eventually stops. A trough represents the lowest point of economic output within a single business cycle. It is the absolute bottom of the contraction phase. However, a trough is also a turning point. Economic recovery and expansion begin immediately following the trough phase of a business cycle, starting the four-part sequence all over again.
How do economists and traders know where we are in the business cycle? They look at the dashboard. Economic indicators are statistical metrics used by analysts to measure the overall health of the economy.
These metrics are classified into three categories based on when they change direction relative to the overall economy.
Leading Indicators
Leading economic indicators change direction before the broader economy changes direction. Economists use leading economic indicators to predict future economic trends. Think of these as the economy's headlights.
- The S&P 500 Index: The stock market looks forward. Investors buy stocks based on what they think companies will earn in the future, making the stock market a classic leading indicator.
- Building permits for new private housing: Before a house is built, a permit must be pulled. A surge in permits today predicts an expansion in construction jobs and material purchases tomorrow.
- Initial weekly claims for unemployment insurance: The moment companies start facing trouble, they lay off workers. A spike in first-time unemployment claims hints at an impending contraction.
- M2 Money Supply: An increase in the money supply (cash, checking deposits, and easily convertible near-money) provides the fuel for future consumer spending and inflation.
Coincident Indicators
Coincident economic indicators change direction at approximately the same time as the broader economy. Economists use coincident economic indicators to measure the current state of the economy. These are the economy's speedometer.
- Gross Domestic Product (GDP): This is the literal measure of the economy right now.
- Industrial production: Measures current output of factories and mines.
- Non-agricultural employment levels: The current number of people employed outside of farming.
- Personal income levels: The amount of money currently flowing into consumers' pockets.
Lagging Indicators
Lagging economic indicators change direction after the broader economy has already changed direction. Economists use lagging economic indicators to confirm long-term economic trends. These are the economy's rearview mirror.
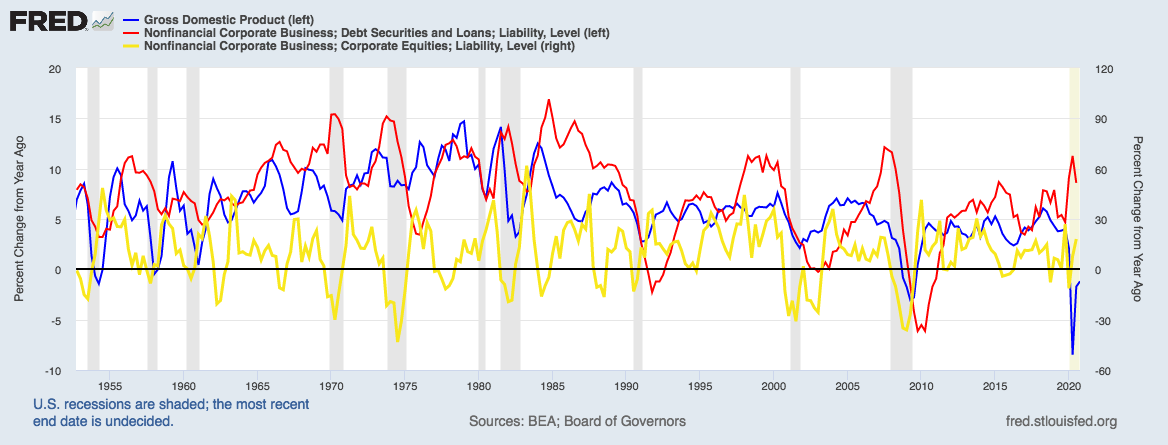
- Corporate profits: You only know how much money a corporation made after the quarter has ended and the accountants have tallied the books.
- Average duration of unemployment: It takes months of economic recovery before the chronically unemployed finally secure jobs.
- The prime interest rate charged by banks: Banks adjust their prime lending rates in response to past inflation and central bank policies.
- Ratio of consumer credit to personal income: Consumers only rack up heavy credit card debt relative to their income toward the end of an expansion, and they take a long time to pay it down during a contraction.
| Indicator Type | Timing vs. Economy | Primary Purpose | Key Examples |
|---|---|---|---|
| Leading | Changes before | Predict future trends | S&P 500, Building Permits, Initial Jobless Claims, M2 |
| Coincident | Changes simultaneously | Measure current state | GDP, Industrial Production, Non-Ag Employment, Personal Income |
| Lagging | Changes after | Confirm long-term trends | Corporate Profits, Prime Rate, Avg Duration of Unemployment |
A nation's economy is not a closed loop. Money, goods, and services constantly cross physical borders, creating a complex web of international trade.
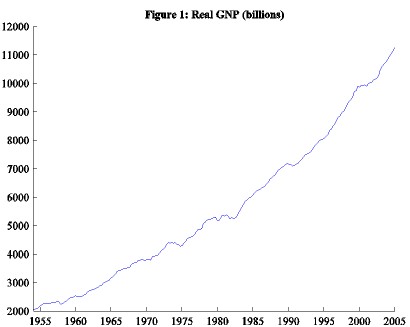
Measuring National Output: GDP vs. GNP
You will frequently see two acronyms used to describe a nation's economic output: GDP and GNP. The difference lies in geography versus citizenship.
Gross Domestic Product (GDP) measures the total value of all finished goods and services produced within a country's physical borders. It does not care who owns the factory, only where the factory is located. Therefore, GDP includes the domestic output of foreign-owned companies operating within the country (e.g., a Japanese automaker's factory located in Ohio).
Gross National Product (GNP) measures the total value of all finished goods and services produced by a country's citizens, regardless of where in the world that production takes place. GNP includes the output of a country's citizens and domestic corporations operating in foreign countries (e.g., an American tech company manufacturing phones in Vietnam). Conversely, GNP excludes the domestic output of foreign citizens operating within the country.
International Trade and Balance of Payments
To keep track of money moving in and out of the country, economists use a massive ledger. The balance of payments tracks all financial transactions between a country's residents and the rest of the world.
The most visible component of this ledger is the exchange of physical goods and services.
- Trade Deficit: Occurs when a country imports more goods and services than the country exports. (More money is flowing out to buy foreign goods than is coming in from selling domestic goods).
- Trade Surplus: Occurs when a country exports more goods and services than the country imports. (More money is flowing in).

Exchange Rates and the Currency Seesaw
When an American company sells a tractor to a French farmer, the farmer has euros, but the American company wants U.S. dollars. This requires a currency conversion. Exchange rates represent the value of one nation's currency relative to the currency of another nation.
Currency values fluctuate constantly, and these fluctuations have profound impacts on international trade. It operates like a seesaw: what is good for consumers is often bad for exporters, and vice versa.
The Impact of a Strong United States Dollar: When the U.S. dollar is "strong," it buys a larger amount of foreign currency.
- For consumers: A strong United States dollar makes foreign imported goods cheaper for United States consumers. A $50 bottle of Italian wine might suddenly cost $40.
- For exporters: A strong United States dollar makes United States exported goods more expensive for foreign consumers. Our American tractor now costs the French farmer more euros to purchase.
- The Net Effect: Because imports are cheap and exports are expensive, a strong United States dollar typically leads to an increase in United States imports and a decrease in United States exports.
The Impact of a Weak United States Dollar: When the U.S. dollar is "weak," it buys a smaller amount of foreign currency.
- For consumers: A weak United States dollar makes foreign imported goods more expensive for United States consumers.
- For exporters: A weak United States dollar makes United States exported goods cheaper for foreign consumers. American manufacturing becomes highly competitive on the global market.
- The Net Effect: Because imports are expensive and exports are highly attractive to foreign buyers, a weak United States dollar typically leads to an increase in United States exports and a decrease in United States imports.
As a registered representative, grasping this dynamic is vital. If a client is heavily invested in U.S. multinational corporations that derive most of their revenue from selling goods in Europe and Asia, a historically strong U.S. dollar may threaten those companies' profits, while a weak dollar might serve as a massive tailwind.