Proportional Relationships and Percents
Not sure you’re ready?
Take the ~3-minute readiness diagnostic and see where you stand.
To mix a precise chemical solution or blend a specific shade of pigment, one relies on a fundamental mathematical architecture. Three parts blue to two parts red is not merely an instruction; it is a declaration of a relationship that scales precisely, whether you are filling a thimble or an industrial vat. This underlying structure is the domain of proportional reasoning—a framework that governs everything from the velocity of a falling object to the interest accumulating in a bank account. By mastering how quantities interact in predictable harmony, we uncover the predictable rules that dictate both natural phenomena and human commerce.
At its core, a ratio is a mathematical comparison of two quantities indicating how many times one value contains or is contained within the other. It is a relational statement. If a classroom has 15 girls and 10 boys, the ratio of girls to boys is fundamentally a measure of how those two distinct populations relate.
Mathematically, we are not constrained to a single syntax. Ratios possess a fluidity in how they can be written:
- Ratios can be expressed using a colon (e.g., 3:4).
- Ratios can be expressed using the word "to" (e.g., 3 to 4).
- Ratios can be expressed as a fraction (e.g., 43).
Because of this fractional relationship, the ratio "3 to 4" is mathematically equivalent to the fraction 3/4. This equivalence is deeply profound because it allows us to apply the entirety of fractional arithmetic to relational logic.
When you scale a recipe up or down, you are relying on equivalent ratios, which are ratios expressing the identical relationship between two quantities. You can endlessly generate these by manipulating the values simultaneously:
- Multiplying both terms of a ratio by the same non-zero number produces an equivalent ratio. (e.g., multiplying 3:4 by 2 gives 6:8).
- Dividing both terms of a ratio by the same non-zero number produces an equivalent ratio. (e.g., dividing 6:8 by 2 returns us to 3:4).
A ratio becomes significantly more interesting when the objects being compared are of entirely different species. A rate is a special type of ratio comparing two quantities with different units of measure. We do not merely compare apples to apples; we compare miles to hours, dollars to pounds, or heartbeats to minutes.
To make sense of rates in everyday life, we usually distill them down to a base metric. A unit rate is a rate in which the second quantity in the comparison is exactly one unit. If you travel 120 miles in 2 hours, the raw rate is $120 \text{ miles} / 2 \text{ hours}$. But how fast are you going in a single hour?
To calculate a unit rate from a general rate, divide the first quantity by the second quantity.
Dividing 120 by 2 yields 60. Your unit rate is 60 miles per 1 hour.
This concept powers consumer economics through a specific application: the unit price, which is a specific type of unit rate measuring the cost of one single item or unit of measure. When a grocery store lists coffee at $12.00 for 3 pounds, dividing $12.00 by 3 provides a unit price of $4.00 per pound.
When we take two equivalent ratios and place an equals sign between them, we build a new mathematical structure. A proportion is an algebraic equation stating that two distinct ratios are equal (e.g., 43=2015).
Two quantities hold a proportional relationship if the ratio of one quantity to the other remains constant. Imagine stretching a rubber band: the relationship between the force applied and the distance stretched remains constant. We call this fixed anchor the constant of proportionality, which is defined mathematically as the constant ratio of the dependent variable to the independent variable (y/x).
This relationship gives birth to a foundational linear equation: y=kx In the linear equation y=kx, the variable k represents the constant of proportionality.
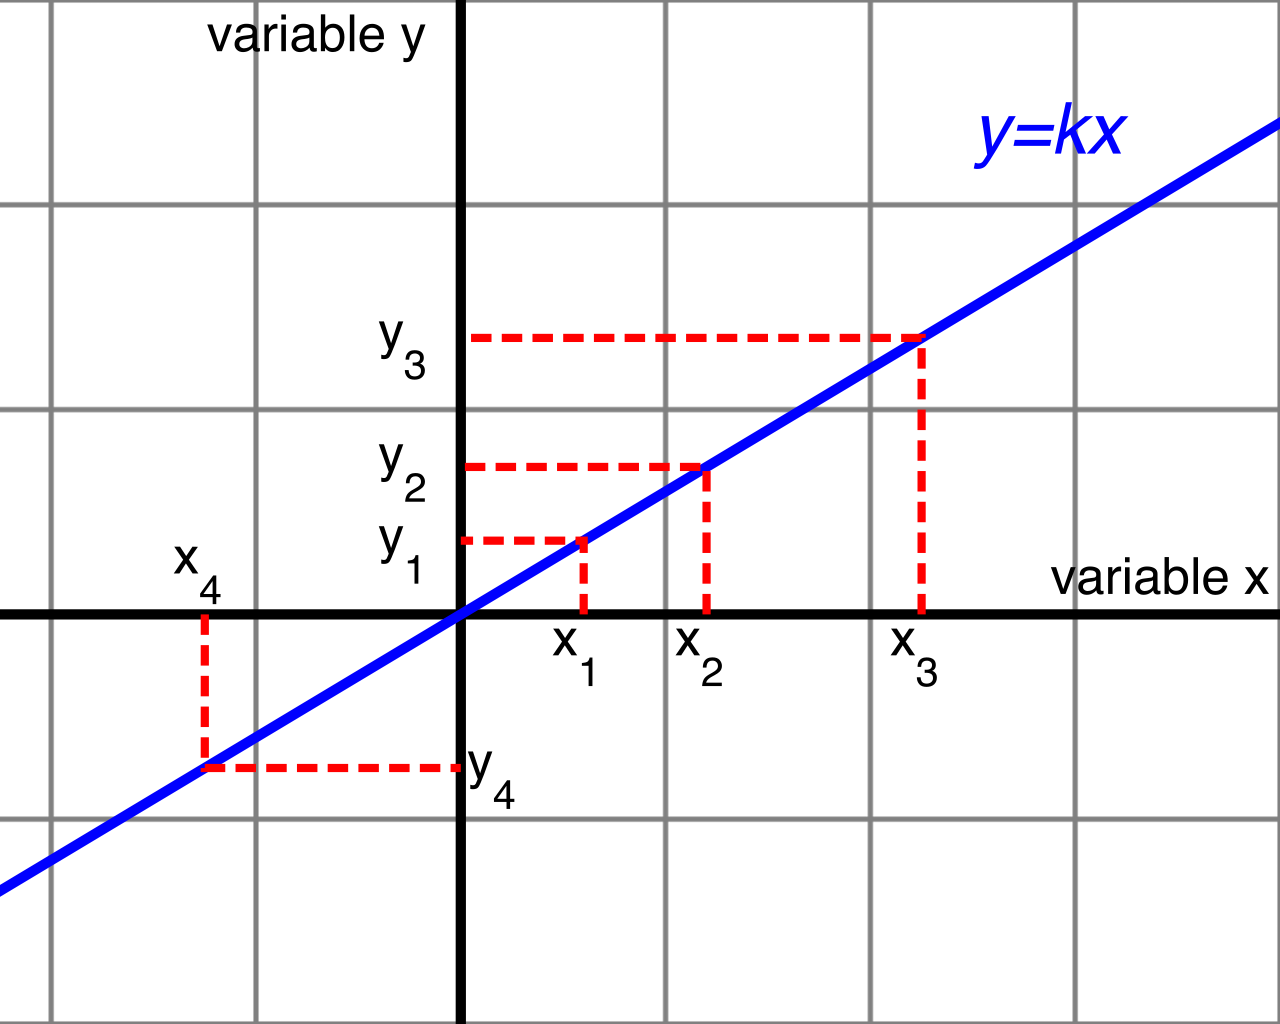
If you map this equation visually, it obeys two absolute geometrical laws:
- A graph representing a proportional relationship is always a straight line.
- A graph representing a proportional relationship always passes through the origin.
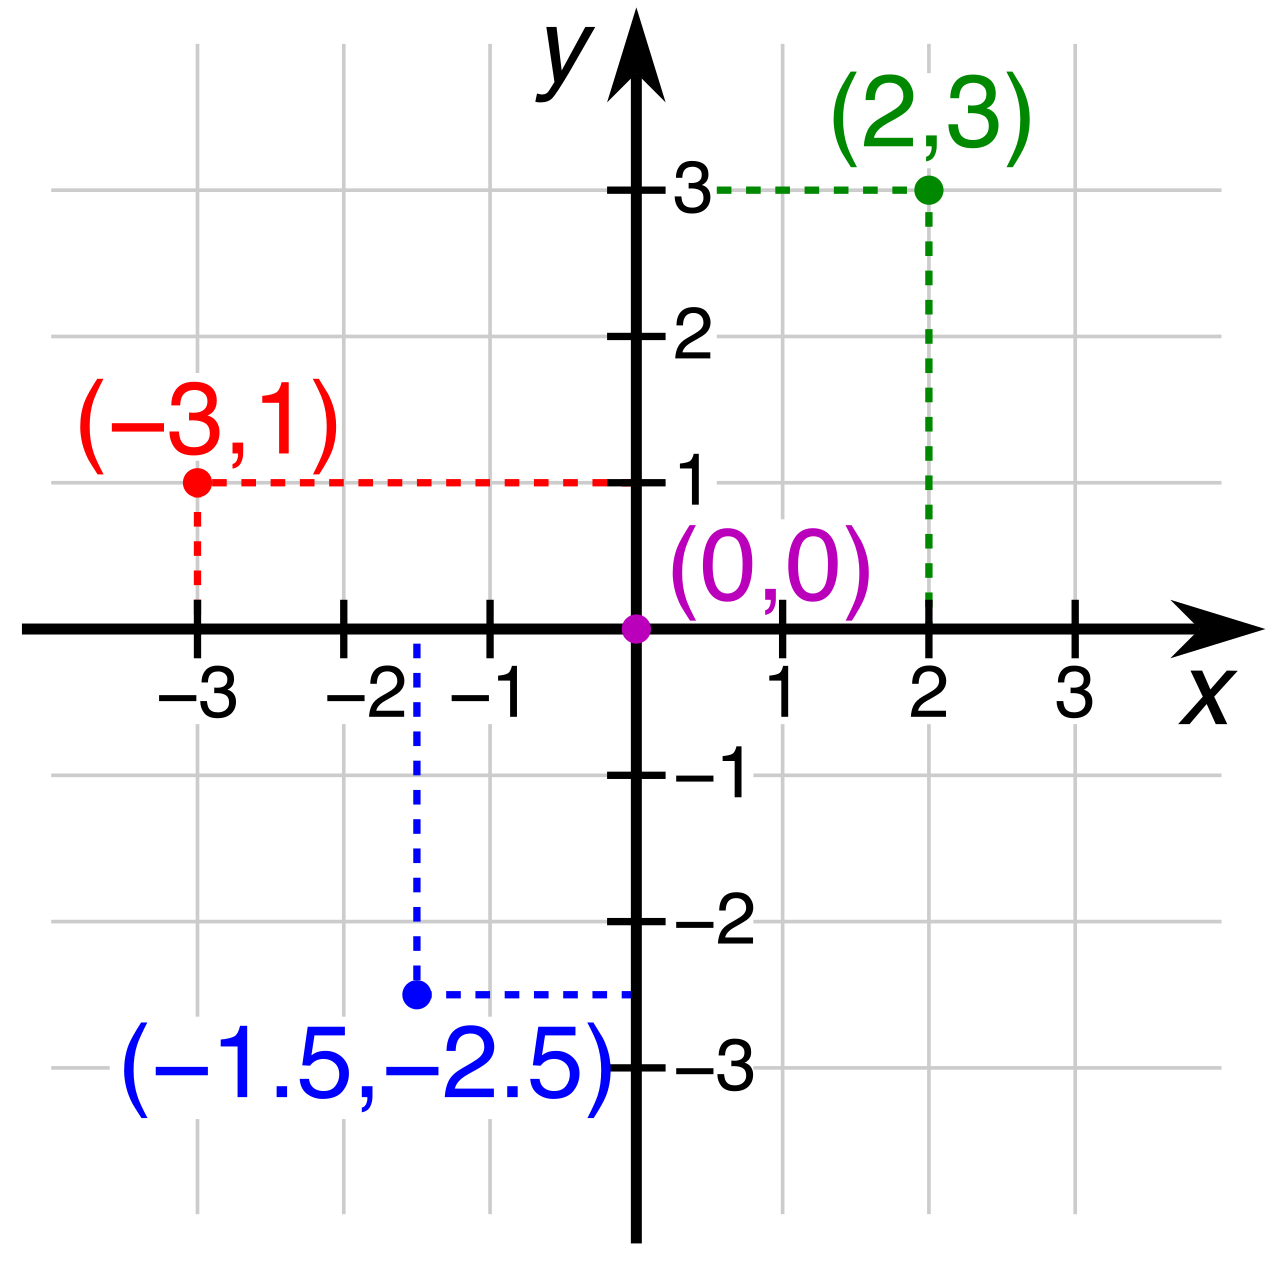
The origin on a Cartesian coordinate plane is the point (0,0). This makes intuitive sense: if you buy zero pounds of apples at $4.00 a pound, you pay zero dollars. Zero independent input mandates zero dependent output.
Solving the Unknown: Cross-Multiplication
Often, we know a relationship is proportional, but we are missing a specific piece of data. If 3 pounds of apples cost $12, how much will 5 pounds cost?
Setting up a proportion requires aligning matching units in the numerators and matching units in the denominators.
Weight (lbs)Cost ($)=312=5x
To solve this, we rely on a structural guarantee: The cross products of two equivalent fractions are always equal to each other. Multiplying the numerator of the first fraction by the denominator of the second will exactly equal the denominator of the first multiplied by the numerator of the second ($12 \times 5 = 3 \times x$).
This gives us cross-multiplication, which is an algebraic method used to solve for an unknown value in a proportion. Here, $60 = 3x,leadingswiftlytotheconclusionthatx = 20. The 5 pounds of apples cost \20.
Algebra is powerful, but human brains are exceptionally visual. To build intuitive understanding, we utilize specific diagrammatic tools:
- Tape diagrams: A tape diagram is a visual model using rectangles to represent ratios. Because the rectangles can be segmented evenly, a tape diagram is a visual model using rectangles to represent proportional relationships. If the ratio of boys to girls is 2 to 3, you draw a tape of two identical blocks next to a tape of three identical blocks. By assigning a numerical value to a single block, the entire system scales seamlessly.
- Double number lines: When dealing with rates comparing different units (like miles and hours), we use a tool that captures both dimensions. A double number line is a visual model showing equivalent ratios along two parallel number lines scaled differently. The top line might mark hours ($0, 1, 2, 3) while the perfectly aligned bottom line marks miles (\0, 60, 120, 180$).
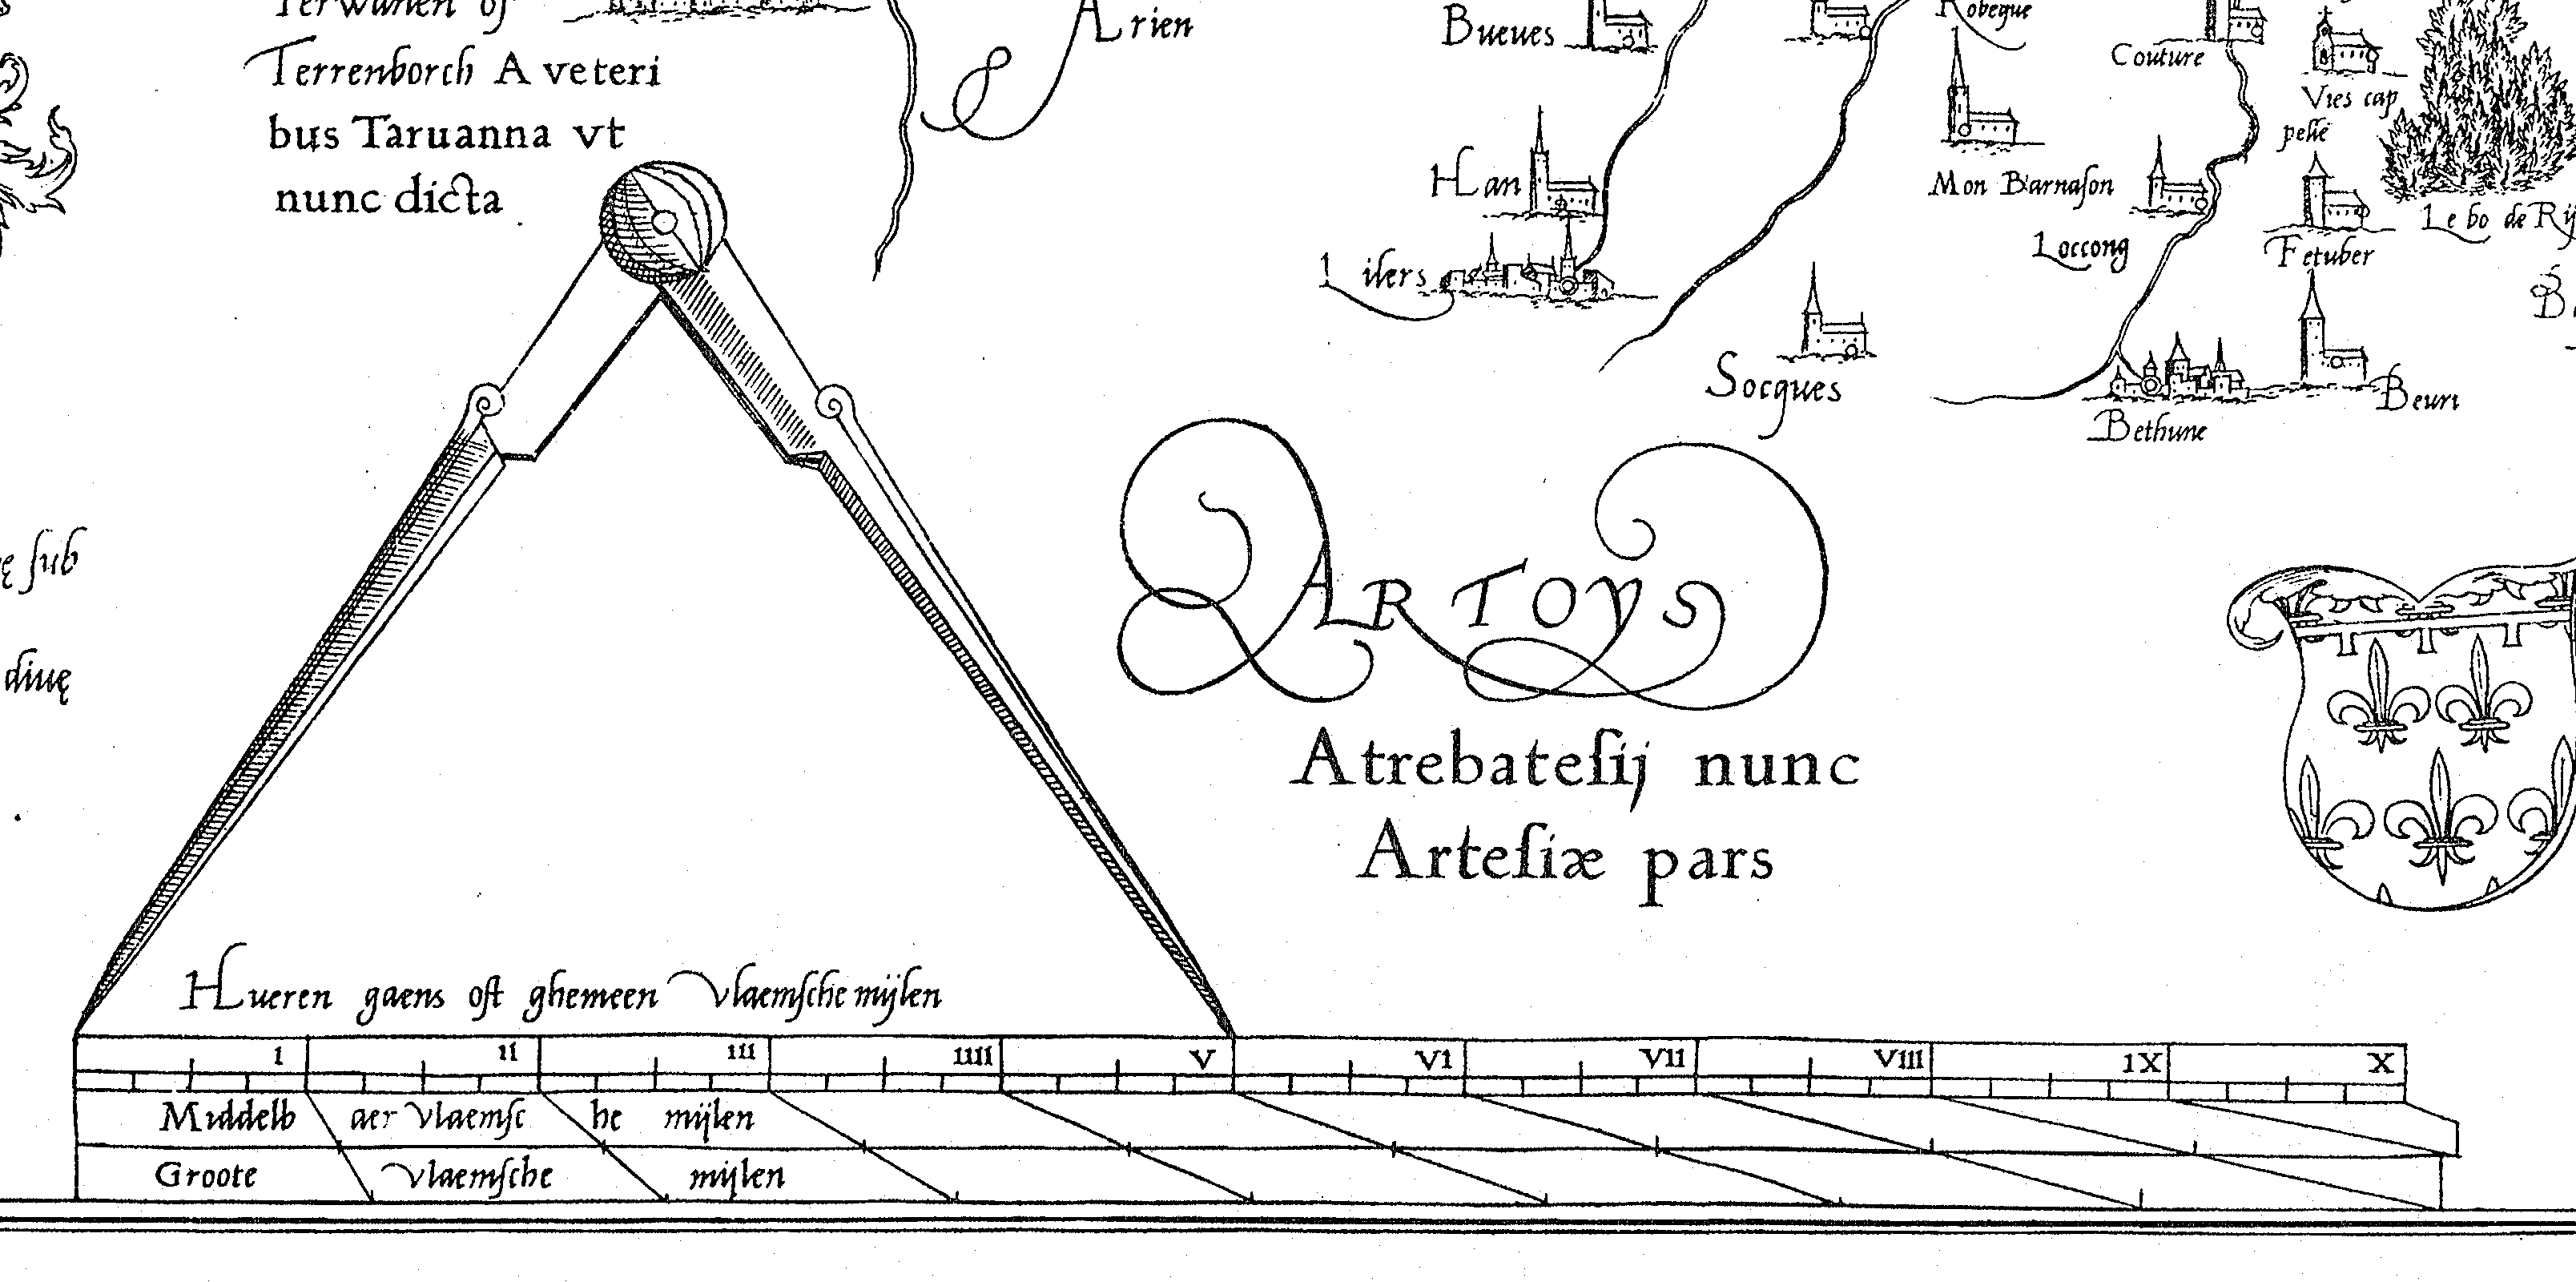
- Scale factors: Maps and architectural blueprints rely on proportionality to shrink the world onto a page. The scale factor is the ratio of a length on a scale drawing to the corresponding length on the actual object. Consequently, scale factors can be used within proportional equations to calculate actual dimensions from a model. If the scale factor is $1 \text{ inch} : 10 \text{ feet}$, a 3-inch line on paper translates unequivocally to 30 feet of reality.
A fraction like 2517 is perfectly precise, but it is cognitively clunky to compare against 4023. To allow for instant, universal comparison of ratios, humanity standardized a denominator.
A percent represents a specific ratio whose second term is exactly the number 100. The terminology itself is entirely literal: The English word "percent" literally translates to "per one hundred."
Converting Between Languages
Because percents, decimals, and fractions are merely different dialects of the same mathematical language, fluency requires swift conversion:
| Conversion Task | The Mechanism | Example |
|---|---|---|
| Decimal to Percent | To convert a decimal number to a percent, multiply the decimal number by 100. | $0.45 \times 100 = 45%$ |
| Percent to Decimal | To convert a percent value to a decimal number, divide the percent value by 100. | $82% \div 100 = 0.82$ |
| Fraction to Percent | To convert a fraction to a percent, divide the numerator by the denominator and multiply the resulting decimal by 100. | 83=0.375→37.5% |
Solving Percent Problems
Virtually every percent problem can be solved using a universal proportional architecture. A percent problem can be solved by setting the percent value over 100 equal to the part over the whole.
100Percent=WholePart
If you need to find what 20% of 80 is, you set up 10020=80x and use cross-multiplication. Alternatively, if you seek a more direct computational route: To find a specific percent of a given number, convert the percent to a decimal and multiply by the given number. ($0.20 \times 80 = 16$).
Percents are the lifeblood of data analysis and commerce. When populations grow or stock portfolios crash, we track the momentum via percentage shifts.
- Percent increase is calculated by dividing the absolute amount of increase by the original amount and multiplying by 100. If a town of 4,000 grows to 5,000, the absolute increase is 1,000. $1,000 \div 4,000 = 0.25$, or a 25% increase.
- Percent decrease is calculated by dividing the absolute amount of decrease by the original amount and multiplying by 100. If a $50 shirt drops to $40, the decrease is $10. $10 \div 50 = 0.20$, or a 20% decrease.
In the retail world, these shifts have specific names:
- A markup is a price increase added to the cost price of an item to determine the final selling price. It guarantees a merchant's profit.
- A markdown is a price reduction from the original price of an item calculated using a percentage. This is the mathematics of the clearance rack.

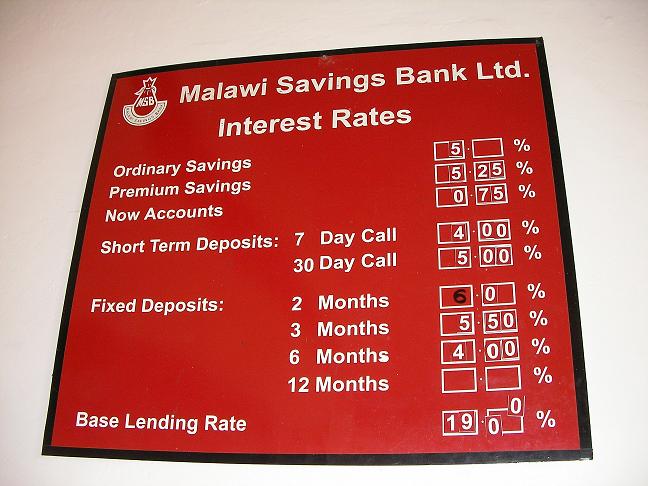
Time itself becomes a factor in proportional mathematics when we interact with financial institutions. When you deposit money into a bank, the bank effectively rents that money from you. The rent they pay is called interest.
Simple interest is mathematically calculated using the formula Interest equals Principal times Rate times Time. I=P×R×T
- Principal (P): The original sum of money borrowed or invested.
- Rate (R): The annual percentage charged or earned.
- Time (T): The duration the money is borrowed/invested, expressed in years.
There is a critical mechanical rule when executing this formula: In the simple interest formula, the rate must be expressed as a decimal or fraction before multiplying. You cannot plug a raw percentage like "5" into the equation if the rate is 5%; you must convert it to $0.05$.
If you invest $1,000 (Principal) at a 5% simple interest rate (Rate = 0.05) for 3 years (Time = 3), the interest generated is: I=1000×0.05×3=150. The interest earned is $150.
Whether examining the microscopic scale factors of a cellular diagram, calculating the markup on a pair of shoes, or evaluating the constant velocity of an object, proportional reasoning allows us to view the world not as isolated numbers, but as beautifully interconnected systems.