Macroeconomic Performance
Not sure you’re ready?
Take the ~3-minute readiness diagnostic and see where you stand.
Evaluating the macroeconomic performance of a nation requires reading the vital signs of a complex, multi-trillion-dollar organism. Just as a physician relies on blood pressure, heart rate, and temperature to assess human health, economists rely on three fundamental metrics to diagnose the health of an economy: overall output, labor utilization, and price stability. For the social studies educator, mastering these concepts is not merely an exercise in memorizing formulas. It is the key to demystifying the historical forces that unseat presidents, trigger global migrations, and dictate the daily realities of the citizens who will soon sit in your classrooms.
To understand the macroeconomy, we must abandon the perspective of the individual consumer and adopt a systemic view. We are measuring the aggregate total of millions of simultaneous decisions. We begin with the most sweeping measurement of all: the sheer volume of a nation's production.
Gross Domestic Product (GDP) is the total market value of all final goods and services produced within a country's borders in a specific time period. Calculated officially by the Bureau of Economic Analysis (BEA) in the United States, it is the primary scorecard for national economic size.
To measure GDP accurately, we must strictly delineate what is and is not counted. The definition specifies final goods, which are products sold to the ultimate consumer. We deliberately exclude intermediate goods—the raw materials or components used in the production process.
Imagine a local bakery purchasing flour to make bread. The flour is an intermediate good. If the BEA counted the sale of the flour to the baker, and then counted the sale of the final loaf of bread to the consumer, they would be counting the value of the flour twice. By excluding intermediate goods, economists avoid this double counting, ensuring GDP represents true, unduplicated value creation.
The Four Components of GDP
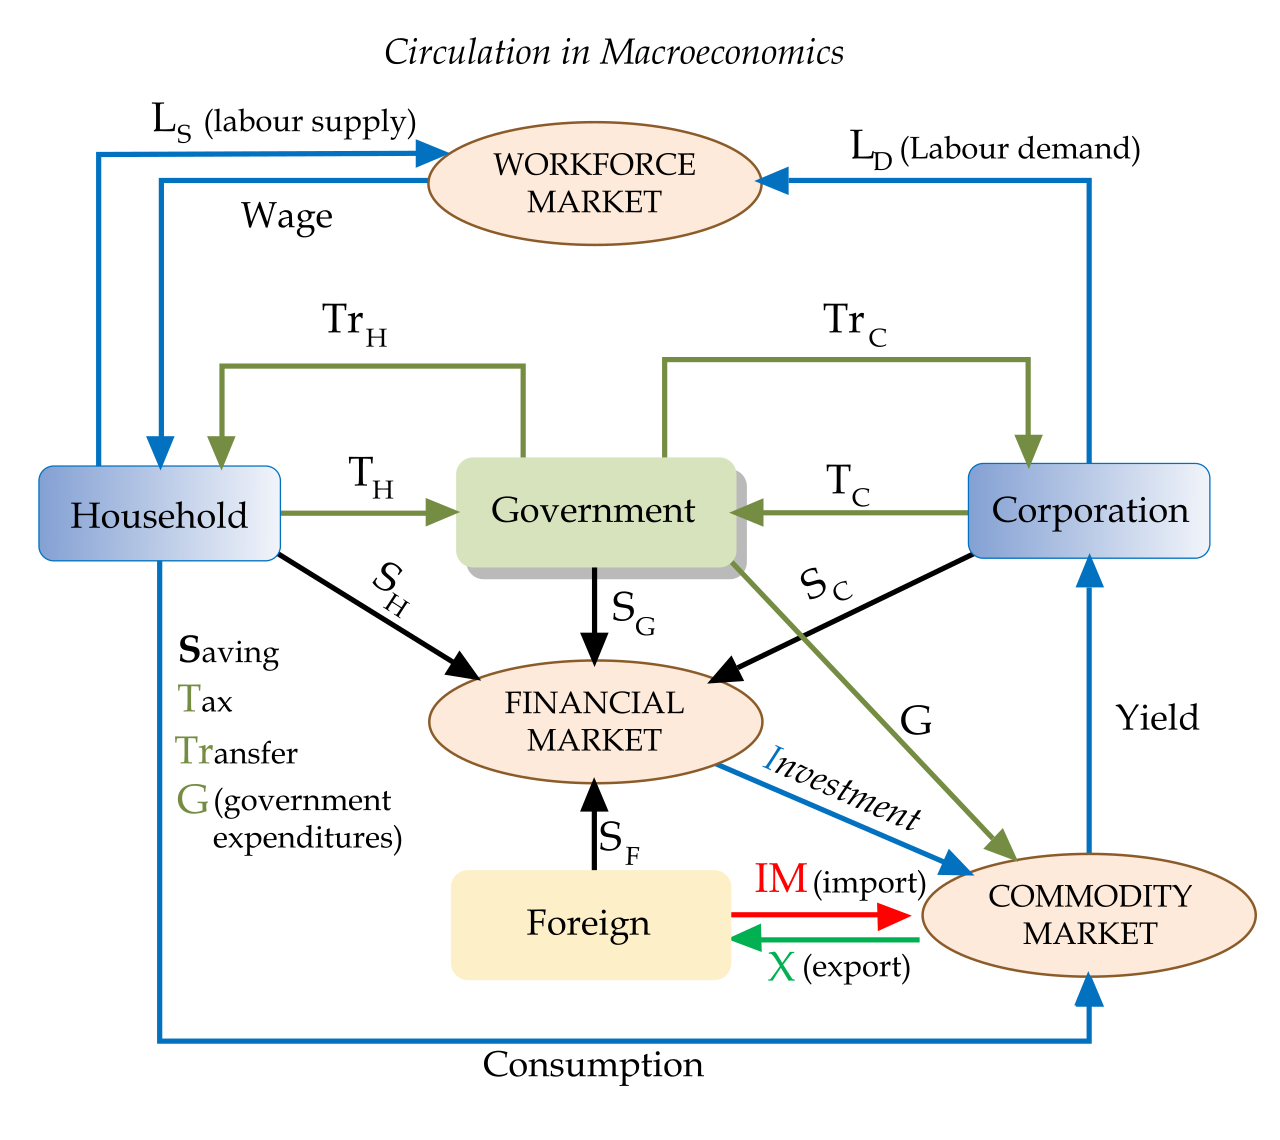
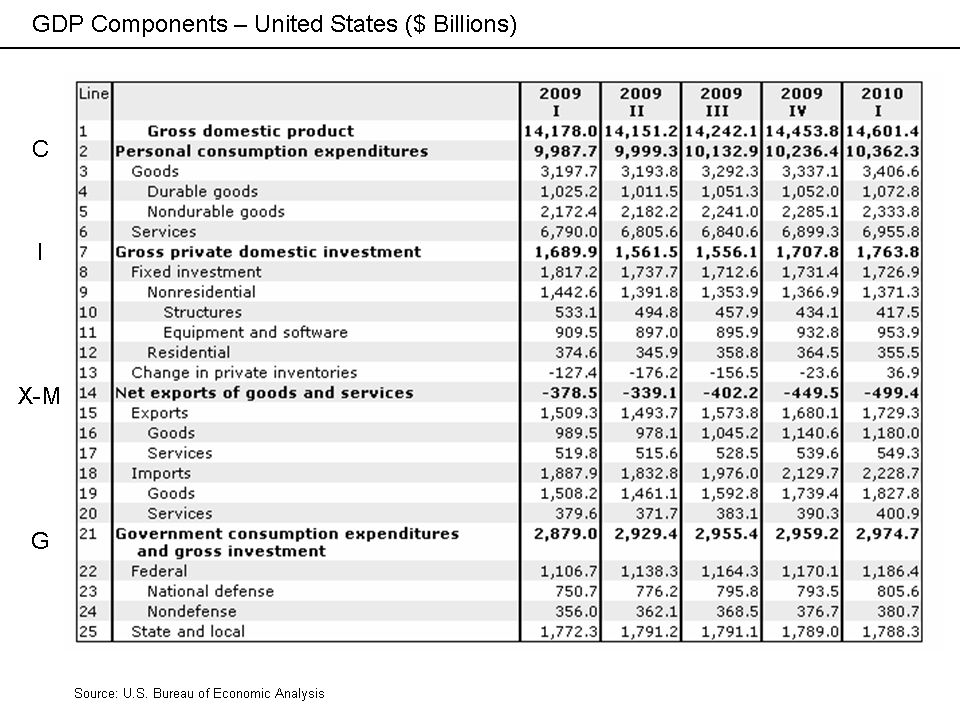
Economists traditionally measure GDP through the expenditure approach, which aggregates all spending in the economy. Gross Domestic Product includes four main spending components:
GDP = Consumer Spending (C) + Business Investment (I) + Government Spending (G) + Net Exports (NX)
- Consumer Spending (C): This represents the largest single component of the United States Gross Domestic Product, historically making up about 70% of the economy. When your students buy sneakers, stream movies, or pay for a haircut, they are directly driving this metric.
- Business Investment (I): This is not investment in the stock market. In economics, business investment in Gross Domestic Product includes purchases of physical capital, inventory changes, and new housing construction. When a factory buys new robotics, or a developer builds a suburban subdivision, it lands here.
- Government Spending (G): Government spending in Gross Domestic Product includes public expenditures on goods and services, such as building interstate highways, funding national defense, and paying public school teachers. Crucially, government transfer payments like Social Security are excluded from Gross Domestic Product calculations. Because a transfer payment simply redistributes existing wealth rather than purchasing a newly produced good or service, counting it would artificially inflate the output metric.
- Net Exports (NX): Net exports are calculated by subtracting a country's total imports from its total exports. If a nation imports more than it exports (a trade deficit), this number is negative, subtracting from total GDP.
The Illusion of Prices: Nominal vs. Real GDP
If total spending doubles in a decade, did the economy actually produce twice as much "stuff," or did prices simply double while production remained flat?
To answer this, we must distinguish between two measurements. Nominal Gross Domestic Product measures economic output using current market prices without adjusting for inflation. It takes the economy strictly at face value. Conversely, Real Gross Domestic Product is adjusted for the effects of inflation. By anchoring prices to a base year, it strips away the illusion of price increases. Because it reveals actual changes in production volume, economists use Real Gross Domestic Product to accurately compare economic growth across different time periods.
Standard of Living and the Blind Spots of GDP
When evaluating how these aggregate numbers impact individual lives, economists rely on a per-person metric. Gross Domestic Product per capita divides total economic output by the total population. Because it scales economic size to population size, Gross Domestic Product per capita is frequently used as an indicator of average living standards.
However, GDP is a measure of market production, not a holistic measure of human well-being. As an educator teaching both economics and sociology, you must highlight its profound shortcomings:
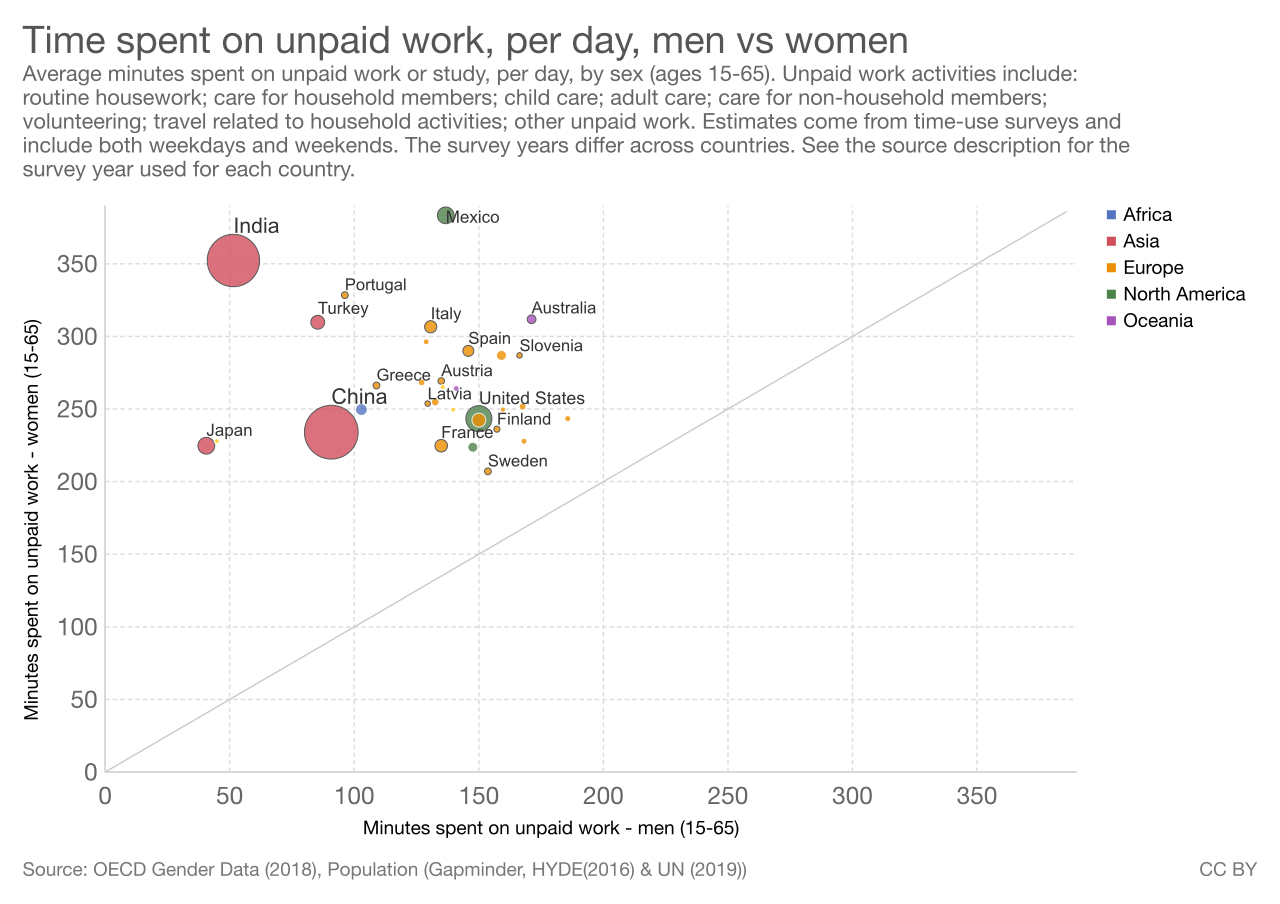
- Gross Domestic Product fails to account for non-market transactions like unpaid domestic labor. The grueling work of stay-at-home parenting or caring for elderly relatives generates immense societal value, yet registers as zero in GDP.
- Gross Domestic Product does not measure the value of the underground or informal economy. Unreported cash transactions, from teenage babysitting to illicit black markets, vanish from official ledgers.
- Gross Domestic Product does not account for environmental degradation caused by economic production. If a chemical plant pollutes a river, the cleanup efforts actually add to GDP, while the loss of clean water and biodiversity goes completely unpenalized in the data.
- Gross Domestic Product does not reflect income distribution or wealth inequality among a country's citizens. A soaring GDP per capita might mask a reality where a handful of billionaires capture all the economic gains while the working class stagnates.
If GDP measures the engine's output, employment measures how many cylinders are actually firing. However, not everyone without a job is considered "unemployed" in the eyes of the government.
The Labor Force and The Formula
The official metric hinges on a precise definition: The labor force consists of all employed individuals plus all unemployed individuals actively seeking work.
If an individual does not have a job and is not actively looking for one—whether they are a full-time student, a retiree, or entirely off the grid—they are not in the labor force. Importantly, discouraged workers who have given up looking for employment are excluded from the labor force. This is a critical nuance: during severe recessions, the unemployment rate can artificially drop simply because millions of desperate people stop looking for work and exit the labor force altogether.
Unemployment Rate = (Number of Unemployed Individuals ÷ Total Labor Force) × 100
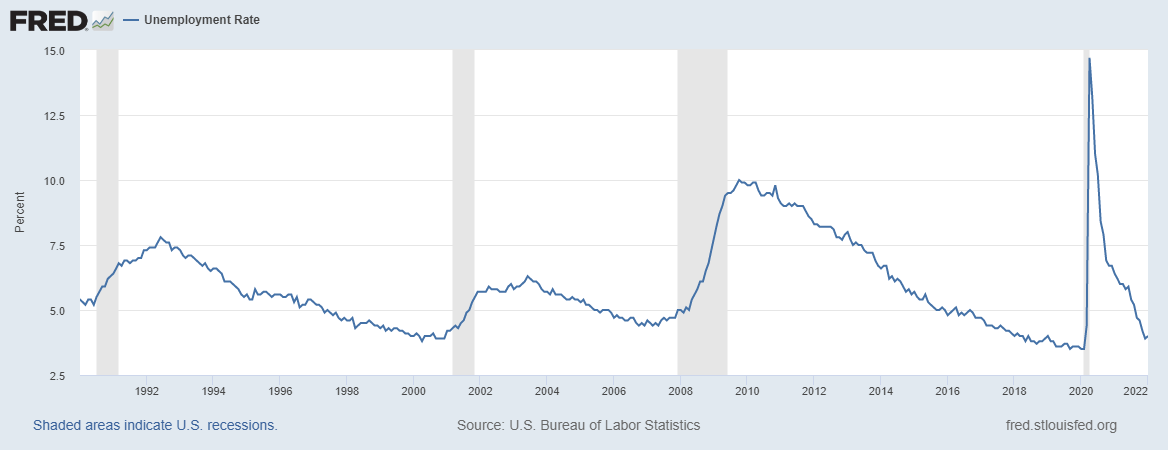
In the U.S., the Bureau of Labor Statistics measures the official unemployment rate, releasing this highly anticipated data on the first Friday of every month.
The Four Types of Unemployment
To treat an illness, a doctor must know its cause. Economists categorize unemployment into four distinct types based on their underlying causes:
- Frictional unemployment occurs when workers are temporarily between jobs or searching for their first job. This is normal and healthy. It is the friction of a dynamic economy where recent college graduates are looking for their first teaching gig, or professionals are relocating to a new city.
- Structural unemployment occurs when there is a mismatch between workers' skills and the skills demanded by employers. This is deeply disruptive. Think of the 19th-century carriage makers displaced by the automobile, or modern coal miners laid off in a shift toward renewable energy. Their skills are no longer marketable in their geographic location.
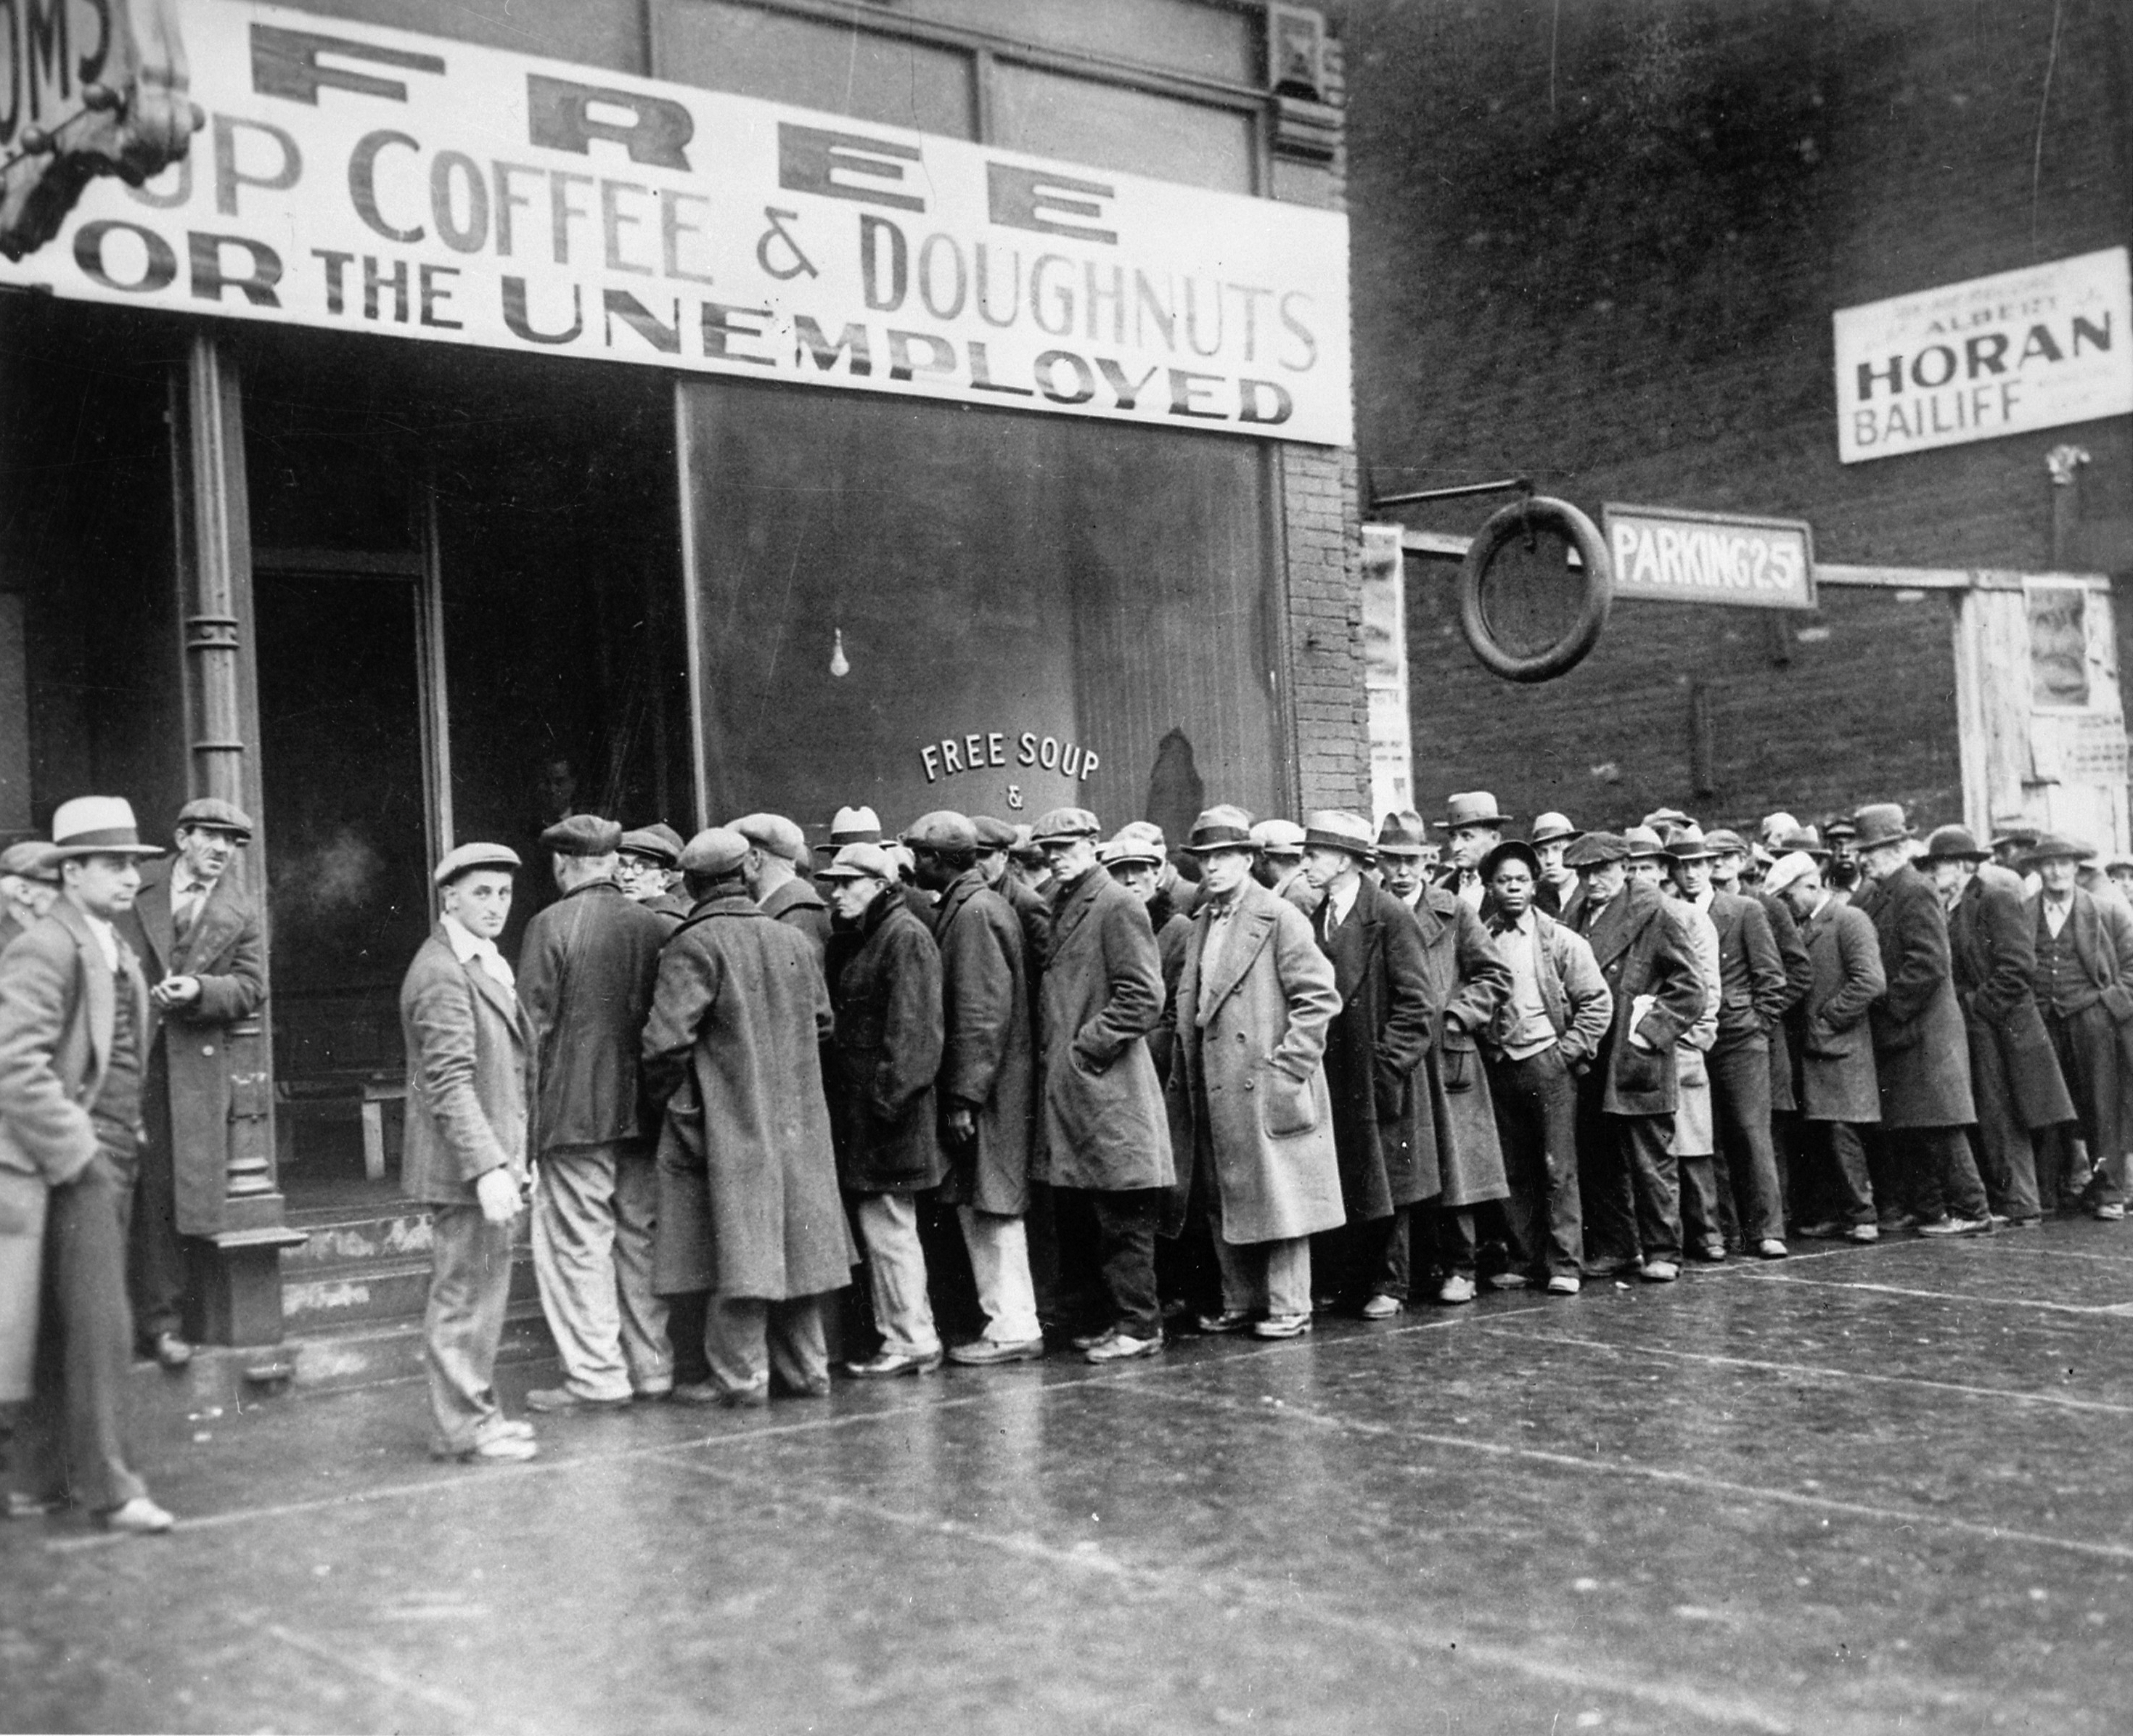
- Cyclical unemployment results from a downturn in the business cycle and reduced overall economic demand. When the economy contracts (a recession), consumers stop buying, businesses cut production, and mass layoffs ensue. This is the devastating unemployment of the 1930s Great Depression.
- Seasonal unemployment occurs due to predictable shifts in labor demand throughout the year. Think of ski instructors in July or agricultural workers in December.
The Illusion of Zero: Full Employment
It is a common misconception that a perfectly healthy economy has an unemployment rate of 0%. In reality, friction and structural shifts are ever-present in a free market. Therefore, the natural rate of unemployment equals the sum of frictional unemployment and structural unemployment.
When economists speak of optimal health, they use a specific benchmark: Full employment occurs when cyclical unemployment is zero. Because the business cycle is neither booming unsustainably nor busting, the only people out of work are those in natural transitions or facing structural shifts. Thus, an economy at full employment still experiences both frictional and structural unemployment (historically hovering around an aggregate rate of 4% to 5% in the U.S.).
The final vital sign measures the stability of the currency itself. Inflation is a sustained increase in the general price level of goods and services in an economy. It means that, over time, a single dollar purchases less than it used to.
Conversely, deflation is a sustained decrease in the general price level of goods and services in an economy. While cheaper goods sound appealing, deflation often triggers economic depressions, as consumers delay purchases (expecting lower prices tomorrow) and business profits collapse. Finally, disinflation refers to a slowing down of the rate of inflation. If prices rise by 6% one year and 2% the next, prices are still going up, but the pace has decelerated.

Measuring Price Changes: The CPI
To measure inflation, the Bureau of Labor Statistics calculates the Consumer Price Index in the United States.
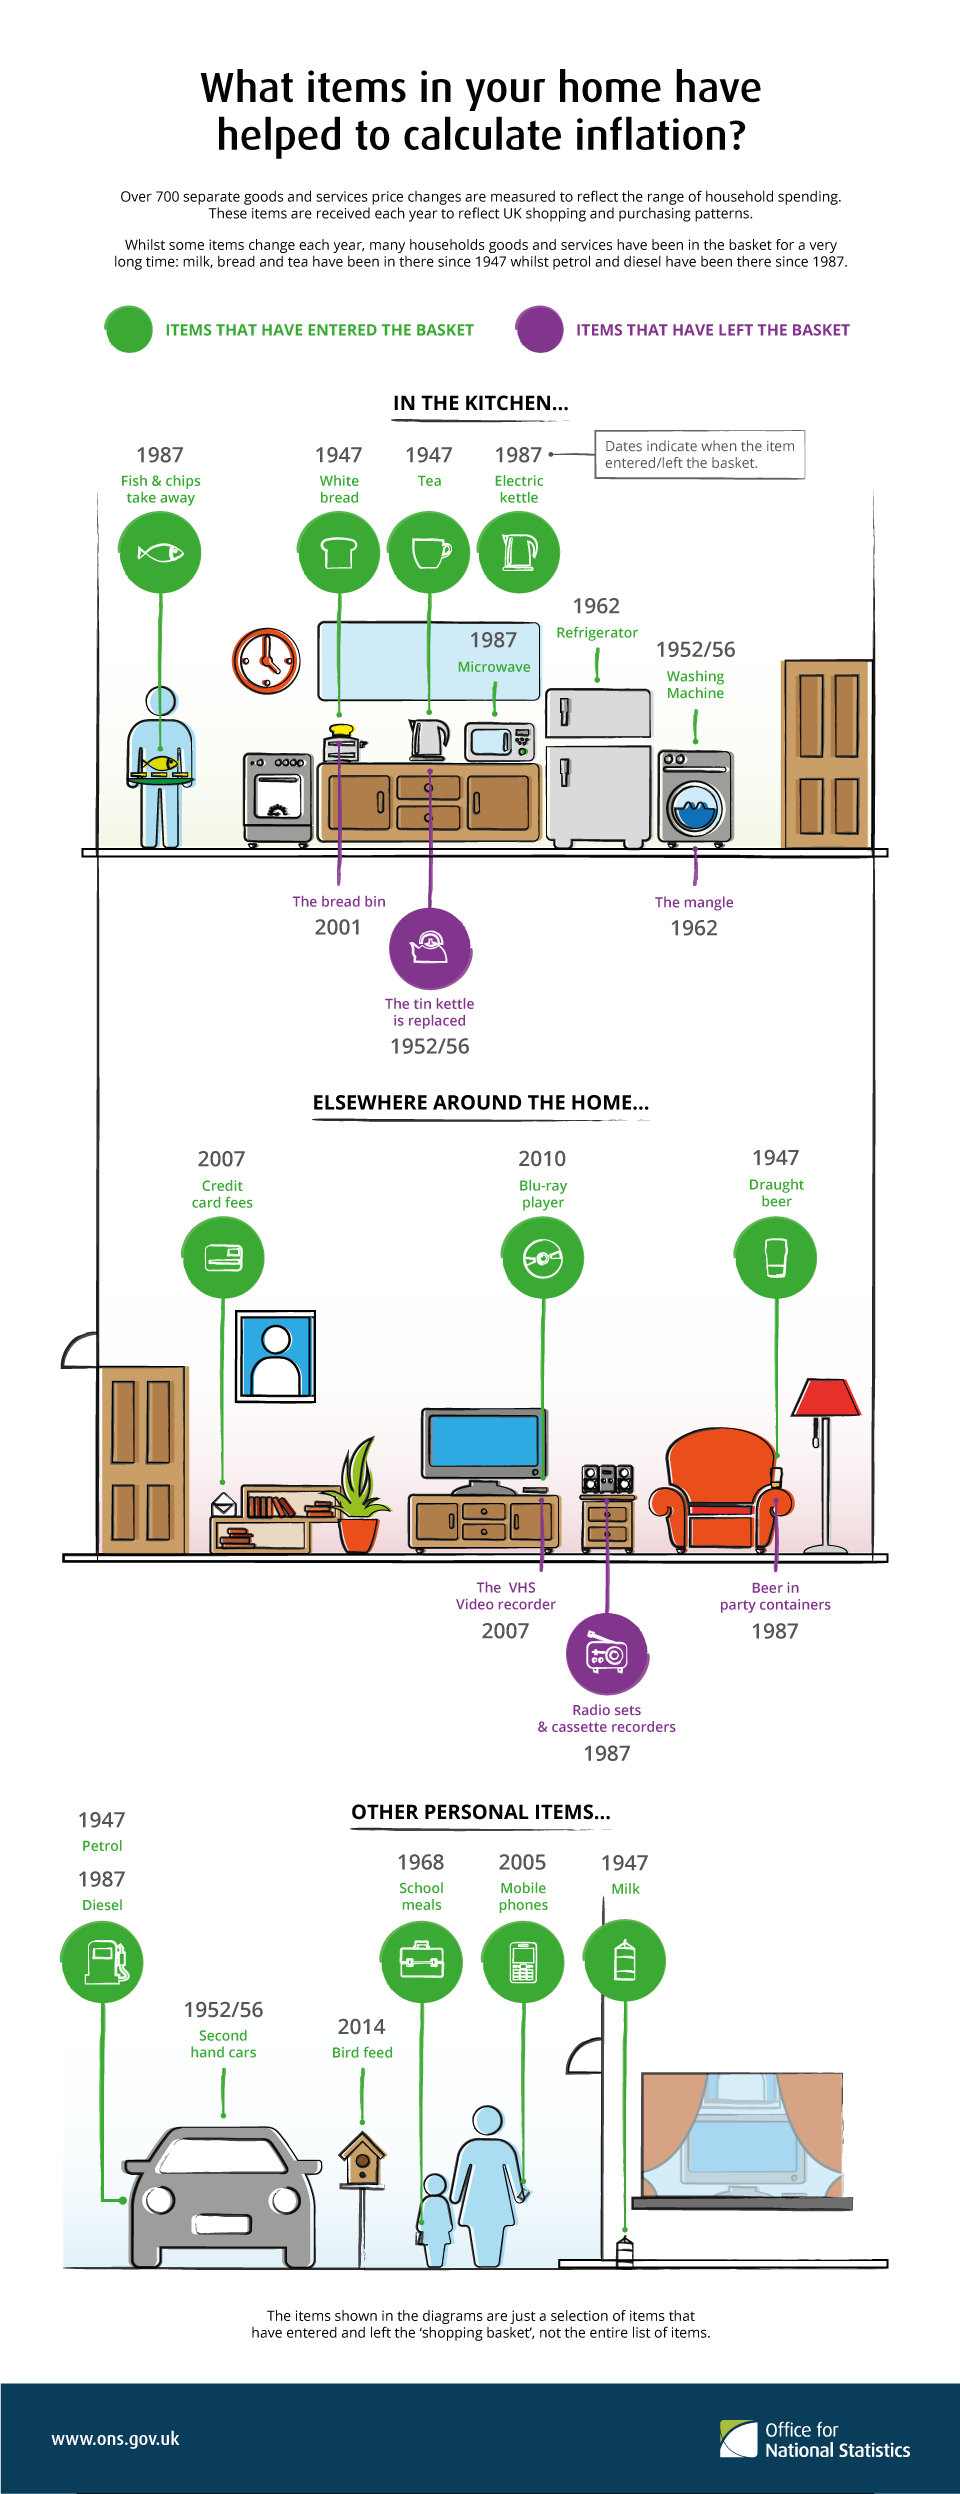
The Consumer Price Index measures the average price change over time for a fixed basket of consumer goods. Imagine a massive, hypothetical shopping cart filled with the exact proportions of housing, food, transportation, and medical care purchased by the typical urban family. The BLS tracks the price of this exact cart month after month.
Inflation Rate = Percentage change in the Consumer Price Index from one period to another.
Causes of Inflation: Demand-Pull vs. Cost-Push
When historical events trigger inflation—such as the post-WWII boom or the 1970s oil crises—they generally fall into two causal categories:
- Demand-pull inflation occurs when aggregate demand exceeds the economy's capacity to produce goods. Often summarized as "too much money chasing too few goods," this happens when consumers, businesses, and governments are spending so aggressively that producers cannot keep up, allowing them to raise prices.
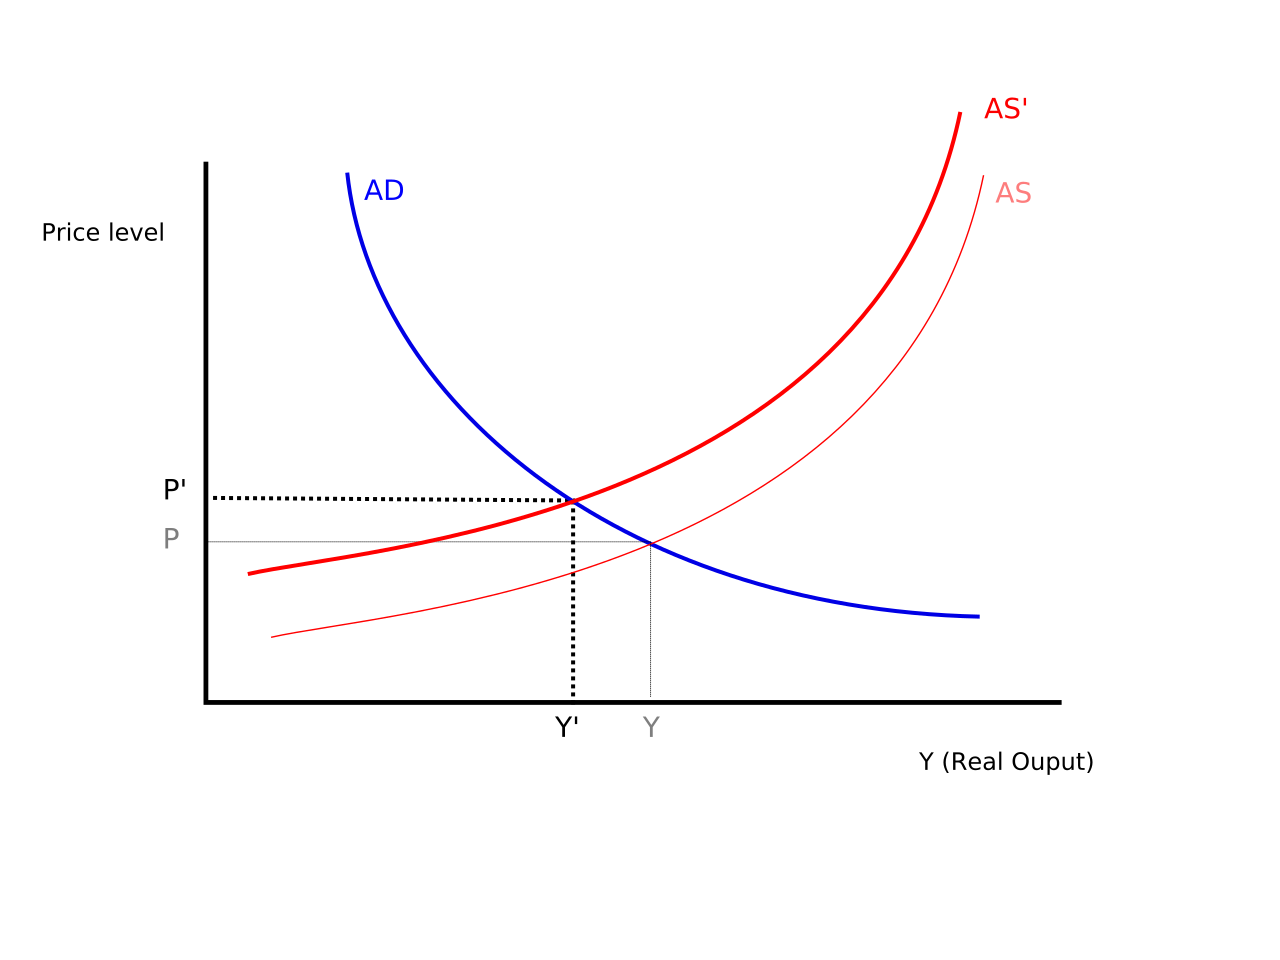
- Cost-push inflation occurs when the costs of production inputs increase and drive up the prices of final goods. If a geopolitical conflict chokes off the global supply of oil, the cost to manufacture and transport almost everything rises. Businesses must push these increased costs onto the consumer, resulting in simultaneous inflation and economic stagnation (stagflation).
Shortcomings of the CPI
The Consumer Price Index is highly scrutinized because it dictates everything from Federal Reserve policy to Social Security cost-of-living adjustments. Yet, it is an imperfect tool.
First, the Consumer Price Index overstates inflation due to substitution bias. The CPI assumes consumers keep buying the same fixed basket of goods regardless of price changes. In reality, substitution bias occurs because consumers buy cheaper alternatives when prices in the fixed market basket rise. If the price of beef skyrockets, consumers will substitute it with chicken. The CPI's rigid basket fails to immediately capture this shift, making inflation look worse than the reality experienced by the shopper.
Second, the Consumer Price Index struggles to account for quality improvements in products over time. A $500 television today is a flat-screen, internet-connected marvel, whereas a $500 television three decades ago was a heavy, standard-definition tube. The price hasn't changed, but the consumer is getting vastly more value for their money.
The Winners and Losers of Inflation
Inflation is not felt equally; it redistributes wealth between distinct groups. To evaluate how inflation impacts workers, we must look at real wages, which are wages adjusted for inflation to reflect true purchasing power. If your nominal salary increases by 3%, but inflation is 5%, your real wage has actually fallen by 2%. You are mathematically making more money, but economically growing poorer.
The most profound wealth redistribution caused by inflation occurs in the credit markets. When inflation is higher than expected, unanticipated inflation benefits borrowers by allowing them to repay debts with money that has less purchasing power. If you lock in a 30-year fixed-rate mortgage and massive inflation hits, your monthly payment stays the same, but you are paying the bank back with dollars that are increasingly worthless.
Conversely, unanticipated inflation harms lenders who receive fixed-interest payments with reduced purchasing power. The bank receives the exact nominal amount of money they were promised, but that money can no longer buy what it could when the loan was originally issued.
Synthesis for the Social Studies Classroom
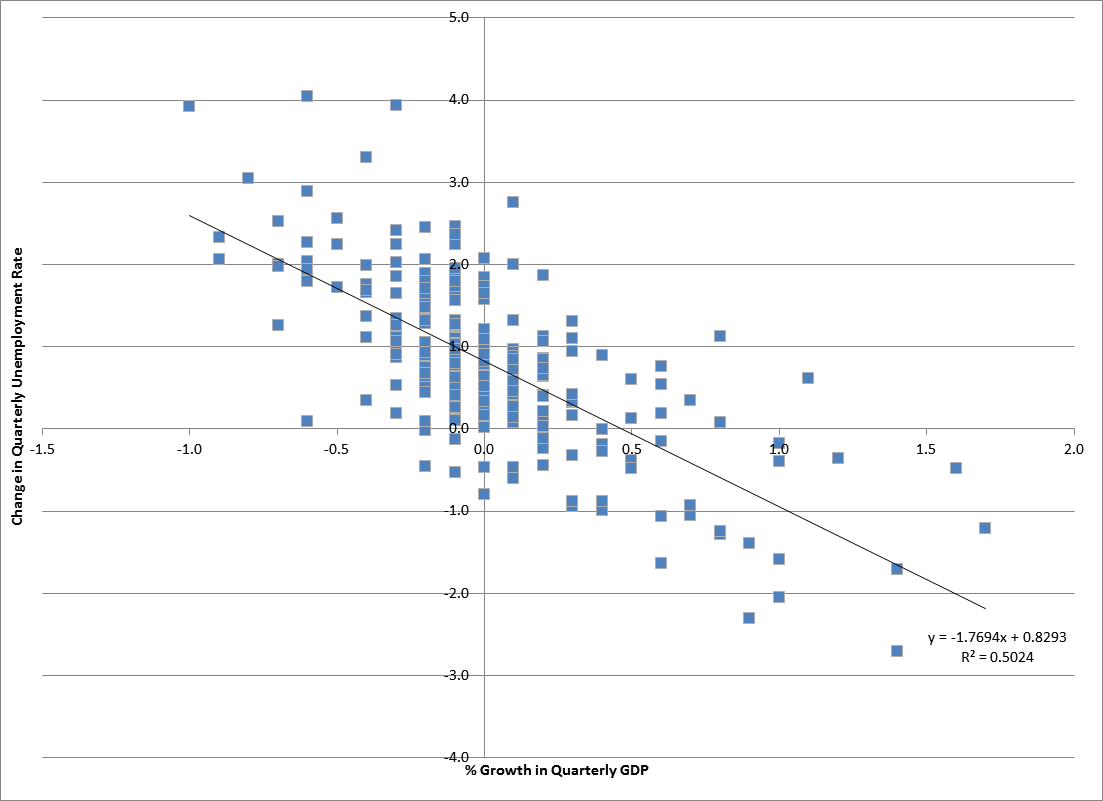
When you present these concepts to your future students, frame them not as isolated mathematical silos, but as interconnected historical forces. Surges in Real GDP often reduce cyclical unemployment, but if that growth is driven by unsustainable demand, it will trigger demand-pull inflation. When the government attempts to cool that inflation by raising interest rates, business investment (I) shrinks, leading to a rise in cyclical unemployment. This constant, delicate balancing act—maximizing output, maintaining full employment, and stabilizing prices—is the grand, enduring narrative of modern macroeconomic policy.