Characteristics of Linear Functions
Not sure you’re ready?
Take the ~3-minute readiness diagnostic and see where you stand.
A student staring at a graph of a linear function is often just looking at a snapshot of a moving object, a draining tank, or a growing bank account frozen in two dimensions. To teach the characteristics of linear functions is to teach the mathematics of predictability. When a phenomenon changes at a constant rate—whether it is the steady burn of a candle, the descent of an airplane, or the accumulation of a flat monthly streaming fee—it traces a straight line across a coordinate plane. By isolating a line's slope, its starting point, and where it terminates, we transition from merely observing a graph to predicting the future behavior of the system it represents. For middle school students, this is the crucial bridge between concrete arithmetic and abstract algebraic reasoning.
At the heart of every linear function is its slope.
The slope of a linear function represents the constant rate of change between the dependent variable and the independent variable.
In practical terms, the slope represents the marginal change in the output for each one-unit change in the input. If a student is taking a standardized test and scores three points for every correct answer, the "marginal change" is three points per one unit of correct answers. The slope dictates the angle and direction of the line:
- A positive slope indicates that the value of the dependent variable increases as the independent variable increases. (Think of an hourly wage: as hours worked increase, total pay increases.)
- A negative slope indicates that the value of the dependent variable decreases as the independent variable increases. (Think of a gift card: as the number of purchases increases, the remaining balance decreases.)
- A horizontal line on a coordinate plane has a slope exactly equal to zero. If you plot a constant function like y=5, the output never changes, no matter the input.
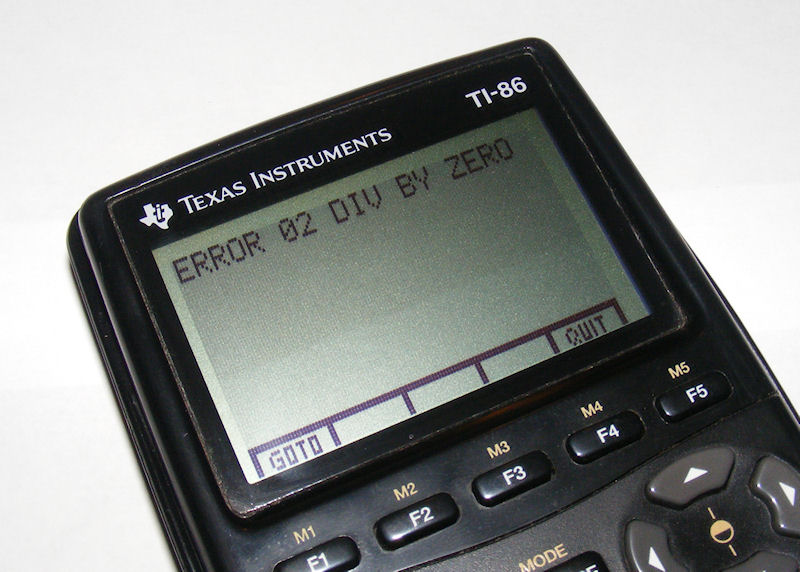
- A vertical line on a coordinate plane has an undefined slope. Because there is no horizontal movement, calculating the rate of change requires dividing by zero, which is mathematically undefined.
Calculating Slope Across Multiple Representations
To effectively teach linear functions, you must be able to translate the concept of slope across graphs, formulas, and tables.
From a Graph: The slope of a graphed line is defined as the vertical change divided by the horizontal change. You will often hear this described to students as "rise over run." It is a visual measurement of how many units you must travel up or down before moving one unit to the right.
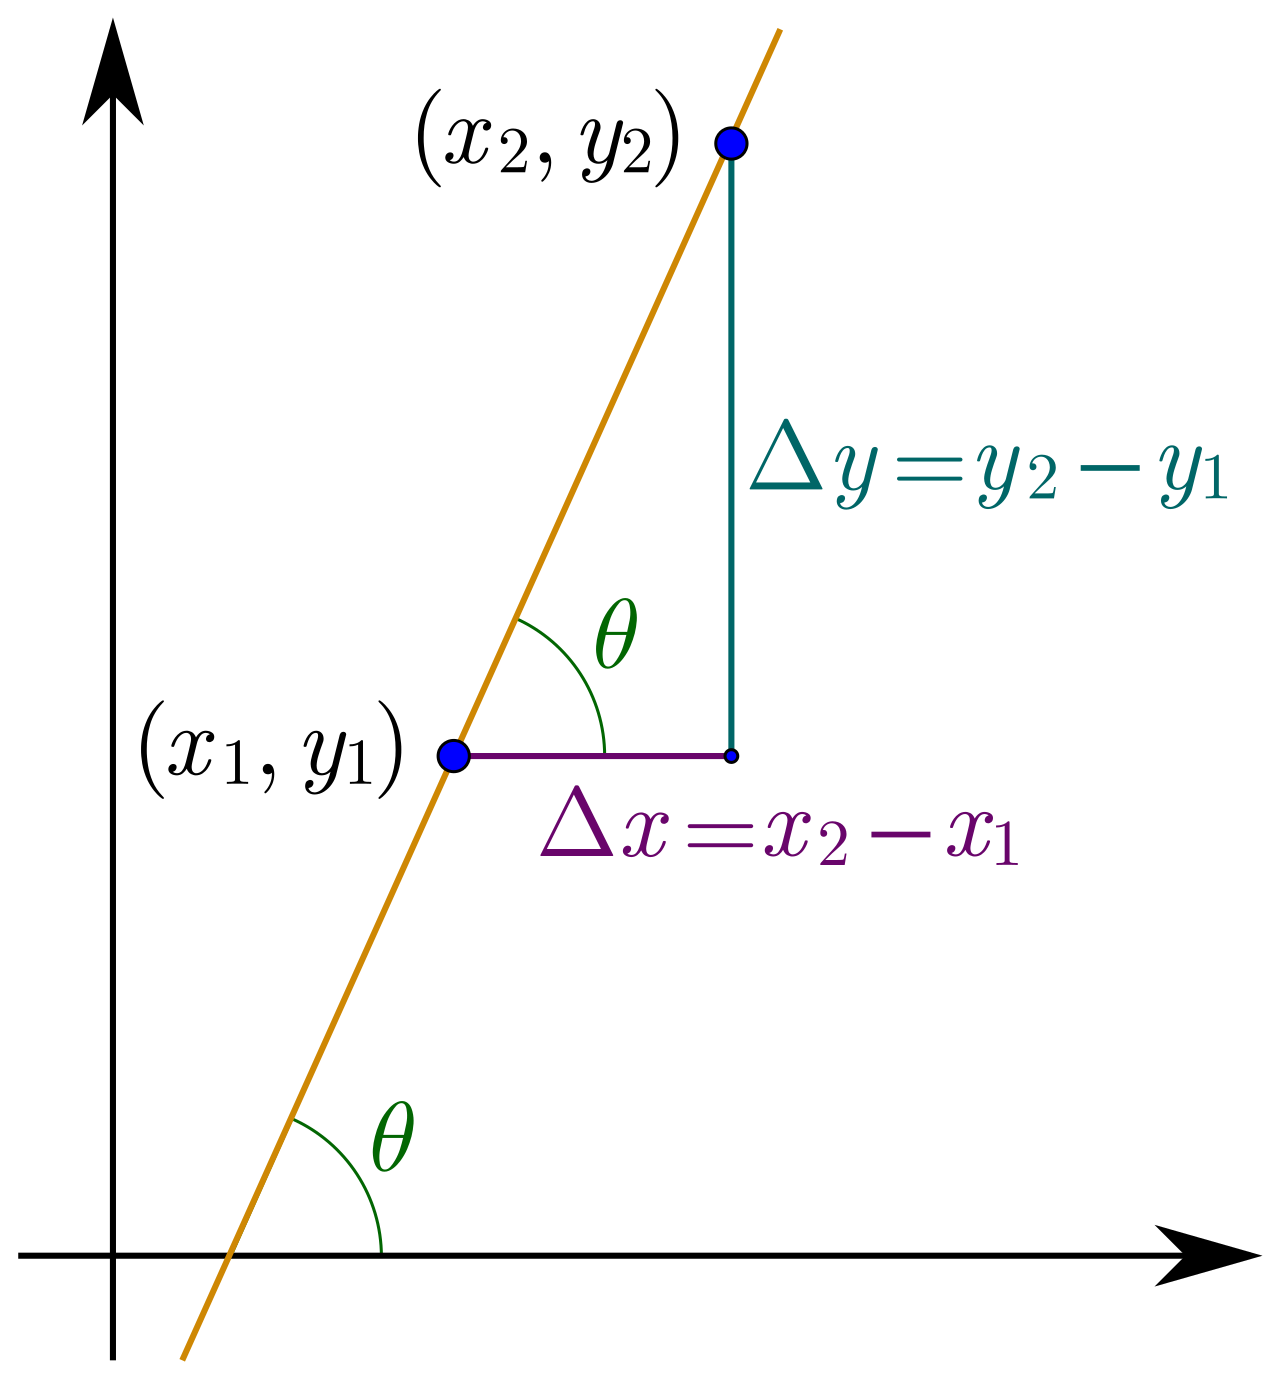
From Two Points: When given the coordinates of two distinct points, the formula to calculate the slope given two points (x1,y1) and (x2,y2) is: m=x2−x1y2−y1
From a Table: How do we know if a set of data is linear just by looking at a table? A data table represents a linear function if the ratio of the change in y to the change in x is constant across all data pairs. To calculate the slope from a data table, divide the difference between any two y-values by the difference between their corresponding x-values. It does not matter which two rows you pick; in a linear relationship, that ratio will relentlessly remain the same.
If the slope tells us how a system is changing, the intercepts tell us where that system begins and ends. Intercepts anchor the theoretical line to concrete reality.
The Y-Intercept
The y-intercept of a graph is the exact point where the line intersects the y-axis. Because the y-axis is the vertical center line of the coordinate plane, the x-coordinate of any y-intercept is always exactly zero.
- Algebraic Calculation: To calculate the y-intercept of an equation algebraically, substitute zero for the x-variable and solve for the y-variable.
- Modeling Context: In mathematical models, the y-intercept typically represents the initial value or starting amount of the dependent variable. If an electrician charges a flat $50 fee just to show up, plus $75 per hour of work, the initial value of $50 is the y-intercept.
The X-Intercept
The x-intercept of a graph is the exact point where the line intersects the x-axis. Because the x-axis is the horizontal center line of the coordinate plane, the y-coordinate of any x-intercept is always exactly zero.
- Algebraic Calculation: To calculate the x-intercept of an equation algebraically, substitute zero for the y-variable and solve for the x-variable.
- Modeling Context: In mathematical models, the x-intercept often represents the point in time or the condition when the dependent variable reaches a value of zero. If a 100-gallon water tank is draining at a rate of 5 gallons per minute, the x-intercept represents the exact minute the tank is entirely empty.
There is a profoundly important sub-category of linear functions that students encounter early in their algebraic careers: proportional relationships.
A proportional relationship is a specific type of linear function that always passes through the origin. The origin point on a standard coordinate plane is the ordered pair (0,0). In an applied context, the point (0,0) on the graph of a proportional relationship indicates that an input of zero produces an output of zero. If you buy zero apples, you pay zero dollars.
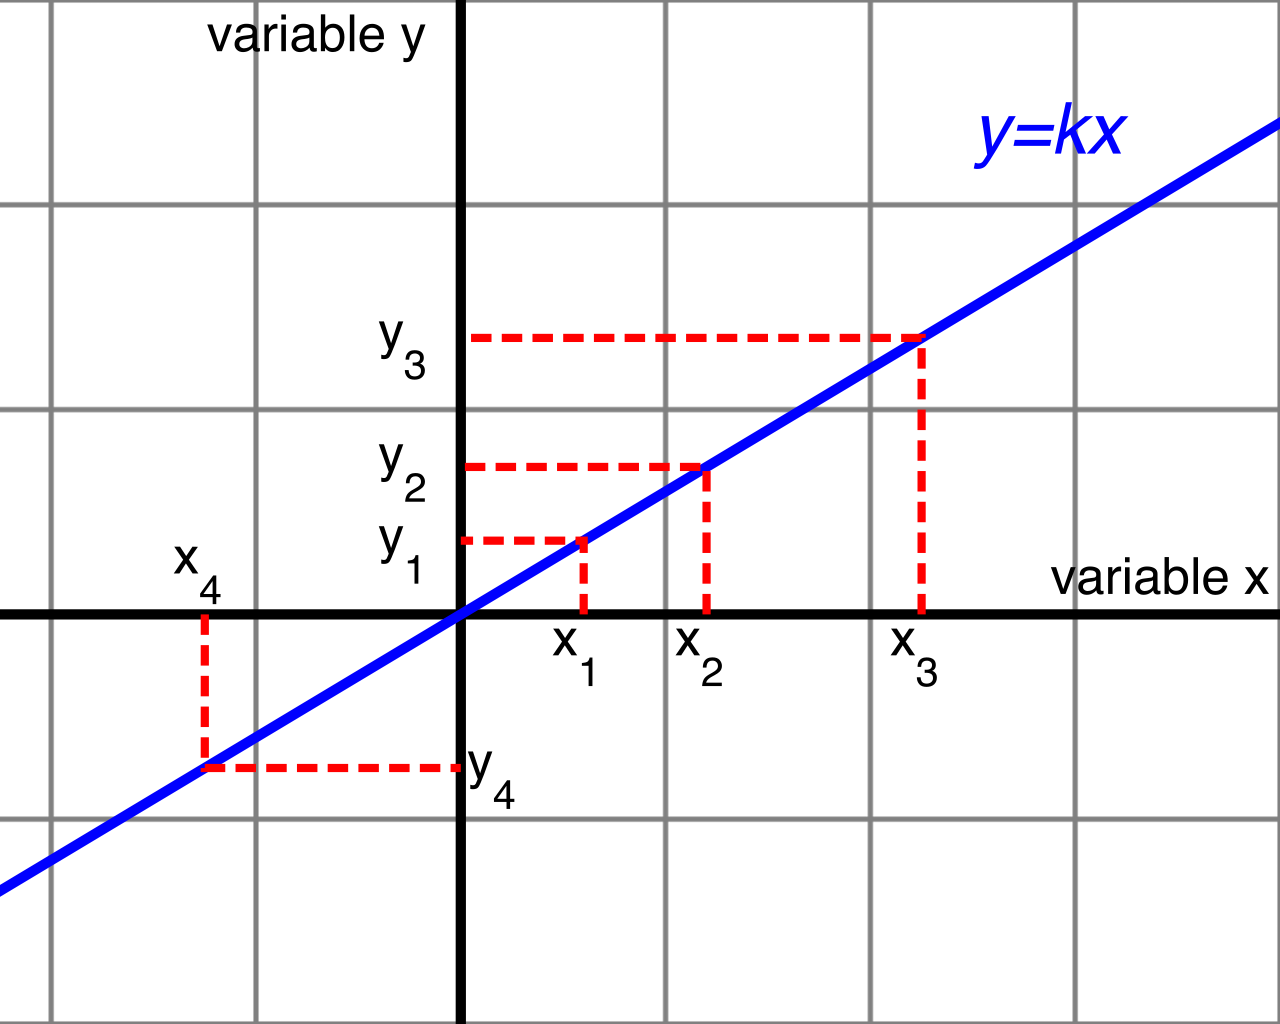
The equation for a proportional relationship is written in the form y=kx.
In the proportional equation y=kx, the variable k represents the constant of proportionality. You will notice this equation lacks the +b seen in slope-intercept form; that is because the y-intercept (b) is zero. Consequently, the constant of proportionality in a proportional relationship is mathematically equal to the slope of the line.
The Unit Rate
When dealing with proportional relationships, we often use the term unit rate. The unit rate of a proportional relationship describes the amount of the dependent variable associated with exactly one unit of the independent variable.
Crucially, the unit rate of a proportional relationship is equivalent to the constant of proportionality (and therefore, the slope).
Finding the Unit Rate graphically and algebraically:
- Look for the x-value of 1: On the graph of a proportional relationship, the y-coordinate of the point (1,y) represents the unit rate.
- Use any point: For any point (x,y) on the graph of a proportional relationship, the ratio y/x equals the unit rate. If a student sees the point (4,12) on a proportional graph, calculating 12/4 reveals a unit rate of 3.
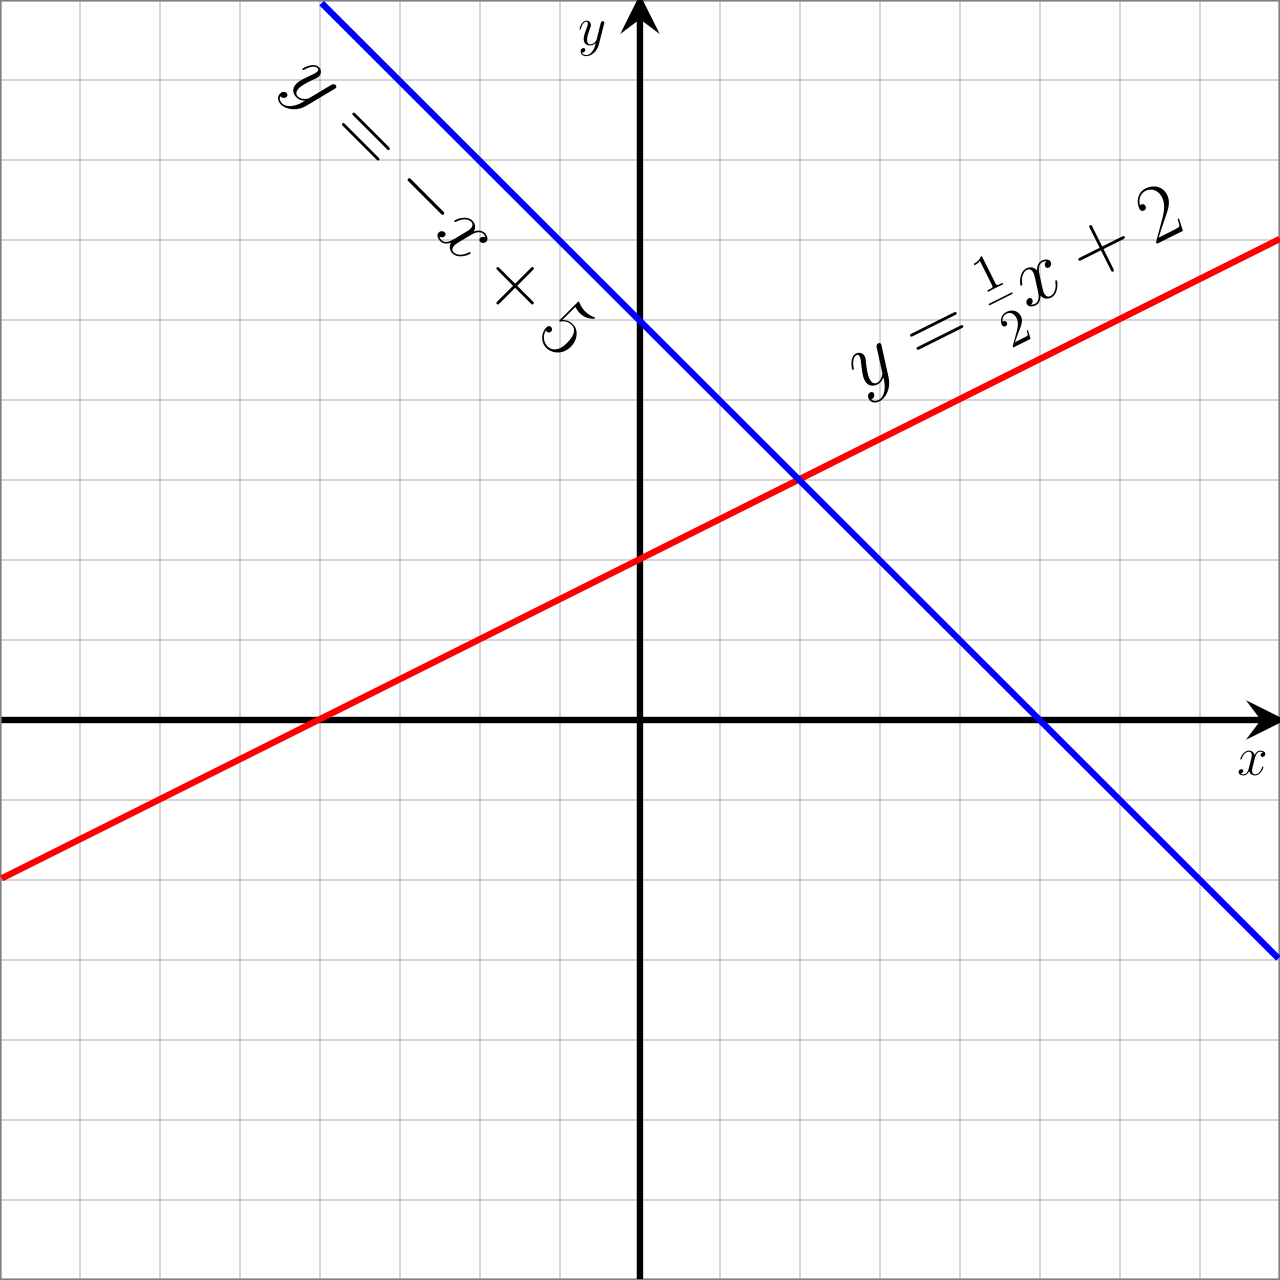
When multiple linear functions interact on a single coordinate plane, their slopes dictate their geometric relationship.
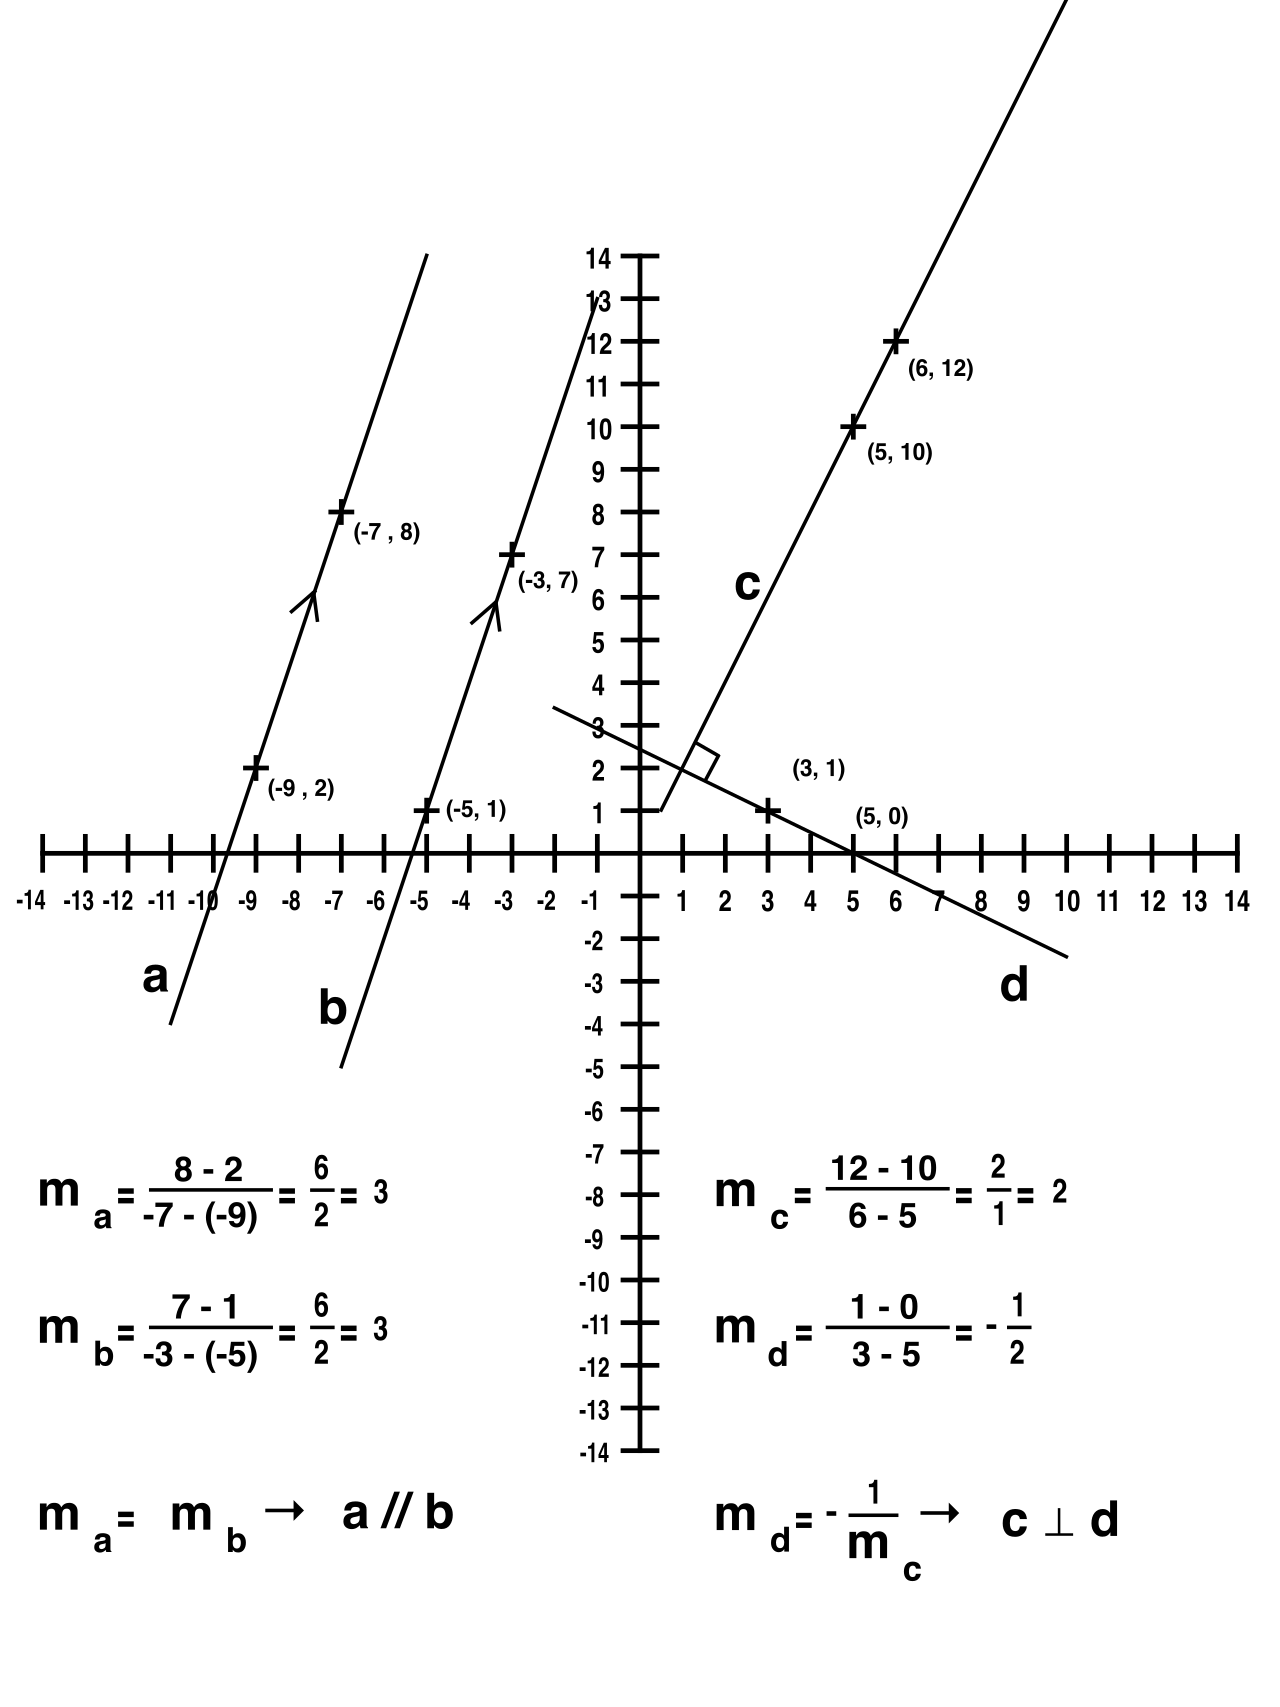
- Parallel Lines: Parallel lines on a coordinate plane have identical slopes. If two runners are moving at the exact same constant speed but start at different positions, their distance-over-time graphs will never intersect.
- Perpendicular Lines: Perpendicular lines on a coordinate plane have slopes that are negative reciprocals of one another. If one line has a slope of 2/3, a line perpendicular to it must have a slope of −3/2. This mathematical inversion creates a precise 90-degree intersection.
As a teacher, you will need to rapidly identify and extract intercepts and slopes depending on how a linear equation is presented. The form chosen is usually the one most convenient for the information initially available.
| Equation Form | Formula | Key Extraction Facts |
|---|---|---|
| Slope-Intercept Form | y=mx+b | The coefficient m represents the slope of the line.<br><br>The constant term b represents the y-coordinate of the y-intercept. |
| Standard Form | Ax+By=C | Often used to model constraints (e.g., buying x child tickets and y adult tickets for a total of C).<br><br>The slope of the line is equal to −A/B.<br><br>The y-coordinate of the y-intercept is equal to C/B.<br><br>The x-coordinate of the x-intercept is equal to C/A. |
| Point-Slope Form | y−y1=m(x−x1) | Often used when modeling experimental data where a specific moment in time is recorded alongside the rate of change.<br><br>The variables x1 and y1 represent the coordinates of a specific known point on the line. The variable m remains the slope. |
Summary for Praxis 5164 Application
When you approach selected-response questions or numeric-entry items regarding linear functions, always look for the hidden givens. A prompt mentioning "the ground" or "empty" is testing your knowledge of the x-intercept (y=0). A prompt mentioning an "initial fee" or "starting balance" is testing the y-intercept (x=0). If the problem states "per unit," it is handing you the slope. Master these translations between narrative text, algebraic form, and graphing calculator displays, and you will teach your future students to see the invisible geometry of constant change that surrounds them every day.