Measures of Central Tendency and Dispersion
Not sure you’re ready?
Take the ~3-minute readiness diagnostic and see where you stand.
Imagine looking at the test scores of a middle school pre-algebra class: twenty-four students score brilliantly, hovering around 85%, while one student, having slept through the exam, scores a zero. If we summarize the class by simply summing the scores and dividing by twenty-five, that solitary zero artificially pulls the class average down to an 81%. The entire narrative of the classroom's achievement is warped by a single data point. To understand data—to truly capture the mathematical story hiding within a chaotic list of numbers—we cannot rely on a single perspective. We must measure exactly where the data centers itself, and precisely how far it scatters from that center. For an aspiring middle school mathematics teacher, mastering these statistical concepts is not just about passing an exam. It is the fundamental language you will use to evaluate student performance, to decipher educational research, and to teach young minds how to navigate a data-driven world.
When we talk about the "average" in everyday language, we are usually grasping for a measure of central tendency—a single value that represents the typical entry in a dataset. But "typical" can mean very different things depending on the mathematical tool we deploy.
The Arithmetic Mean: The Fulcrum
The arithmetic mean is the sum of all values in a dataset divided by the total number of values. If you picture a number line as a seesaw, with a block placed at every data point, the mean acts as the mathematical balancing point of a data distribution. It is the exact location where the fulcrum must sit so the seesaw does not tip.
Because of this physical reality, the mean is highly sensitive to extreme values or outliers in a dataset. Just as a small child sitting far out on a seesaw can balance a heavy adult sitting close to the center, one massive outlier will drag the mean far away from the bulk of the data.
Teaching Connection: A standard arithmetic mean is actually a specific type of weighted average where all values have an equal weight of one. When you calculate a simple test average, you are implicitly saying every test holds exactly the same importance.
The Weighted Average
In your future classroom, you will rarely treat all assignments equally. Homework might be worth 20% of a final grade, quizzes 30%, and exams 50%. Here, you need a weighted average, which is calculated by multiplying each data value by its assigned weight and summing these products.
Crucially, the sum of the weighted products in a weighted average calculation must be divided by the sum of all the weights. (In a grading system where percentages add up to 100%, or 1.0, you are conveniently dividing by 1, which is why we often skip this step in our heads. But if a student misses a category, the division becomes mathematically critical!)
The Median: The Physical Middle
If the mean is the balancing point, the median is the midpoint. The median is the middle value of a dataset when the values are ordered from least to greatest. It elegantly divides an ordered dataset into two equal halves.
Finding it depends on your sample size:
- The median of a dataset with an odd number of values is the exact middle number in the ordered list.
- The median of a dataset with an even number of values is the arithmetic mean of the two middle numbers in the ordered list.
Because the median only cares about order, not magnitude, the median is a resistant measure of center because extreme values do not significantly change it. If the highest test score in your class jumps from a 95 to a 100, the median does not move an inch.
The Mode: The Popular Choice
The mode is the value or values that appear most frequently in a dataset. Unlike the mean and median, the mode has unique behavioral quirks:
- A dataset can have zero modes if no value repeats.
- A dataset can have exactly one mode.
- A dataset can have more than one mode (bimodal or multimodal).
Most importantly for your exam, the mode is the only measure of central tendency that can be used to describe nominal categorical data. If you survey your students on their favorite transit method to school (bus, car, walk), you cannot calculate a mean or median "walk." You can only identify the mode.
Exam questions often test what happens to the mean when you alter an entire dataset. Think of this graphically:
- Addition: If you decide to curve an exam by giving every student a 5-point bonus, the entire distribution simply shifts 5 units to the right. Therefore, adding a constant to every value in a dataset increases the mean by that exact constant.
- Multiplication: If you convert a set of classroom fundraiser donations from dollars to cents, you are multiplying every value by 100. Consequently, multiplying every value in a dataset by a constant multiplies the mean by that exact constant. (If the mean donation was $5.00, it becomes 500 cents).
When we graph data, the tug-of-war between the mean and the median reveals the shape of the distribution.
| Distribution Shape | Visual Characteristic | Relationship of Center | Best Measure of Center |
|---|---|---|---|
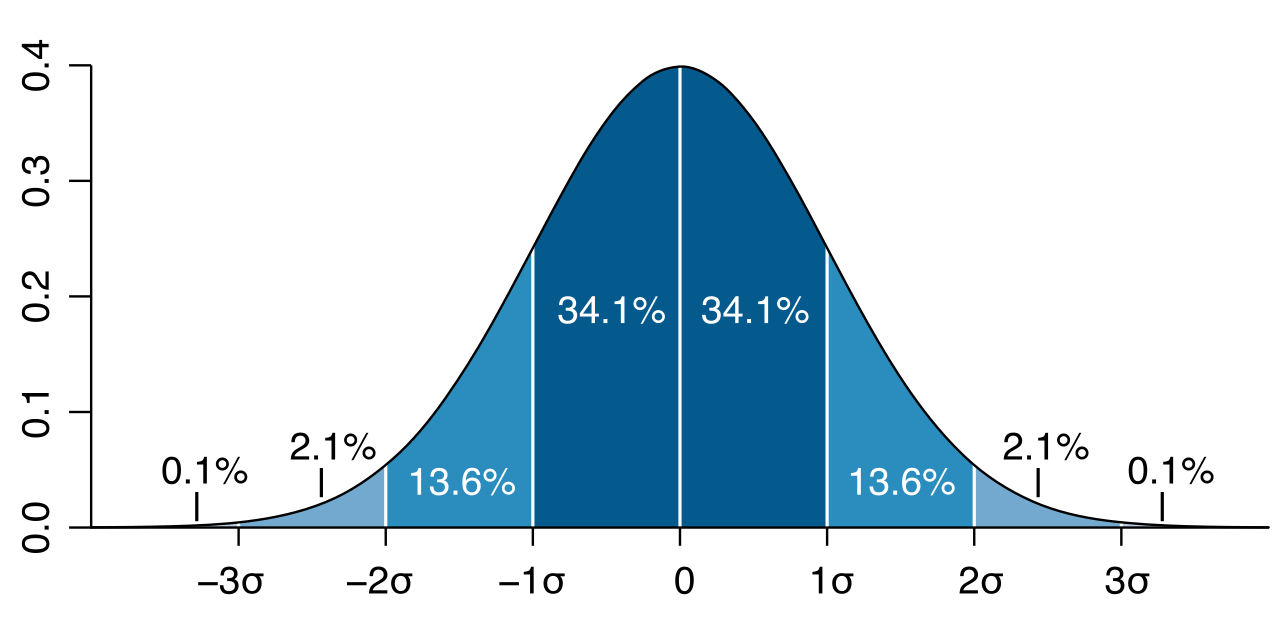
| Perfectly Symmetric | Both sides mirror each other (like a bell curve). | The mean and the median are approximately equal. | Mean (Preferred for roughly symmetric distributions without outliers). |
| Right-Skewed | A long tail stretches out to the right (high positive values). | The mean is generally greater than the median. | Median (Preferred for skewed distributions). |
| Left-Skewed | A long tail stretches out to the left (low negative values). | The mean is generally less than the median. | Median (Preferred for skewed distributions). |
Why does this happen? Remember that the mean is the balancing point. In a right-skewed distribution, the massive values in the long right tail exert incredible leverage, dragging the mean to the right. The median, being resistant, stays anchored near the bulk of the data.
Knowing the center is only half the battle. If two classes both have an average test score of 75%, but Class A's scores range from 70% to 80% while Class B's range from 50% to 100%, the teaching strategies required for each room are vastly different. We measure this scatter using dispersion.
The Range
The range of a dataset is the mathematical difference between the maximum value and the minimum value. It provides a single number representing the total continuous span of a dataset.
However, it is a highly flawed metric for overall scatter. The range is highly sensitive to outliers because the range relies exclusively on the most extreme values. One student scoring a zero wrecks the range for an otherwise tightly clustered class.
Standard Deviation and Mean Absolute Deviation (MAD)
To truly understand dispersion, we must measure how far, on average, the data points stray from the center.
- Standard Deviation: This measures the typical or average distance of data points from the mean of a dataset. It is mathematically rigorous and heavily featured on graphing calculator outputs (often denoted as σx or Sx).
- Mean Absolute Deviation (MAD): Highly tested at the middle school level, the mean absolute deviation is the average of the absolute distances of each individual data point from the mean.
Both metrics tell a similar story. A smaller mean absolute deviation indicates that the data points in a set are clustered closely around the mean. Conversely, a larger mean absolute deviation indicates that the data points in a set are spread further out from the mean.
Rule of Thumb for Dispersion: The standard deviation or mean absolute deviation is the preferred measure of spread for roughly symmetric distributions without outliers (pairing naturally with the mean).
If we prefer the median for skewed data, what is its partner for measuring spread? The answer lies in dividing the data into fractions.
Quartiles divide an ordered dataset into four equal parts.
- The first quartile (Q1) represents the median of the lower half of an ordered dataset.
- The second quartile (Q2) is exactly equal to the median of the entire dataset.
- The third quartile (Q3) represents the median of the upper half of an ordered dataset.
From these quartiles, we derive the interquartile range (IQR), which is the mathematical difference between the third quartile and the first quartile (Q3−Q1).
The interquartile range measures the statistical spread of the middle fifty percent of a data distribution. Because it completely ignores the lowest 25% and the highest 25% of the data, the interquartile range is a resistant measure of spread because extreme values do not affect the middle fifty percent of the data. Consequently, the interquartile range is the preferred measure of spread for describing skewed distributions.
The Genius of John Tukey
How do we visualize this middle fifty percent? Statistician John Tukey introduced the box plot and formalized the concept of the interquartile range in his 1977 book Exploratory Data Analysis.
A box plot (or box-and-whisker plot) is a visual representation of a data distribution based on a five-number summary. This summary consists of the:
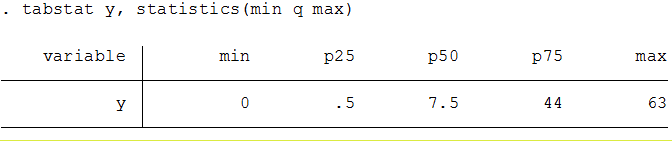
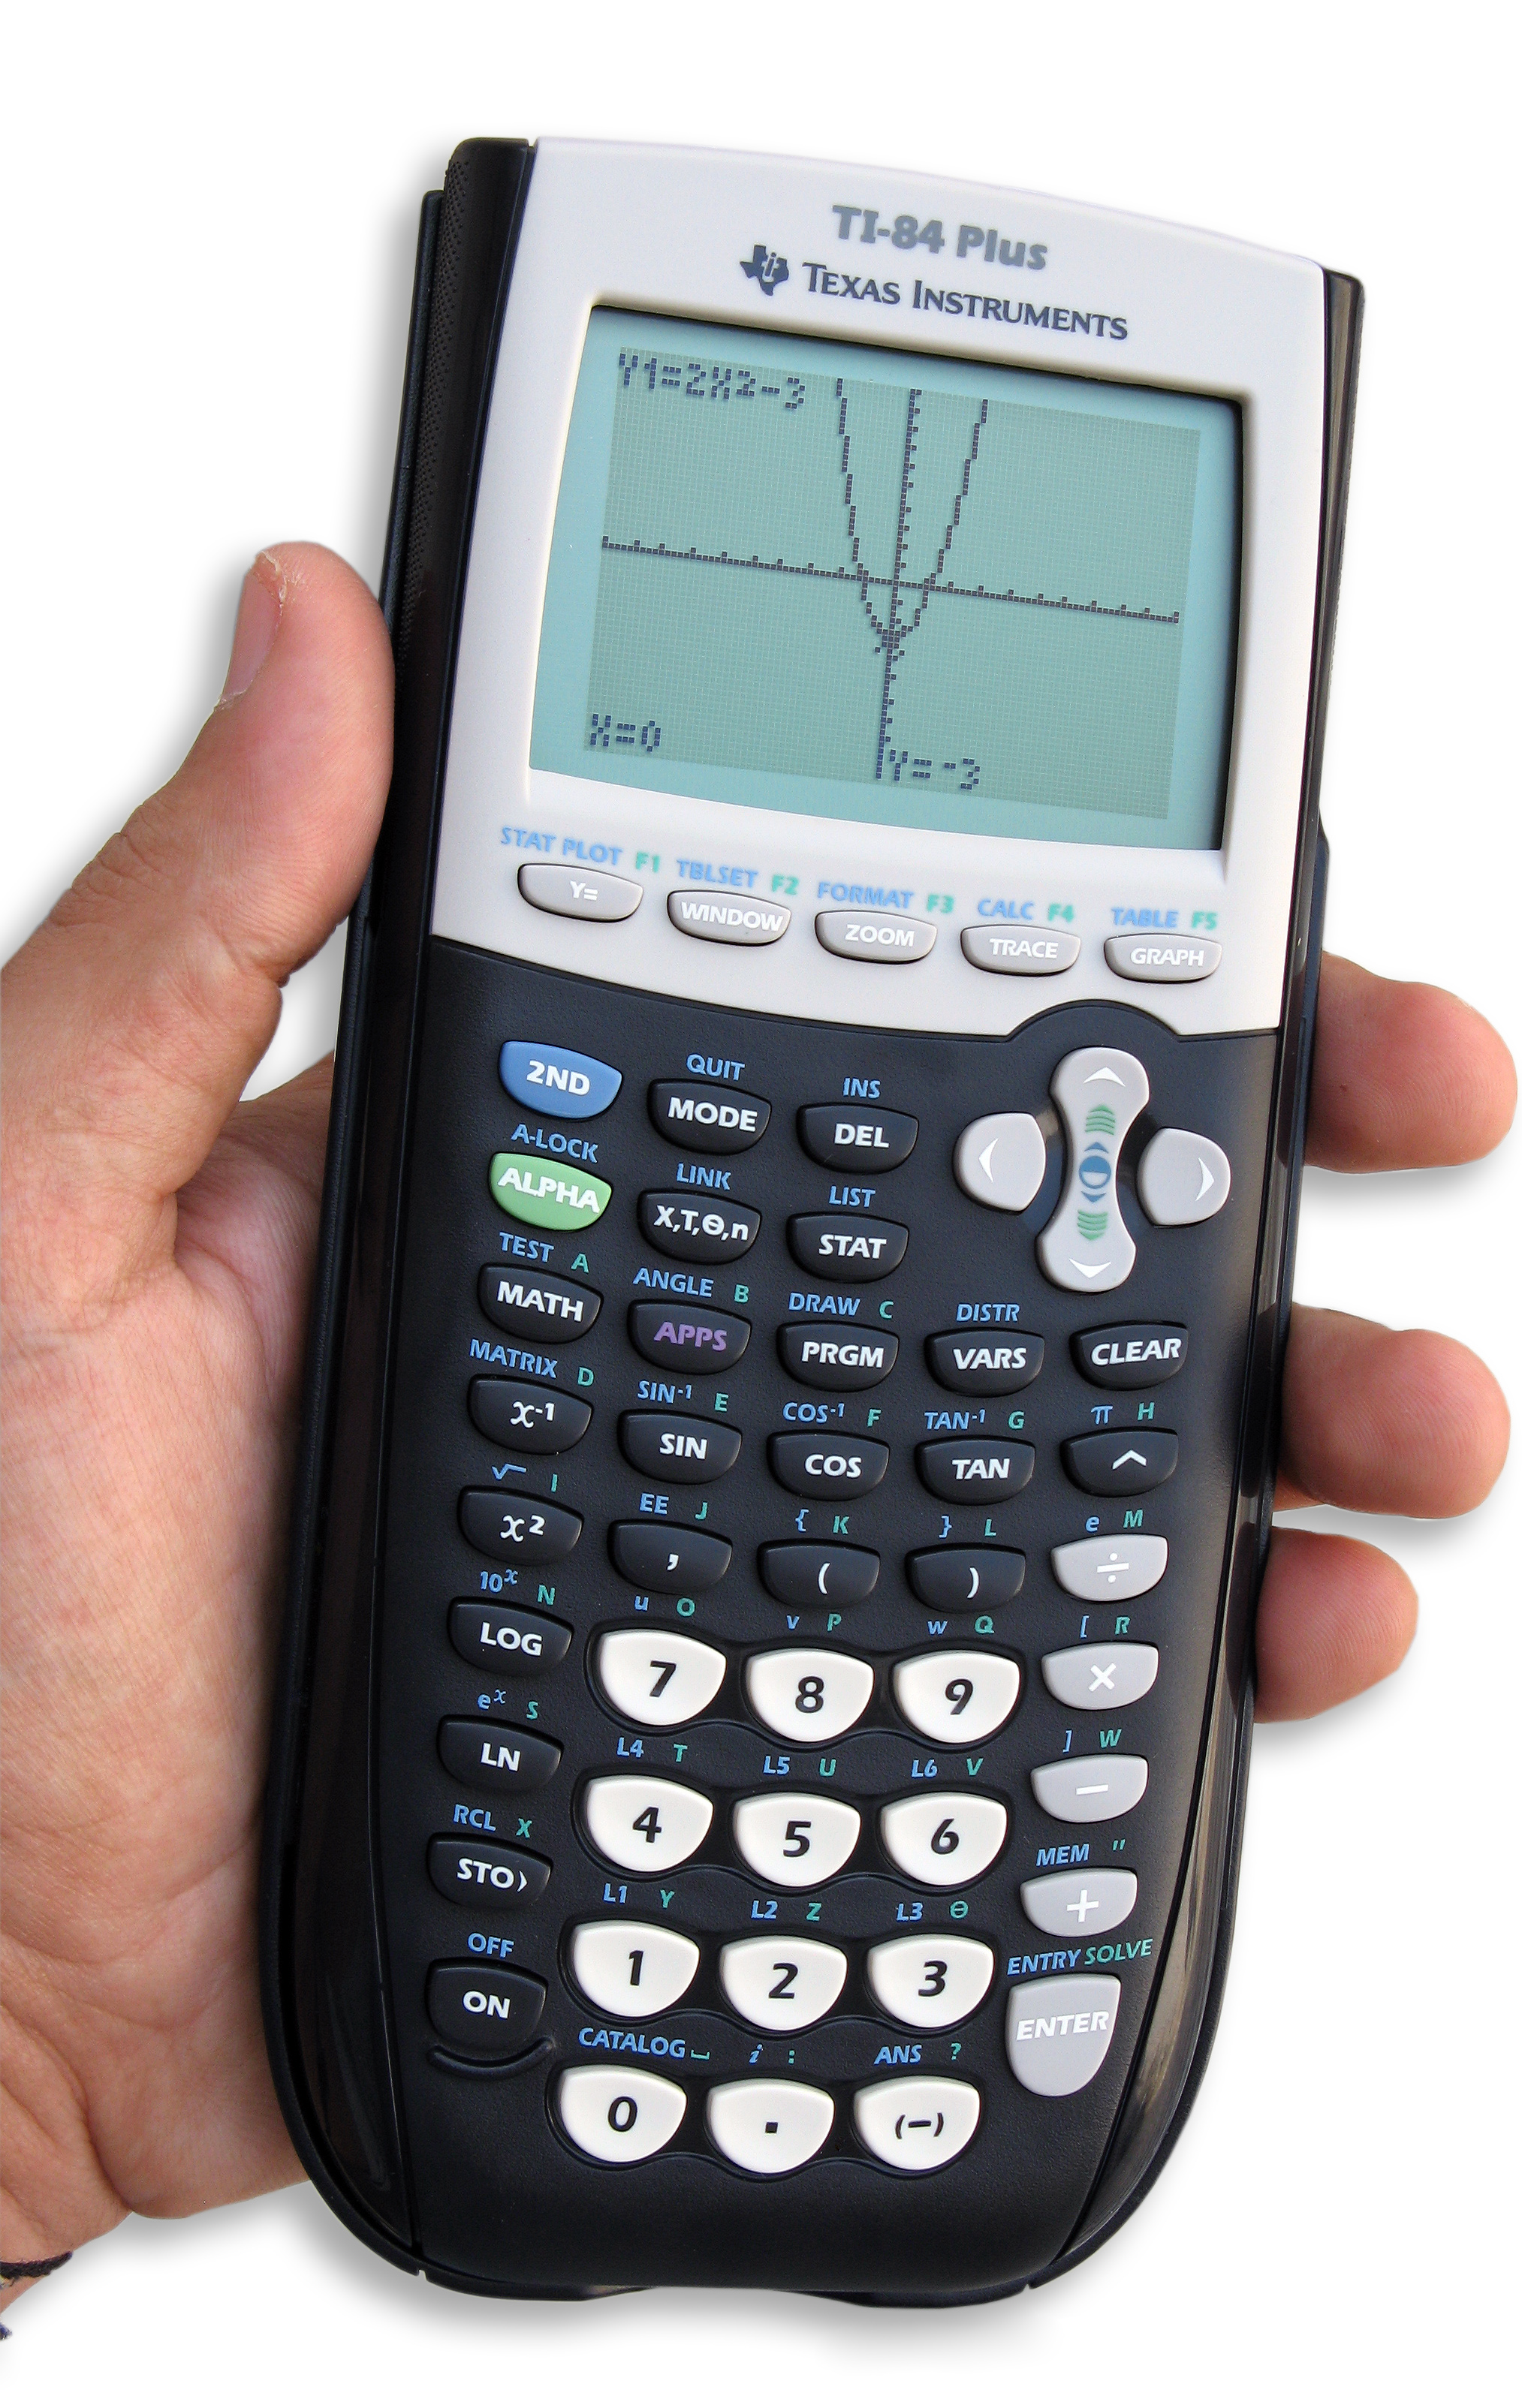
When you use the 1-Var Stats function on an on-screen graphing calculator during your Praxis exam, it will output this exact five-number summary at the bottom of the list. The "box" is drawn from Q1 to Q3 (representing the IQR), with a line at the median, and "whiskers" extending to the minimum and maximum.
We have used the word "outlier" repeatedly, but in mathematics, we do not rely on "gut feeling" to determine if a number is weird. An outlier is defined formally as a data point that falls significantly outside the overall pattern of a distribution.
Tukey gave us a strict mathematical boundary to identify these rogue points, heavily tested on the Praxis: The 1.5 times IQR rule.
- The 1.5 times interquartile range rule identifies low outliers as values falling below the first quartile minus 1.5 times the interquartile range.
- Lower Fence Formula: Q1−1.5(IQR)
- The 1.5 times interquartile range rule identifies high outliers as values falling above the third quartile plus 1.5 times the interquartile range.
- Upper Fence Formula: Q3+1.5(IQR)
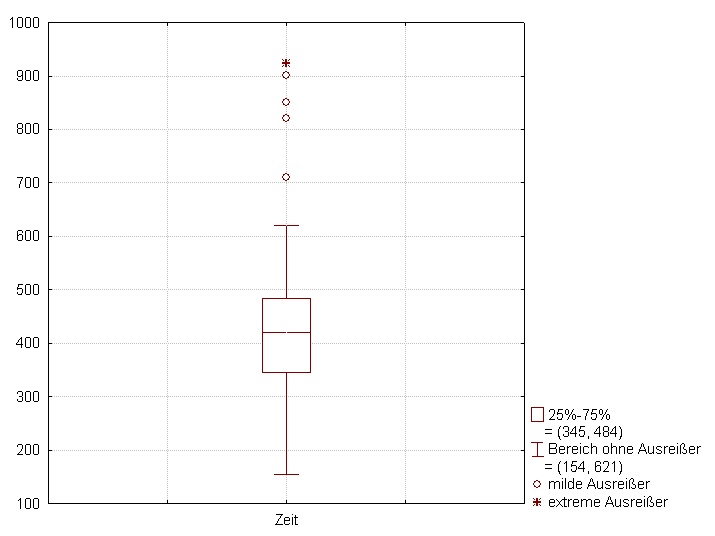
Any data point sitting strictly outside these "fences" is officially classified as an outlier. When drawing a modified box plot, these outliers are plotted as individual dots, and the whiskers only extend to the highest and lowest values that are not outliers.
Bringing It Into the Classroom
When you stand in front of your middle school students, you are not just teaching them formulas. You are teaching them how to interrogate reality. If an advertisement claims "the average starting salary is $80,000," your students will be equipped to ask: "Is that the mean or the median? Are there massive outliers skewing that number?"
By mastering the precise behavior of the mean, median, mode, range, and IQR, you are arming yourself with the statistical toolkit required to read your classroom data effectively, pass your licensure exam decisively, and shape the analytical thinkers of tomorrow.