Proportional Relationships and Percents
Not sure you’re ready?
Take the ~3-minute readiness diagnostic and see where you stand.
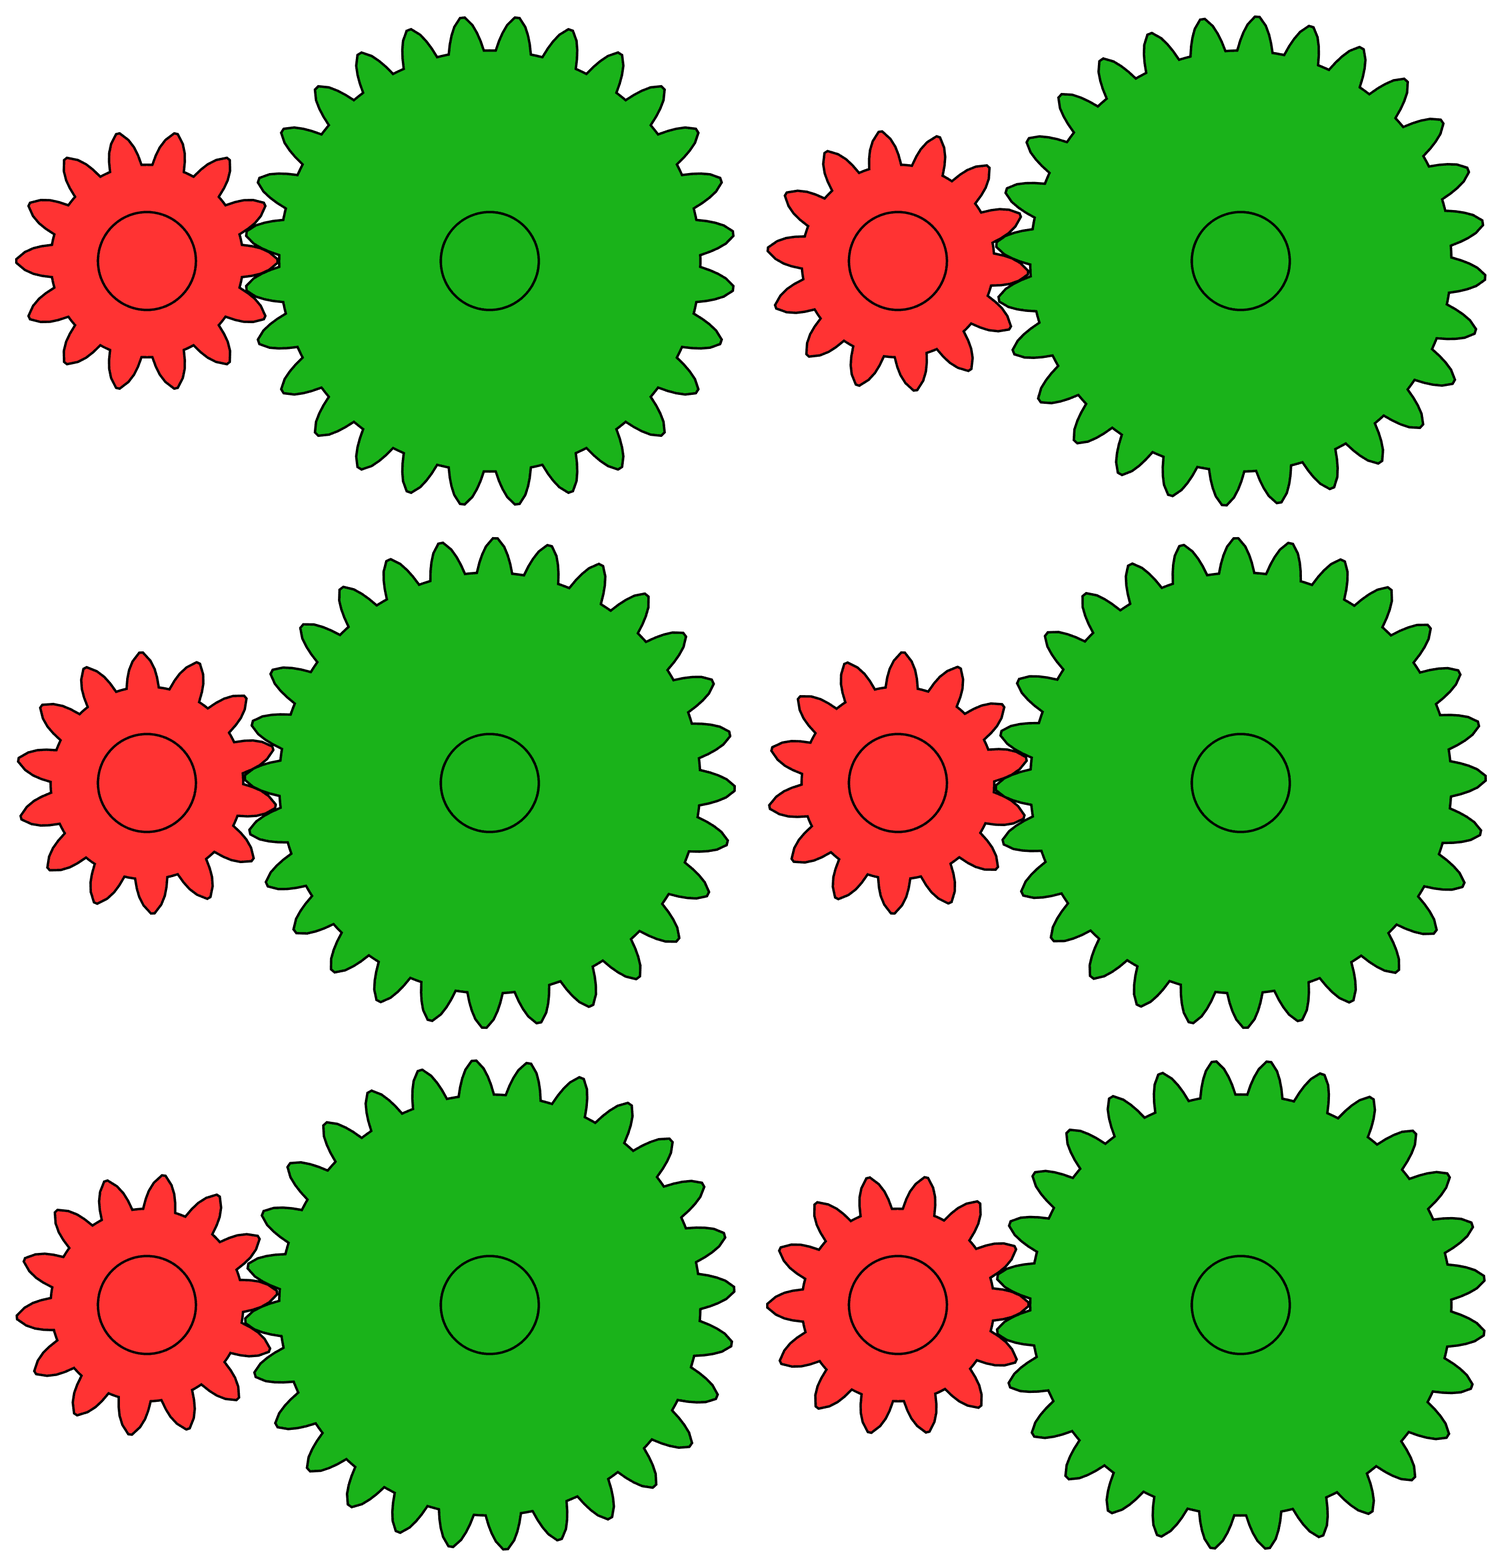
Consider the geometry of a shadow cast on a wall, the mechanics of a gear train, or the scaling of a chemical mixture from a test tube to an industrial vat. If the fundamental relationships between the quantities fluctuate, the system collapses. The shadow distorts, the gears bind, the reaction fails. The physical universe relies on quantities moving in lockstep, maintaining perfect equilibrium as they scale. In mathematics, we call this a proportional relationship. For a middle school student, this topic is the great threshold where arithmetic matures into algebraic and functional thinking. They are no longer merely calculating isolated answers; they are analyzing the invisible, constant ratios that govern physical space and financial reality.
As a mathematics educator, your mastery of proportionality and percents must be absolute. You must be able to pivot seamlessly between a geometric scale model, an algebraic equation, and the financial reality of compound interest. This guide maps the canonical architecture of proportions and percents, equipping you to dismantle misconceptions and illuminate these concepts for your students.
Before we construct equations, we must define the foundation. A proportional relationship exists between two variable quantities when they maintain a constant ratio. No matter how large or small the quantities become, their mathematical relationship to one another never wavers.
To document these relationships, we use ratios. Ratios can be written numerically using a fraction bar, written using a colon symbol between the two compared quantities (e.g., y:x), or written using the English word 'to' between the two compared quantities (e.g., y to x). When we assert that two distinct ratios are entirely equivalent, we create a proportion, which is simply a mathematical equation stating that equality (e.g., 32=64).
If we have an unknown value within two equivalent proportional ratios, we use cross-multiplication as an algebraic method to solve for it.
The Constant of Proportionality and Unit Rates
At the heart of every proportional relationship is the constant of proportionality. This is the unchanging ratio between two variables in a proportional relationship. It is conventionally represented by the lowercase variable k.
The Constant of Proportionality (k) In a proportional relationship between a dependent variable y and an independent variable x, the constant of proportionality k can be calculated by dividing the dependent variable y by the independent variable x. Therefore, k=xy.
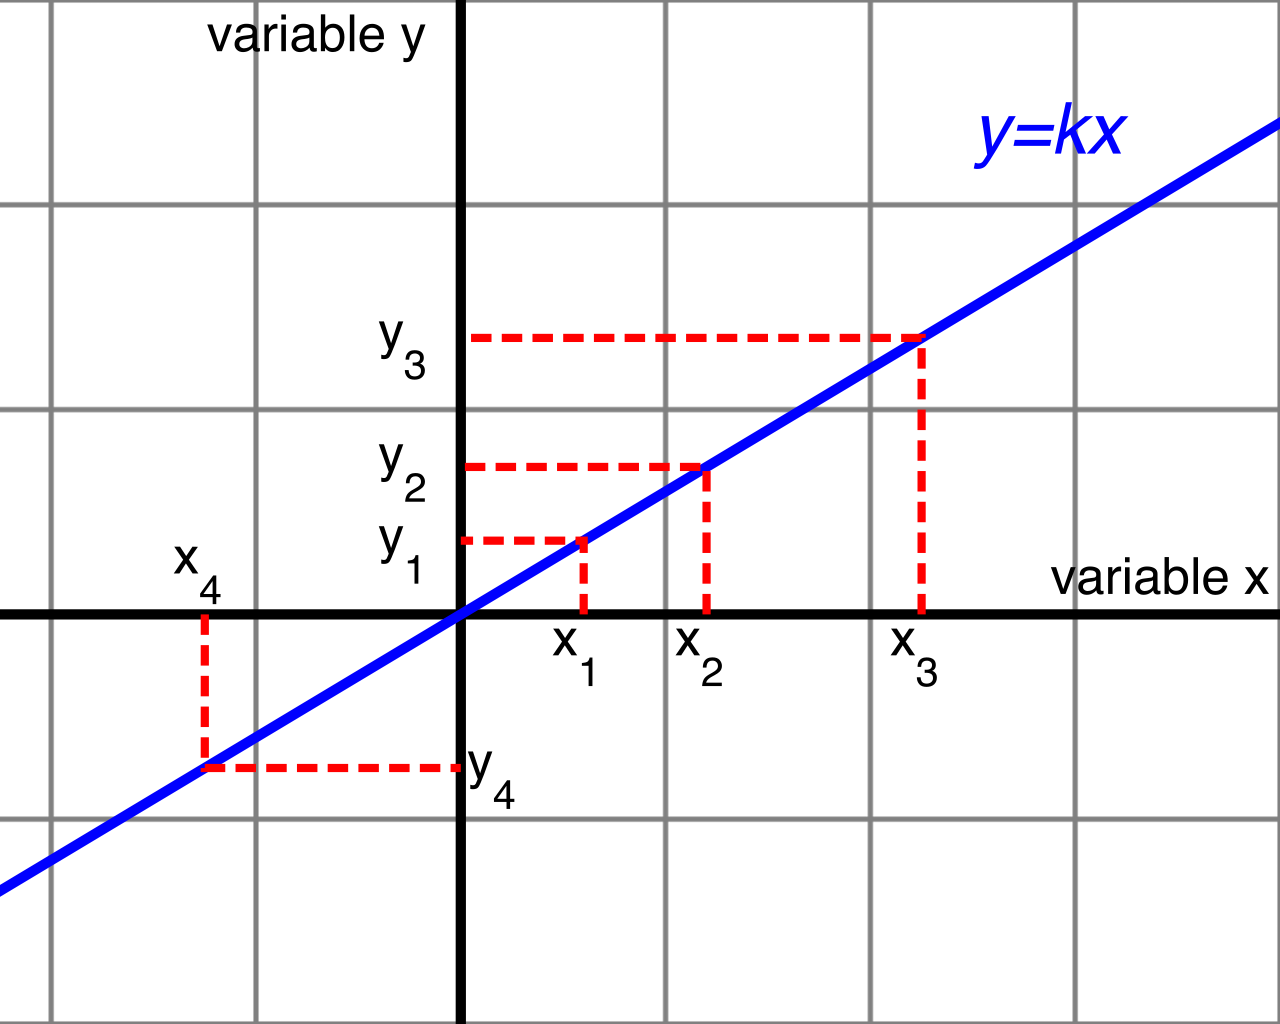
Because this ratio never changes, the relationship is expressed by the algebraic equation y=kx. In the language of algebra, the specific mathematical term representing a direct proportional relationship is direct variation.
The constant of proportionality is mathematically magnificent because it is numerically equivalent to the unit rate of a proportional relationship. A unit rate is a mathematical comparison of two different quantities where the second quantity is exactly one unit (for example, miles per 1 hour or dollars per 1 ounce).
Students will frequently encounter unit rates hidden inside complex fractions. A complex fraction is a fraction containing another fraction in its numerator, a fraction containing another fraction in its denominator, or both.
- How to solve: Unit rates can be calculated from complex fractions by multiplying the numerator fraction by the reciprocal of the denominator fraction.
Why does this matter to a middle schooler? Because it governs the economics of the grocery store. When comparing unit prices, the item with the mathematically lower unit price is considered the better financial value.
Constants in the Physical World
Constants of proportionality are not just abstract algebra; they are the invisible rules of reality.
- Physics: Distance is directly proportional to travel time when an object is moving at a perfectly constant speed. Here, the constant speed is k.
- Measurement: The mathematical conversion factor between two different units of measurement serves as a direct constant of proportionality (e.g., 2.54 centimeters per 1 inch).
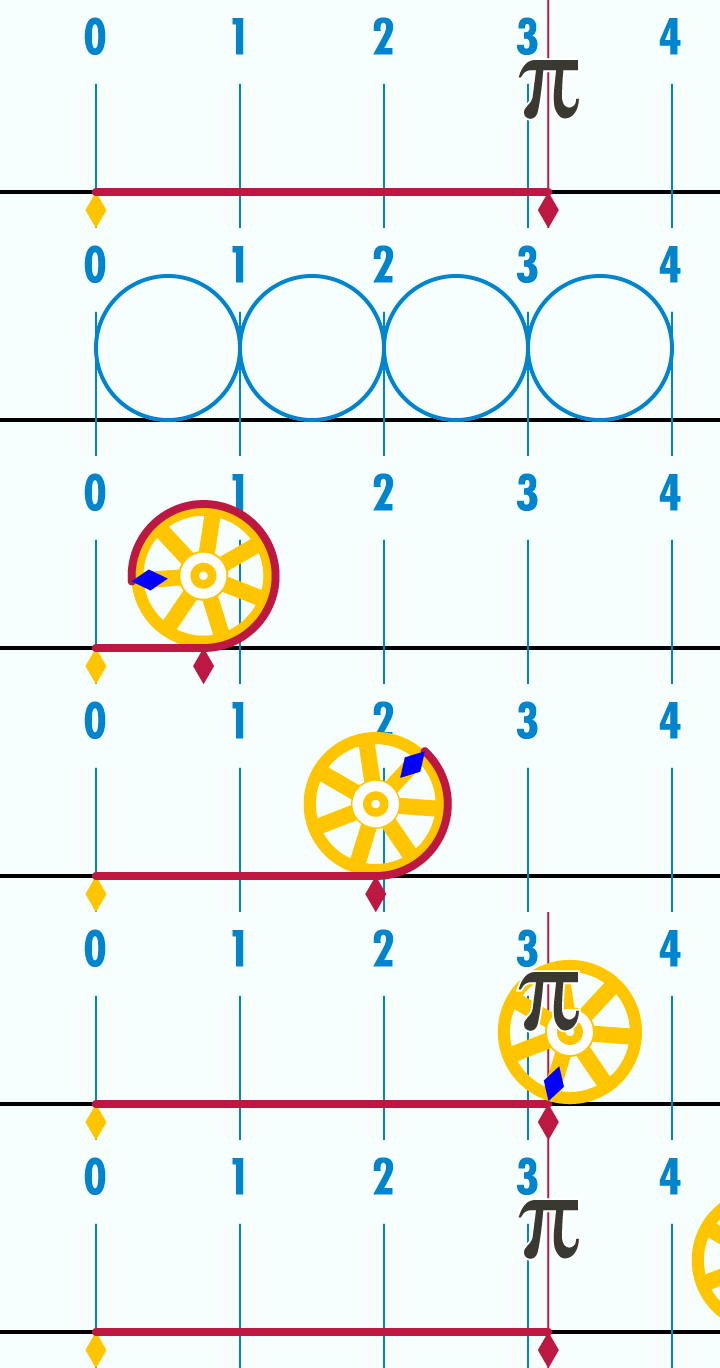
- Geometry: The constant of proportionality relating the geometric circumference of a circle to its diameter is Pi (π).
When teaching this, you must train students to recognize proportional relationships across multiple representations, particularly when utilizing an on-screen graphing calculator.
In a Table: A table of variables represents a proportional relationship if the quotient of the dependent and independent variables is constant across all rows. If even a single row yields a different quotient, the relationship is not proportional.
On a Graph: When plotted on a coordinate plane, the graph of any proportional relationship is strictly a straight line. Furthermore, the graph of a proportional relationship always passes through the geometric origin.
The Origin and the Unit Rate
- The origin of a coordinate plane is the ordered pair (0,0). On a proportional graph, the origin point indicates that zero units of the independent variable correspond to exactly zero units of the dependent variable. (If you work zero hours, you earn zero dollars).
- On a graph of a proportional relationship, the specific coordinate point (1,r) identifies the unit rate r.
The Inverse Reality: Inverse Proportionality
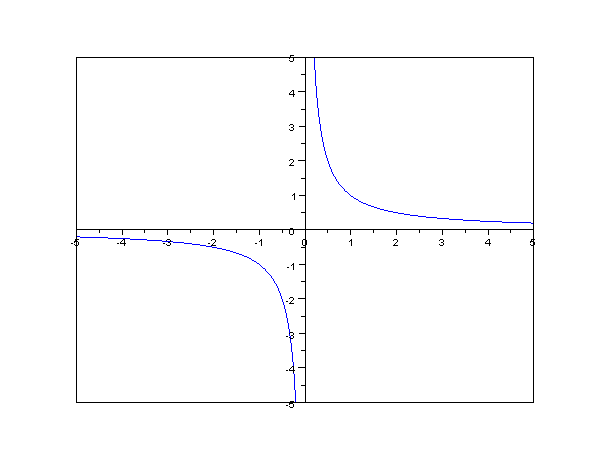
What happens when quantities move in opposition? In an inversely proportional relationship, the product of the two variables is always a constant mathematical value (xy=k).
In an inversely proportional relationship involving positive quantities, one quantity decreases at the exact rate the other quantity increases. (Think of driving to a destination: as your speed increases, the time required to arrive decreases). When your students plot this on an on-screen graphing calculator, they will see that the geometric graph of an inversely proportional relationship forms a specific curve called a hyperbola, sharply contrasting with the strict straight line of direct variation.
Proportionality is the engine of similarity in geometry. When we resize a shape without distorting it, we apply a scale factor, which is the ratio of the length of a side of one figure to the length of the corresponding side of a similar figure.
The magnitude of the scale factor dictates the outcome:
- A scale factor strictly greater than 1 creates an enlarged version of an original geometric figure.
- A scale factor strictly between 0 and 1 creates a proportionally reduced version of an original geometric figure.
- A scale factor of exactly 1 produces a figure mathematically congruent to the original figure.
These factors map the physical world into human hands:
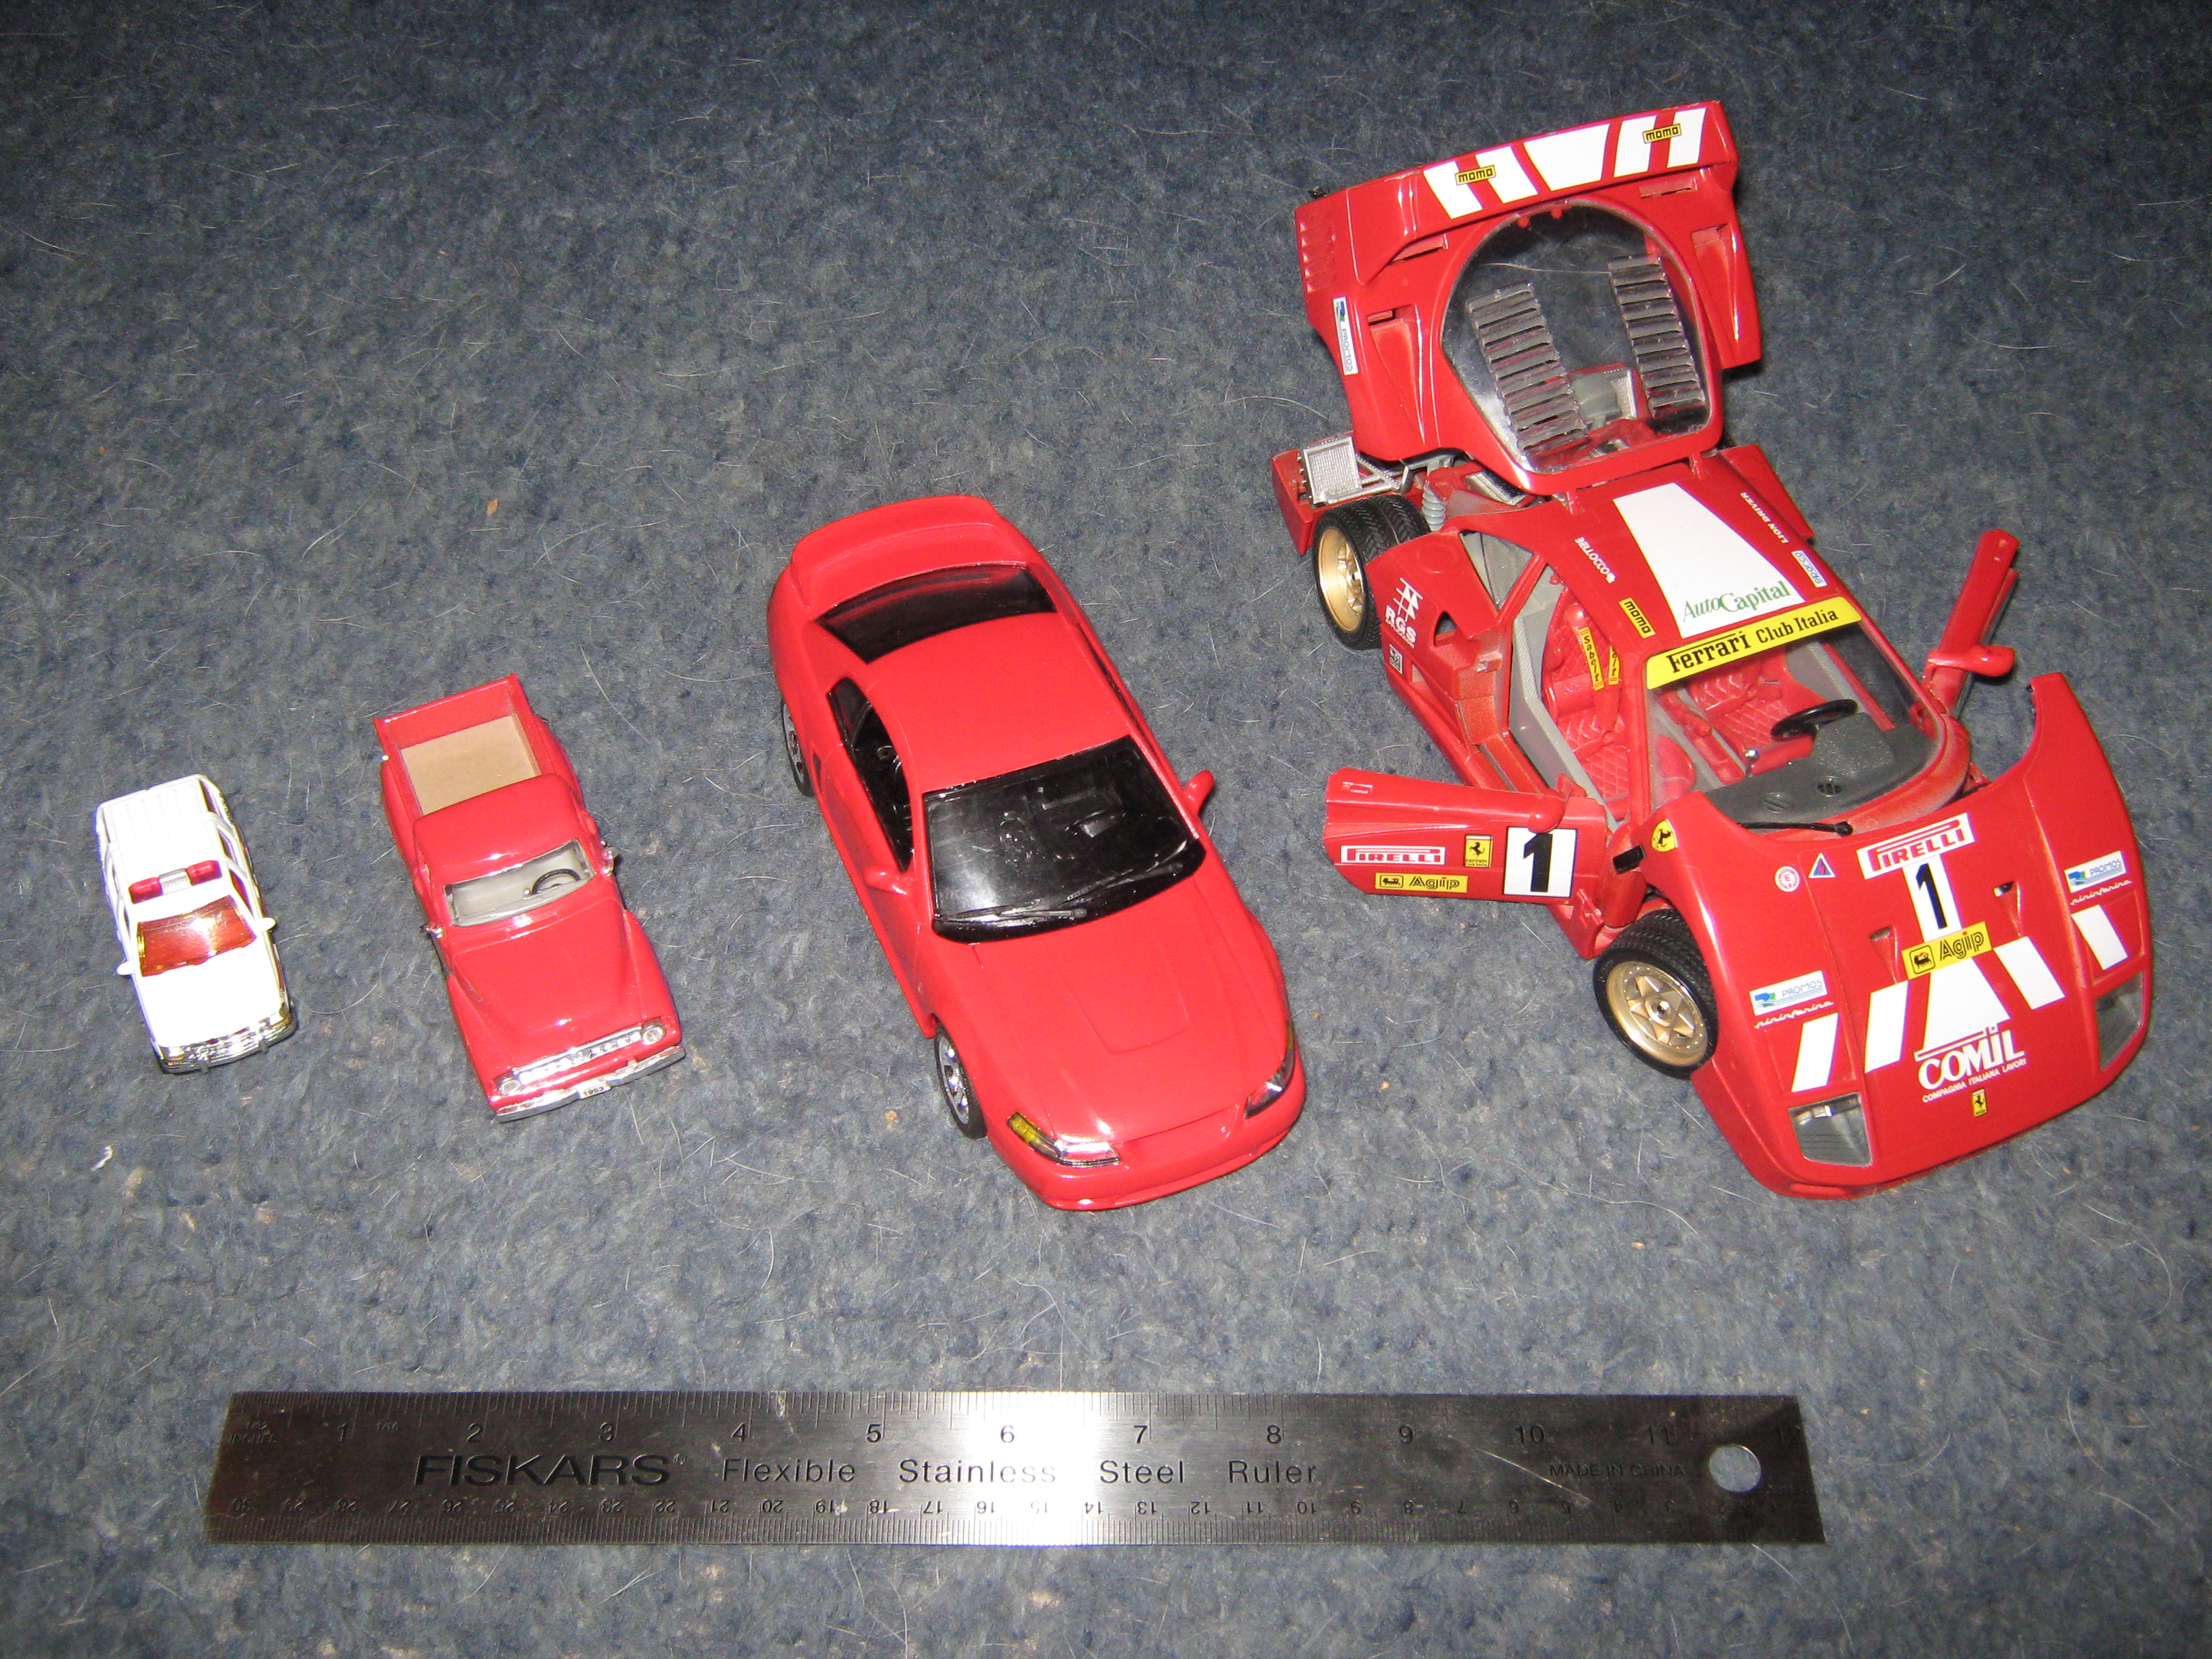
- A scale drawing is a proportional two-dimensional representation of an actual object (like an architectural blueprint).
- A scale model is a proportional three-dimensional representation of an actual object (like a globe or a model airplane).
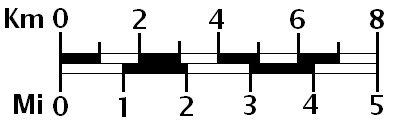
- The scale of a map is a ratio comparing the measured distance on the map to the actual physical distance on the ground.
The most ubiquitous application of proportionality in daily life is the percent. The word percent is derived from the Latin phrase per centum, which translates directly to "by the hundred." Therefore, a percent is a specialized ratio representing a specific part out of exactly one hundred. The mathematical percent symbol is denoted by %.
To translate between forms:
- To convert a decimal to a percent, the decimal value must be multiplied by 100.
- To convert a percent to a decimal, the numerical percent value must be divided by 100.
There are two primary frameworks for solving percent problems, both of which you must master:
- The Percent Equation: This defines the partial amount as being equal to the percent expressed as a decimal multiplied by the whole amount (Part=Decimal×Whole).
- The Percent Proportion: This is an equation setting the ratio of the part to the whole equal to the percent value divided by 100 (WholePart=100%).
Percent Change, Difference, and Error
Do not conflate these three distinct concepts. They are fundamentally different tools for different scenarios.
1. Percent Change Percent change is the ratio of the absolute amount of change to the original amount expressed as a percentage. The percent change formula requires dividing the absolute difference between the new and original values by the original starting value.
- A percent increase happens when the final measured value is strictly greater than the initial starting value.
- A percent decrease happens when the final measured value is strictly less than the initial starting value.
Intuition Check: A one hundred percent increase of any positive quantity exactly doubles the original starting quantity. Conversely, a fifty percent decrease of any positive quantity exactly halves the original starting quantity.
2. Percent Difference Percent difference is the absolute difference between two numerical values divided by their mathematical average. Percent difference is utilized when comparing two values where neither value is definitively designated as the original starting value (for example, comparing the heights of two different mountains).
3. Percent Error In scientific measurement, absolute error is the positive mathematical difference between a flawed measured value and an actual correct value. Percent error is the ratio of the absolute error of a measurement to the exact actual value expressed as a percentage.
Middle school mathematics is where students first encounter the stark realities of commercial finance. You must equip them with algebraic shortcuts.
Markups, Taxes, Tips, and Commissions
- A markup is a specific financial amount added to an original wholesale cost to determine a final retail selling price. The final price after a markup can be found by multiplying the original price by one plus the markup rate expressed as a decimal.
- Sales tax is a percentage of a purchase price added to the total cost of an item or service. Like a markup, the total cost of an item including sales tax can be calculated by multiplying the original price by one plus the tax rate expressed as a decimal.
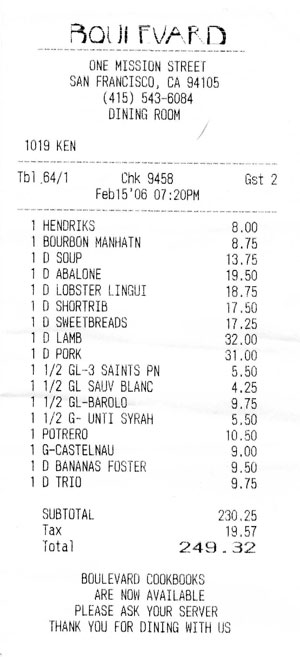
- A gratuity is a percentage of a service cost added to the final consumer bill. The term tip is mathematically synonymous with a gratuity.
- A commission is a fee paid to a salesperson calculated strictly as a percentage of their total sales amount.
Discounts and Markdowns
A discount is a specific financial amount subtracted from an original price to determine a final sale price. The term markdown is mathematically synonymous with a discount.
The Algebraic Shortcut: The final sale price of an item with a discount can be calculated by multiplying the original price by one minus the discount rate expressed as a decimal. If a jacket is 30% off, the buyer pays 70% of the price.
The Trap of Consecutive Discounts: A classic retail trick is the "additional percent off" sale. Adding two consecutive percent discount rates together does not yield the correct total overall discount percentage. A 20% off coupon applied to an item already discounted by 30% does not equal a 50% discount. This is because consecutive percent discounts are calculated sequentially based on each newly reduced price rather than the original starting price.
The Mechanics of Interest
Finally, we arrive at the cost of money itself.
Simple interest is an interest amount calculated strictly on the initial principal amount of a loan or investment. Because it ignores prior accumulated interest, simple interest grows an account balance at a constant linear mathematical rate.
The Simple Interest Formula The simple interest formula is Interest equals Principal multiplied by Rate multiplied by Time (I=PRT).
- The Principal represents the initial amount of money borrowed or invested.
- The Rate must be expressed as a decimal or fraction representing the annual interest rate.
- The Time represents the duration of the loan or investment strictly measured in years.
Students frequently make errors here by misinterpreting what the formula outputs. The simple interest formula calculates only the specific interest earned or owed rather than the total account balance. To find the end result, remember that the total accrued amount in a simple interest account is the sum of the initial principal and the accumulated simple interest.
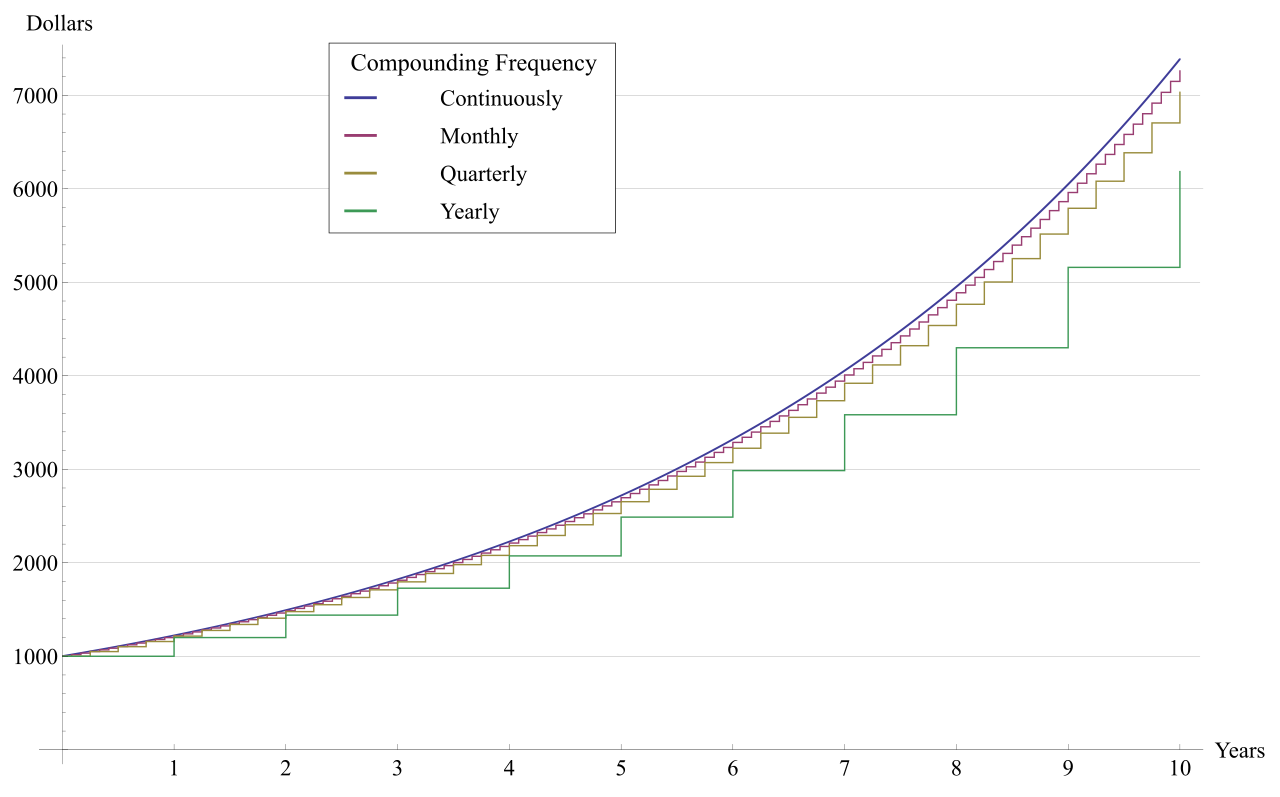
Contrast this directly with compound interest. Compound interest is calculated on the initial principal and also on the accumulated interest from previous periods. While simple interest is a straight, linear line on a graph, compound interest introduces students to the explosive curve of exponential growth.