Ratios and Rates
Not sure you’re ready?
Take the ~3-minute readiness diagnostic and see where you stand.
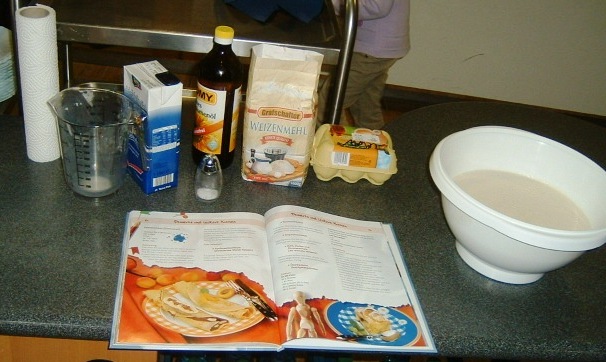
Consider a student attempting to scale up a recipe that calls for 3 cups of flour and 2 cups of sugar. If they apply additive thinking, they might simply add 1 cup to both ingredients, resulting in 4 cups of flour and 3 cups of sugar. The cake is ruined. The true relationship between the ingredients is not additive; it is a rigid, structural bond where the quantities must grow in lockstep. This shift from additive thinking to multiplicative thinking is the single most profound cognitive leap your middle school mathematics students will make. The language of ratios and rates provides the architecture for this crossing. By mastering these concepts, you are not merely teaching students how to compare numbers; you are handing them the algebraic keys to fractions, linear functions, geometry, and proportional reasoning.
To teach ratios effectively, we must first be precise about what they are. A ratio is a multiplicative comparison of two quantities. It tells us how much of one thing exists for every amount of another thing.
The order in which we express this comparison is mathematically rigid. The ratio of quantity A to quantity B is not equal to the ratio of quantity B to quantity A unless the two quantities are equal. If your classroom has 10 teachers and 200 students, a ratio of 10 to 200 is vastly different from a ratio of 200 to 10.
Expressions of Ratios
We can express this multiplicative relationship in three distinct ways:
- Mathematically, ratios can be expressed mathematically using a colon (e.g., 3:2).
- Verbally, ratios can be expressed verbally using the word 'to' (e.g., "3 to 2").
- Numerically, ratios can be expressed numerically using fraction notation (e.g., 23).
Parts and Wholes
When describing these relationships, you must train your students to distinguish between the subsets and the total group.
- A ratio can describe a part-to-part relationship between subsets within a whole. (e.g., 3 cups of flour to 2 cups of sugar).
- A ratio can describe a part-to-whole relationship comparing a subset to the entire group. (e.g., 3 cups of flour to 5 total cups of dry ingredients).
Crucial Pedagogical Shift: A percentage is a specific type of part-to-whole ratio where the whole is defined as exactly 100. Because percentages demand a part-to-whole framework, converting a part-to-part ratio to a percentage requires first calculating the total sum of the parts to represent the whole. If the ratio of cats to dogs in a shelter is 3:1, the whole is 4. The percentage of cats is not 13 (300%), but rather 43 (75%).
The Universal Constants of Ratios
Ratios govern the physical and geometric world. When your students study circles, they will discover that the ratio of the circumference of any Euclidean circle to its diameter is exactly equal to the mathematical constant pi (π). Similarly, in art and nature, the golden ratio is an irrational number approximately equal to 1.618. These are not arbitrary numbers; they are fundamental multiplicative relationships woven into the fabric of mathematics.
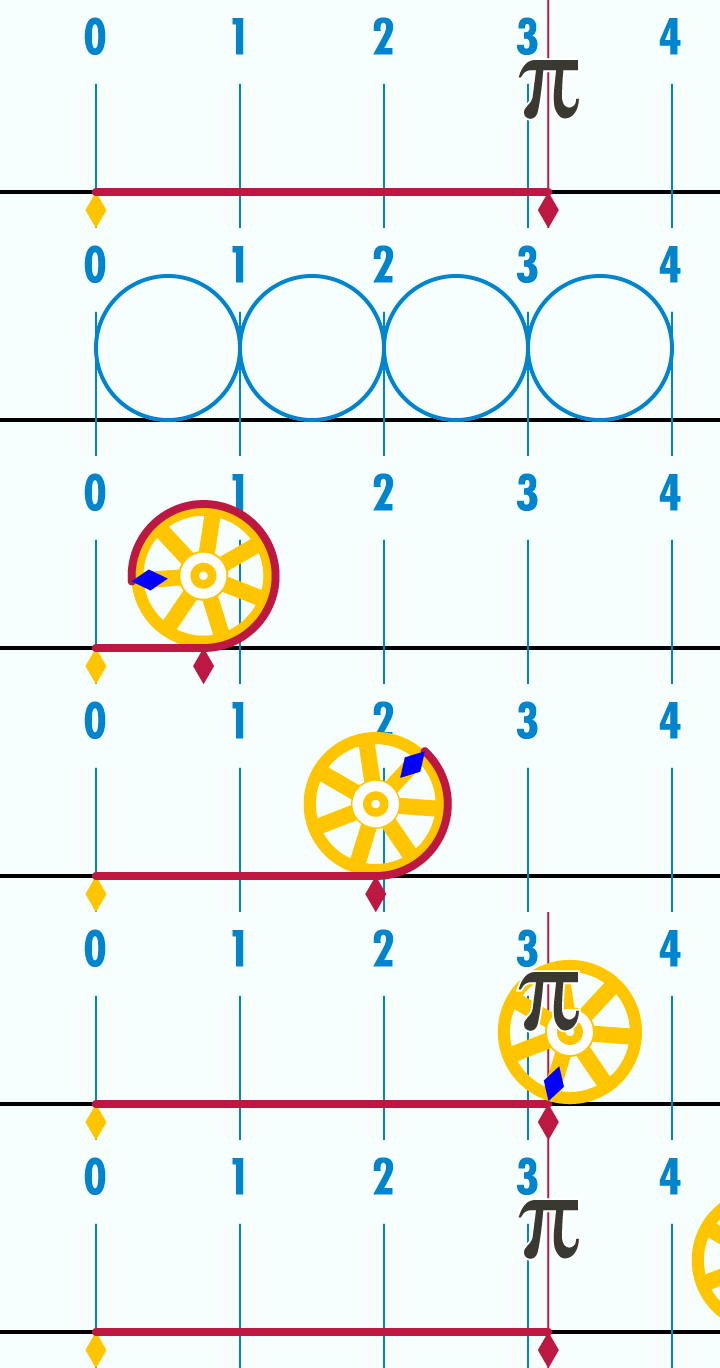
When we stretch ratios across different dimensions of measurement, we arrive at rates. A rate is a ratio that compares two quantities measured in different units.
If you drive 150 miles in 3 hours, you are comparing distance (miles) to time (hours). In the sciences, speed is a rate that compares the distance an object travels to the time elapsed, just as density is a physical rate that compares the mass of a substance to its volume.
The Unit Rate
The true utility of a rate emerges when we distill it down to a single unit. A unit rate is a rate that compares a quantity to exactly one unit of another quantity.
Linguistically, the word 'per' is used in unit rates to indicate a mathematical comparison to exactly one unit (e.g., miles per hour, dollars per pound). Mathematically, the unit rate associated with the ratio A to B is the numerical value of A divided by B.
One of the most practical applications of this concept for middle schoolers is financial literacy. Unit price is a unit rate representing the monetary cost of exactly one unit of an item. Consequently, dividing the total price of an item by the total quantity of the item yields the unit price. If 5 apples cost $4.00, dividing $4.00 by 5 yields a unit price of $0.80 per apple.
Navigating Complex Fractions
Real-world problems rarely hand us whole numbers. Students will encounter rates like walking 21 a mile in 41 of an hour. This brings us to complex fractions: fractions in which the numerator, the denominator, or both contain fractions.
Calculating the unit rate of quantities measured in fractions requires evaluating a complex fraction using division. 41 hour21 mile=21÷41=2 miles per hour
A core objective in middle school is recognizing when different-looking numbers tell the exact same story. Equivalent ratios are distinct ratios that express the same multiplicative relationship between two quantities. The ratio 2:3 and 4:6 are identical in their relational structure.
How do we generate them? The rule is beautifully simple:
- Multiplying both terms of a ratio by the same non-zero number generates an equivalent ratio.
- Dividing both terms of a ratio by the same non-zero number generates an equivalent ratio.
When we state that two ratios are equal, we are doing algebra. A proportion is an algebraic equation stating that two ratios are mathematically equivalent (e.g., 5x=104).
To solve these, students often learn shortcuts. Cross-multiplication is an algebraic method used to solve for an unknown term in a proportion. As a teacher, it is vital you explain why cross-multiplication works—it is merely a shortcut for multiplying both sides of the equation by a common denominator—lest it become a meaningless magic trick to your students.
This proportionality extends deeply into geometry. A scale factor is a ratio used to proportionally enlarge or reduce the size of a geometric figure. If a triangle is scaled by a factor of 3, every side length is multiplied by 3, generating equivalent ratios between the original and new sides.
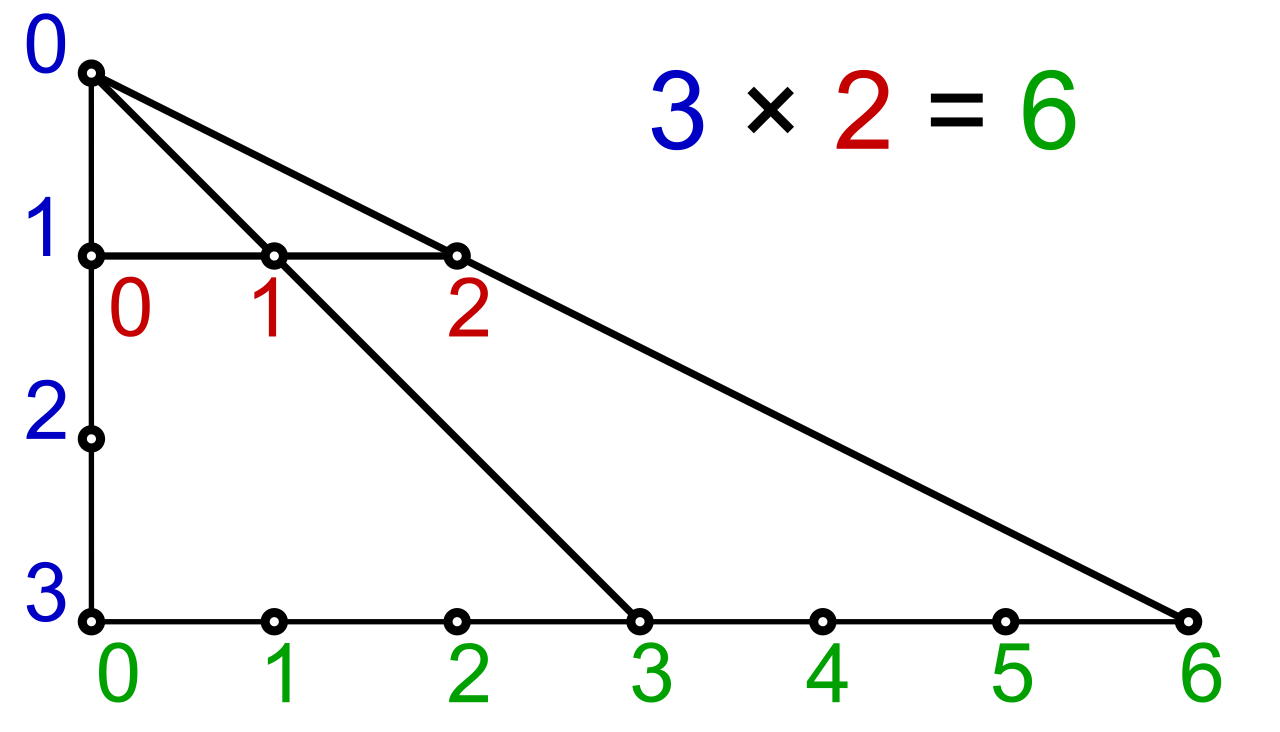
Before students abstract ratios into algebraic equations, they must build a mental model. You will use three primary visual representations to teach proportional reasoning:
| Visual Model | Definition & Best Use Case |
|---|---|
| Tape Diagram | A tape diagram is a visual model consisting of segmented rectangles used to represent the relative sizes of quantities in a ratio. Best for: Part-to-part problems where the units are identical (e.g., mixing 3 parts yellow paint to 2 parts blue paint). |
| Double Number Line | A double number line diagram uses two parallel number lines with aligned tick marks to model equivalent rates. Best for: Visualizing continuous rates with different units (e.g., miles on the top line mapping to hours on the bottom line). |
| Ratio Table | A ratio table is a structured mathematical display organizing equivalent ratios into corresponding rows or columns. Best for: Organizing data logically to find missing values or preparing coordinate pairs for graphing. |
The climax of middle school ratio instruction is moving from discrete tables to the continuous Cartesian coordinate plane. This is where ratios become functions.
When a relationship is proportional, it can be modeled by the equation y=kx. In the proportional equation y=kx, the constant of proportionality k represents the unit rate.
When you instruct students to plot a ratio table on a graph, two geometric truths will invariably emerge:
- The graph of a proportional relationship on a Cartesian coordinate plane is always a straight line.
- The graph of a proportional relationship on a Cartesian coordinate plane always passes through the origin (0,0). (If you buy 0 items, it costs $0).
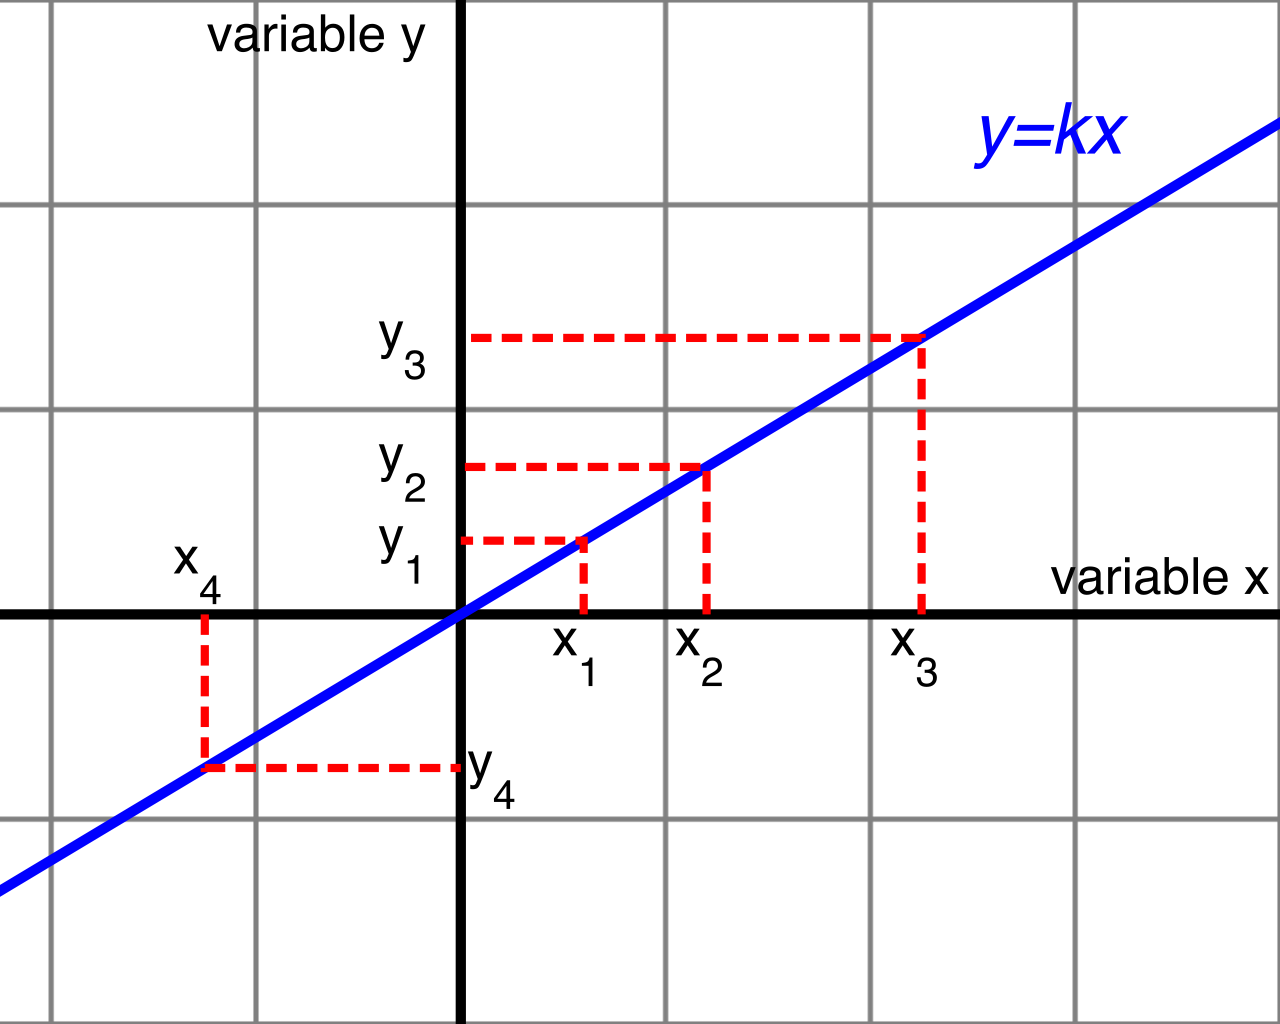
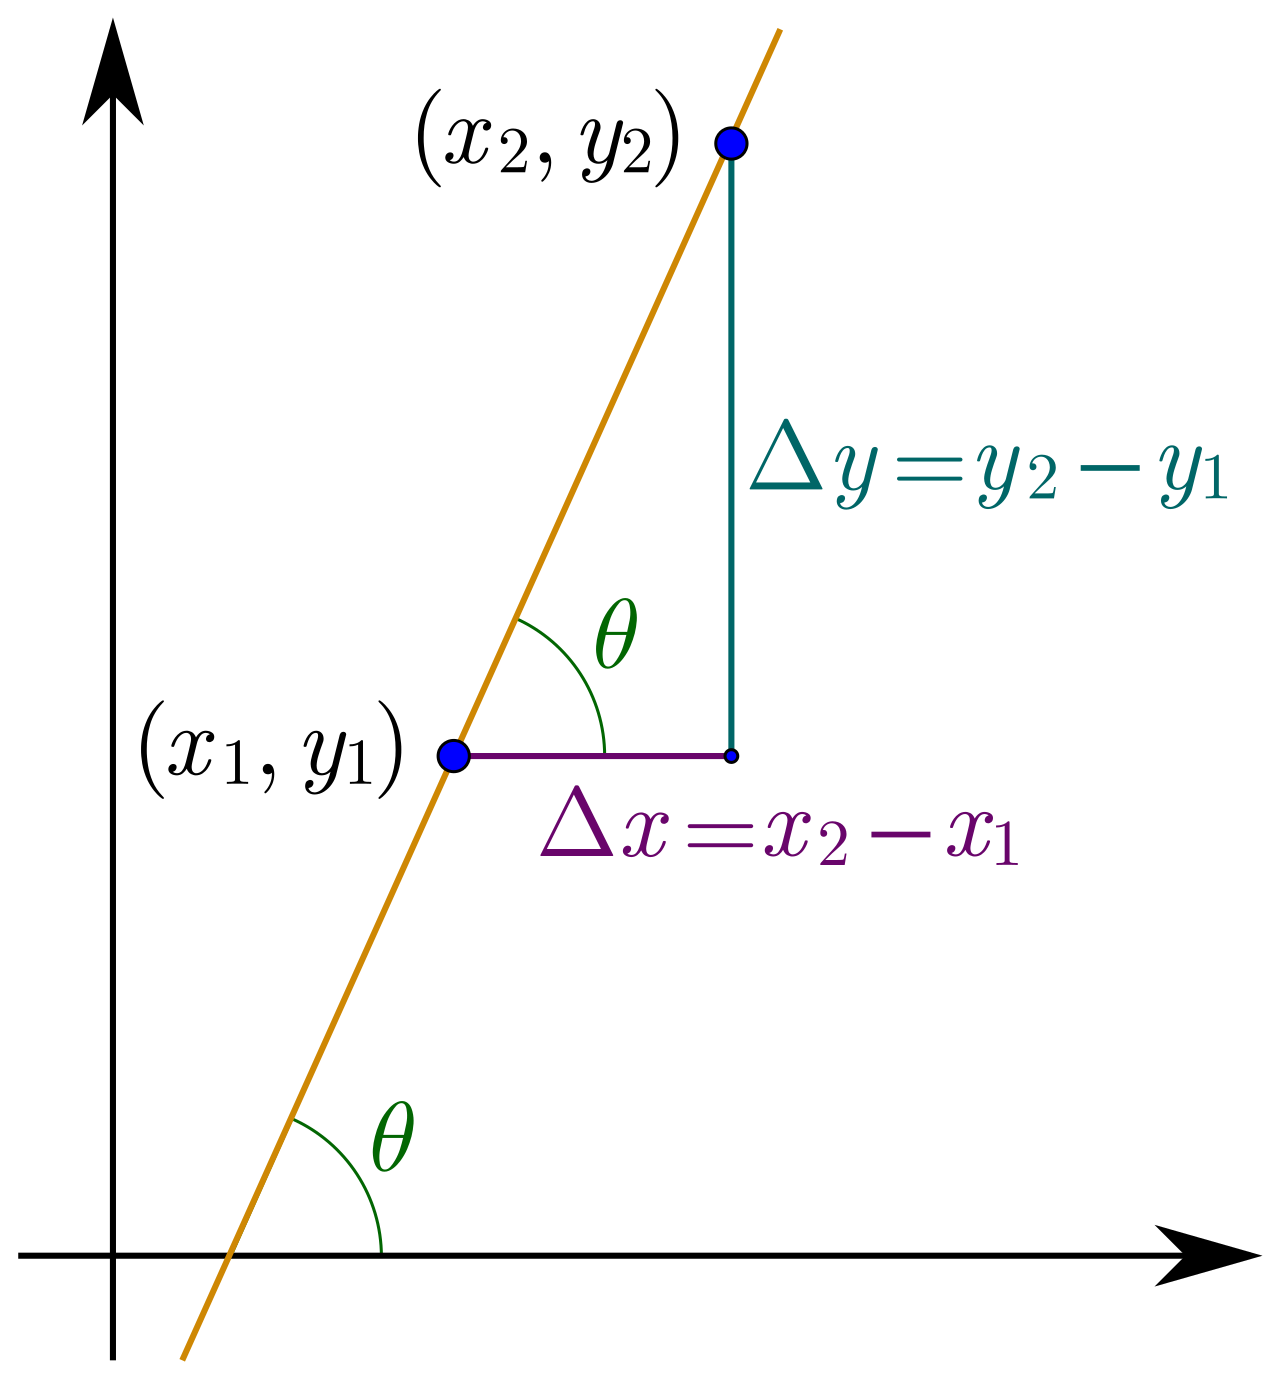
The Anatomy of the Line By analyzing the line, we can extract the rate. The slope of a graphed proportional relationship represents the unit rate of the relationship.
Furthermore, teach your students to always hunt for the x=1 coordinate. The coordinate pair (1,r) on the graph of a proportional relationship indicates that the value r is the unit rate. Because the x-axis represents exactly one unit, the corresponding y-value (r) gives you the "per 1" amount immediately.
As a teacher, weaving these concepts together—from the simple act of comparing flour and sugar to the abstract graphing of y=kx—is how you build mathematical fluency. You are teaching them that whether they are calculating unit price at the grocery store, finding the density of an object in science class, or determining the slope of a line, they are simply speaking different dialects of the exact same mathematical language.