Ratios, Rates, and Percents
Not sure you’re ready?
Take the ~3-minute readiness diagnostic and see where you stand.
A master architect does not scale a blueprint by adding two inches to every wall. If a window is half the width of a door on the paper, it remains half the width of the door in the steel-and-glass reality. This preservation of relative size is the essence of multiplicative reasoning. For adolescents, transitioning from the comforting, absolute world of additive arithmetic into the relative world of multiplicative comparison is one of the most profound cognitive leaps they will make. As a secondary mathematics educator preparing for the Praxis 5165 exam, your mastery of this domain cannot merely be procedural. You must understand the deep, interconnected architecture of ratios, rates, and percents to untangle your students' misconceptions and build their capacity to navigate a proportional world.
At its core, a ratio is a multiplicative comparison of two or more separate quantities. We are not asking "how much more" (subtraction), but "how many times as much" (division). However, the way we define the quantities being compared drastically shifts the nature of the ratio.
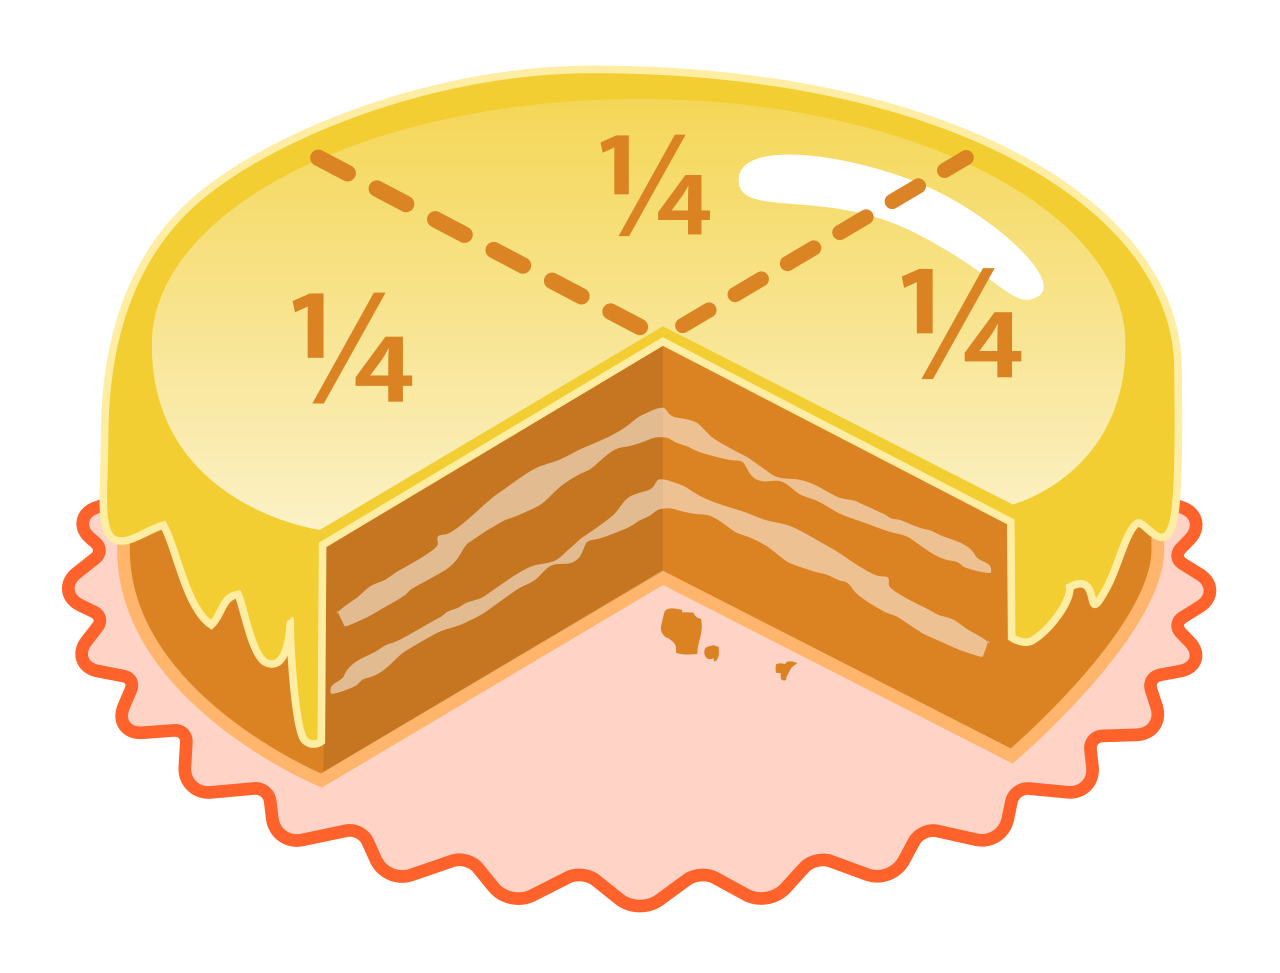
Students frequently conflate ratios and fractions, but they possess distinct, albeit overlapping, identities. A mathematical fraction traditionally represents a part-to-whole relationship—a piece of a pie compared to the entire pie. Conversely, a mathematical ratio is more flexible; it can represent either a part-to-part relationship or a part-to-whole relationship.
| Comparison Type | Definition | Classroom Example |
|---|---|---|
| Part-to-Part Ratio | A part-to-part ratio compares disjoint subsets within a single larger group. | Comparing the number of algebra students to the number of geometry students in a high school. |
| Part-to-Whole Ratio | A part-to-whole ratio compares a specific subset to the entirety of a group. | Comparing the number of algebra students to the total student population. |
To move seamlessly between different scales—whether adjusting a recipe for three people to serve thirty, or analyzing scaled geometric figures—we rely on equivalence. Equivalent ratios are generated by multiplying or dividing all terms of a given ratio by the same non-zero number. This is the mathematical equivalent of zooming in or out on a photograph; the fundamental image remains unchanged.
Formalizing Equivalence: Proportions
When we assert that two ratios scale perfectly to match one another, we move from arithmetic to algebra.
A proportion is a formal algebraic equation stating that two distinct ratios are strictly equivalent.
When a student sees 43=12x, they are looking at a proportion. To solve for unknowns within these structures, we often employ cross-multiplication. But why does this work? It is not magic; it is simply the byproduct of multiplying both sides of the equation by a common denominator to clear the fractions.
The Cross-Multiplication Method: The cross-multiplication method solves the proportion ba=dc by establishing the equation a times d equals b times c (or ad=bc).
When the quantities we compare live in different physical realities, our ratio evolves into a rate. A rate is a specific type of ratio that compares two quantities possessing fundamentally different units of measure—such as miles compared to hours, or dollars compared to pounds.
Rates become most conceptually useful when standardized. A unit rate evaluates to a denominator of exactly one when the rate is expressed as a fraction. If a student knows they earn $45 in 3 hours, the rate is 45/3. The unit rate is $15 per 1 hour. Unit rates are the ultimate mathematical leveler; they allow us to compare the efficiency of different cars, the value of different grocery items, and the speed of different algorithms.
Because rates entangle numbers with units, altering the scale of a rate requires careful tracking of those units. Dimensional analysis is a mathematical technique used to convert rates by multiplying the original rate by equivalent fractions of distinct units.
For example, to convert $60 \text{ miles} / 1 \text{ hour} into [feet per second](https://en.wikipedia.org/wiki/Foot_per_second), we multiply by fractions that equal exactly one (like \5280 \text{ feet} / 1 \text{ mile} and \1 \text{ hour} / 3600 \text{ seconds}$). The units cancel out algebraically, ensuring that while the numerical values shift, the underlying physical reality being measured remains invariant.
When two variables are locked in a perfectly synchronized dance of multiplication, they share a relationship of direct proportionality. Direct proportionality requires two distinct variables to increase or decrease together at a constant multiplicative rate.
If we divide the dependent variable (y) by the independent variable (x), we isolate the engine driving this relationship. We call this k.
The constant of proportionality (k) is the invariant value of the ratio between two directly proportional quantities, where k=xy.
This algebraic constant has a stunning geometric manifestation. If you plot a proportional relationship on a Cartesian coordinate plane, two strict visual rules emerge:
- A graph of a strictly proportional two-variable relationship must be a straight line.
- A graph of a strictly proportional two-variable relationship must pass exactly through the origin coordinates of zero comma zero (0,0).
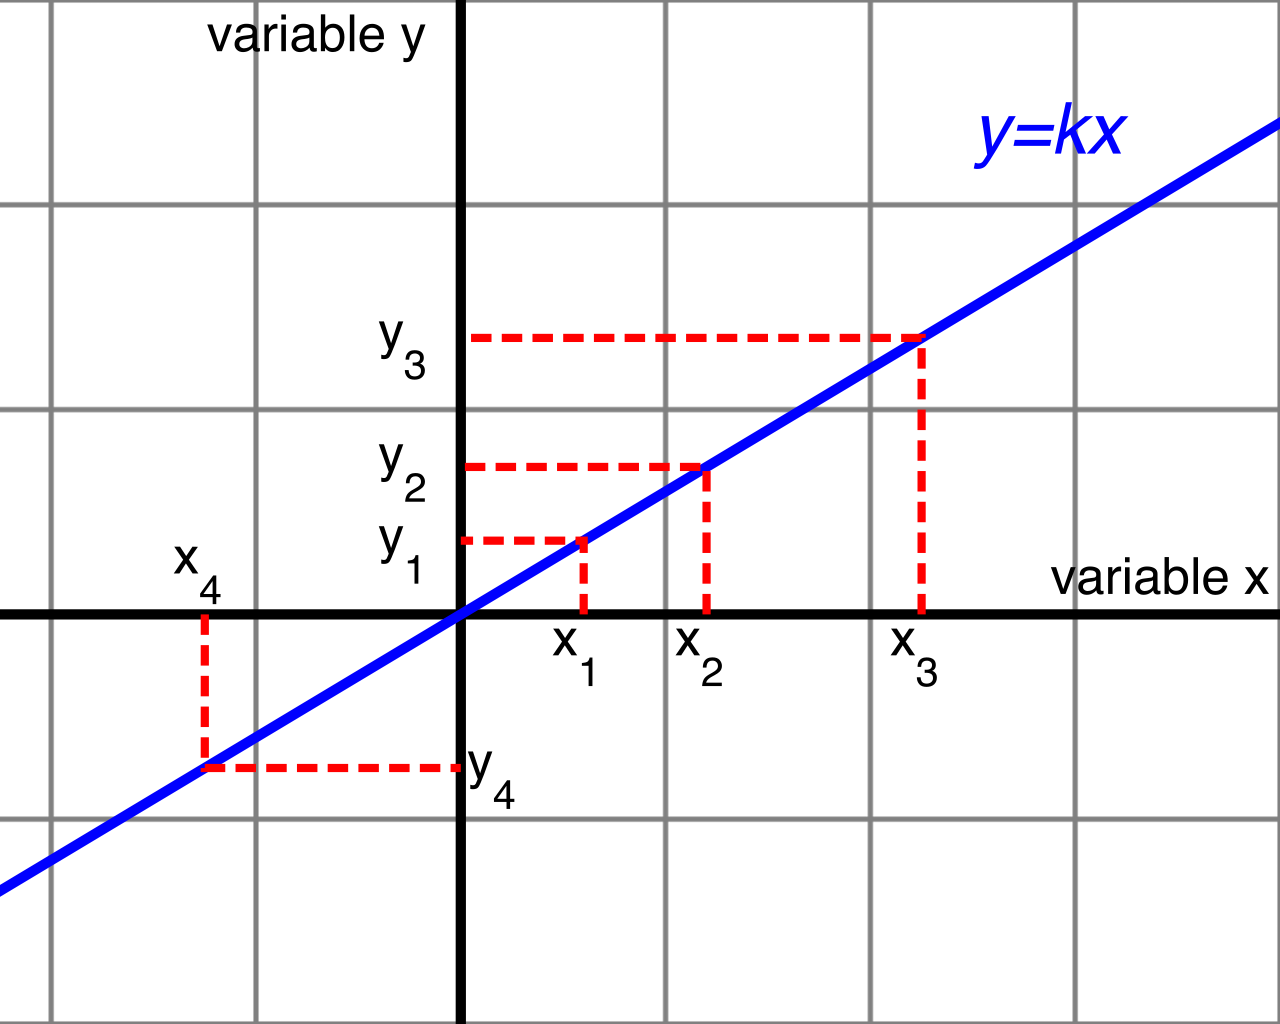
The logic here is unbreakable: if you purchase zero gallons of gasoline, it must cost exactly zero dollars. Furthermore, the constant of proportionality is graphically equivalent to the slope of the linear equation representing a proportional relationship (y=kx). A constant rate of change indicates a strictly linear relationship between two continuous independent and dependent variables.
One of the most foundational places your students will encounter this is in physics. The physics formula stating distance equals rate multiplied by time (d=rt) is a standard practical application of a constant rate of change. If speed (the rate) is held constant, distance and time are directly proportional.
The Mirror Image: Inverse Proportionality
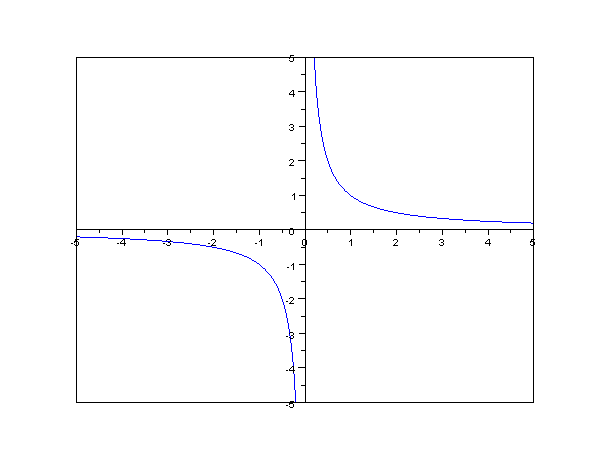
We must contrast direct proportionality with its behavioral opposite. Inverse proportionality occurs when the product of two variables remains constant (xy=k).
Imagine hiring painters to paint a massive school building. If you double the number of painters, the time it takes to finish the job is cut in half. In an inversely proportional relationship, one variable must strictly decrease as the other variable increases. Their graph is not a straight line through the origin, but rather a rational curve (a hyperbola) that approaches the axes asymptotically.
Fractions and ratios are powerful, but comparing 1713 to 2419 requires cognitive overhead. Humanity needed a universal denominator.
The word percent originates from the Latin phrase per centum, which translates to by the hundred. Consequently, a percent is a standardized part-to-whole ratio where the comparative whole is fixed at exactly one hundred. By forcing all comparisons to share a denominator of 100, we create an instantaneous, intuitive understanding of magnitude.
When teaching students to solve percent problems, you will equip them with two primary algebraic tools:
1. The Standard Percent Proportion
The standard percent proportion sets the ratio of the part to the whole equal to the ratio of the percentage value to one hundred. WholePart=100Percent
2. The Percent Equation
The percent equation dictates that the part equals the decimal representation of the percent multiplied by the whole base amount. Part=Decimal×Whole
In translating word problems into these equations, linguistic markers act as algebraic operators. The word 'of' in a mathematical percent word problem typically identifies the whole or the base amount for the required multiplication (e.g., "What is 20% of 80?").
When analyzing data over time, we rarely care solely about the absolute values; we care about the relative severity of the change. A $10 price hike on a $5 cup of coffee is an outrage. A $10 price hike on a $30,000 car is statistically invisible.
To capture this, we calculate percent change. Percent change is evaluated by dividing the absolute difference between the new and original values by the original value.
To finalize the calculation: The fractional ratio of the absolute change to the original value must be multiplied by one hundred to yield a final percent change.
Percent Change=(Original Value∣New Value−Original Value∣)×100
The direction of the change categorizes it:
- A percent increase occurs solely when a final numerical value is strictly greater than the initial base numerical value.
- A percent decrease occurs solely when a final numerical value is strictly less than the initial base numerical value.
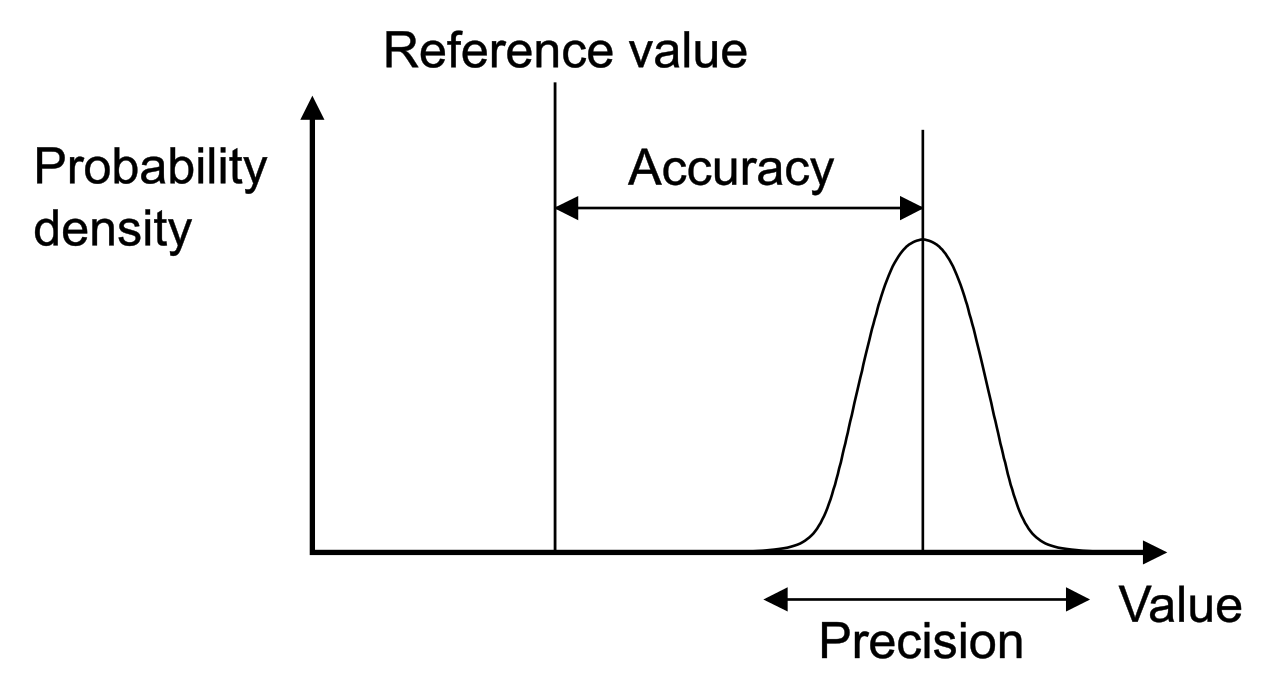
This identical mathematical structure governs how we measure precision in the sciences. Percent error is the absolute value of the difference between an estimated value and the exact value, divided entirely by the exact value. Whether assessing laboratory equipment or student estimation tasks, percent error standardizes the severity of the inaccuracy.
We arrive now at one of the most persistent, insidious traps in secondary mathematics: compounding percentages.
Suppose a retail store places a $100 jacket on sale for 20% off. A week later, they offer an "additional 10% off the sale price." The undisciplined mind simply adds 20 and 10 to conclude the jacket is 30% off, expecting a final price of $70.
This is mathematically false. Adding successive percentages together directly yields an incorrect mathematical result for compounding percentage changes. Why? Because the base amount—the "whole"—has shifted.
Successive percentage changes must be calculated sequentially by applying each new percentage multiplier to the immediately preceding result.
- First change: 20% off $100 leaves 80% of the original price. ($80).
- Second change: 10% off the new base of $80 leaves 90% of $80. ($72).

The actual final price is $72, which represents a total discount of 28%, not 30%. As a teacher, anticipating this additive fallacy is essential. You must explicitly teach students that percentage operations are multiplicative, and multiplying (0.80)×(0.90) yields a combined multiplier of 0.72 (or 72% of the original price).
For the Praxis 5165 exam, and more importantly, for your future classroom, you must treat ratios, rates, and percents not as an isolated chapter in a textbook, but as a continuous thread of multiplicative reasoning.
When a student scales a recipe, they are establishing equivalent ratios. When they calculate a car's velocity, they are finding a unit rate. When they graph that velocity, they are observing a constant of proportionality plotted as a linear slope passing through the origin. And when they analyze a sale at the mall, they are applying standardized proportional ratios set to a base of one hundred. Master this continuity, and you will give your students the mathematical lens required to accurately perceive the scaled reality of the world around them.