Interpret Assessment Results
Not sure you’re ready?
Take the ~3-minute readiness diagnostic and see where you stand.
Imagine handing an engineer a metal beam and asking if it is strong enough to support a bridge. The beam measures exactly 42 feet in length and weighs 800 pounds, but without knowing the gravitational load of the bridge or the metallurgical properties of the beam, those numbers are fundamentally useless. In special education, an isolated test score functions the exact same way. When a student completes an assessment, the number generated at the end is merely an observation—a piece of data floating in a vacuum. To transform that number into a precise roadmap for specialized instruction, we must understand the statistical architecture that gives it meaning.
Every journey into assessment data begins with the raw score. A raw score represents the total number of correct responses or points earned on an assessment before any statistical conversions. If a student answers 14 out of 20 math questions correctly, the raw score is 14.
However, a raw score alone holds no comparative value without referencing a specific norm group or grading criterion. Is 14 a brilliant performance on a highly complex calculus test, or a concerning result on a basic addition worksheet? To answer that, educators project the raw score onto one of two distinct interpretive frameworks:
- Criterion-referenced score interpretation evaluates a student's test performance against a fixed set of academic standards or learning objectives. Think of this as measuring the student against the material itself. Did they master two-digit addition?
- Norm-referenced score interpretation compares a specific student's test performance against the performance of a statistically representative peer sample. Think of this as measuring the student against the crowd. How does their reading fluency compare to a thousand other third graders across the country?
To make sense of norm-referenced data, we must dive into the geometry of human performance: the normal distribution.
When you measure a specific trait—like reading comprehension or working memory—across a massive, representative population, the scores naturally cluster in the middle and taper off at the extremes. This creates a bell-shaped curve, or a normal distribution.
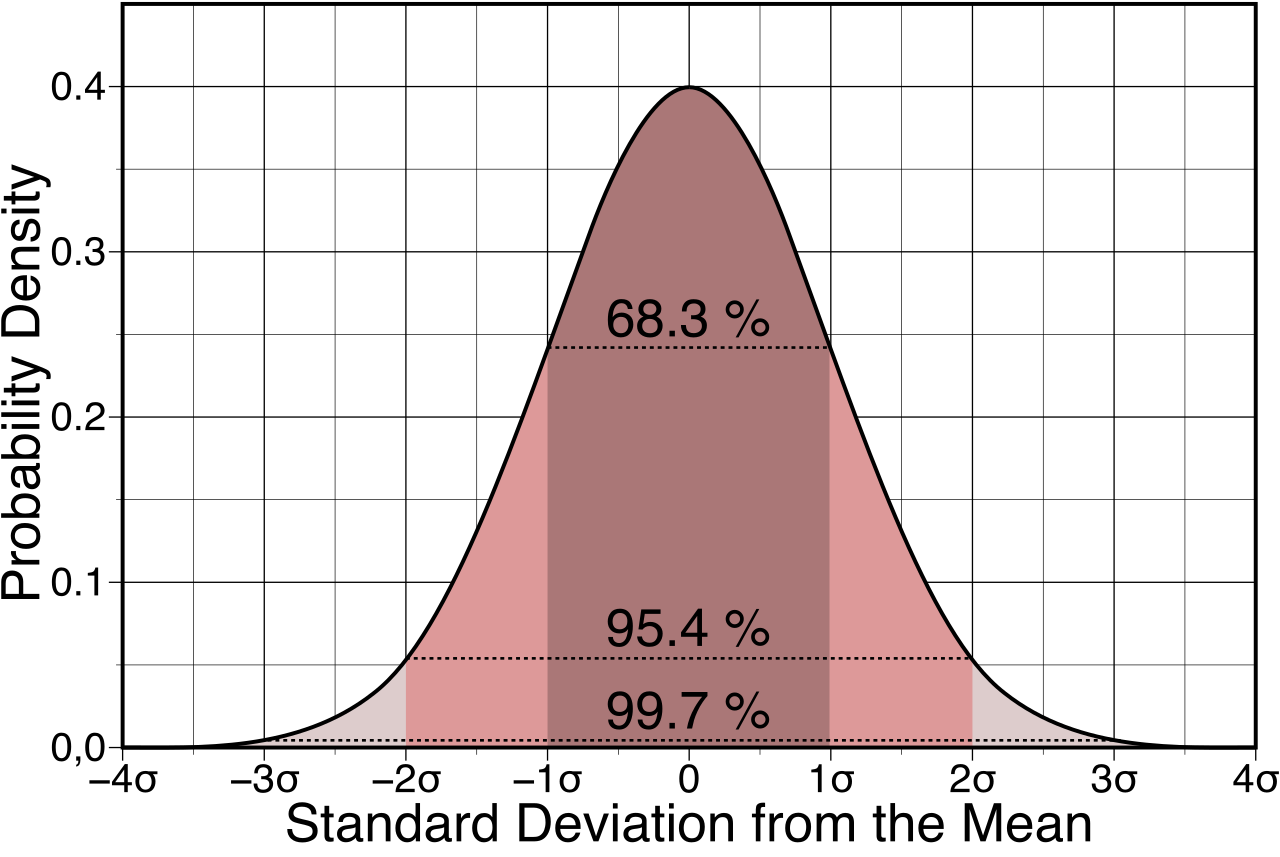
To map this curve, statisticians use standard deviation, a metric that measures the amount of variation or spread of a set of assessment scores around the mean. It tells us how densely packed the scores are near the average.
The 68% Rule: In a normal distribution, approximately 68 percent of the population scores within one standard deviation above and below the mean. This forms the "average" range of human performance.
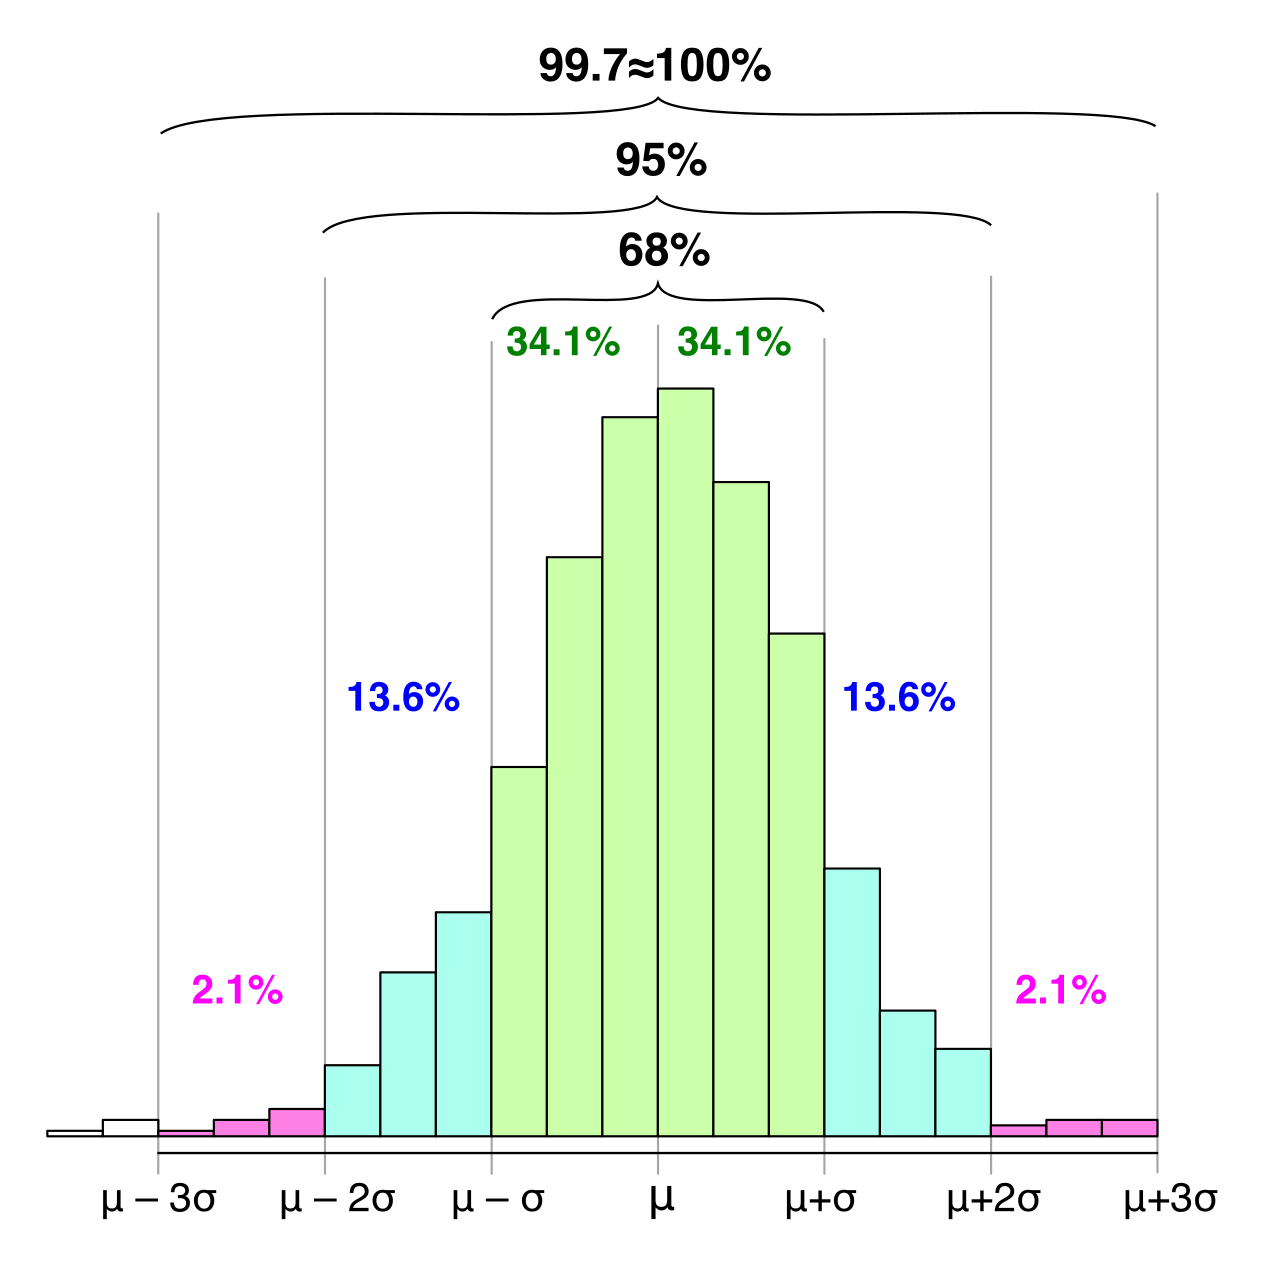
Because raw scores from different tests are entirely incompatible (a 45 on a vocabulary test cannot be compared to a 12 on a block-design test), test makers convert them. A standard score converts a raw score to a common scale to indicate distance from the average score of a normative sample.
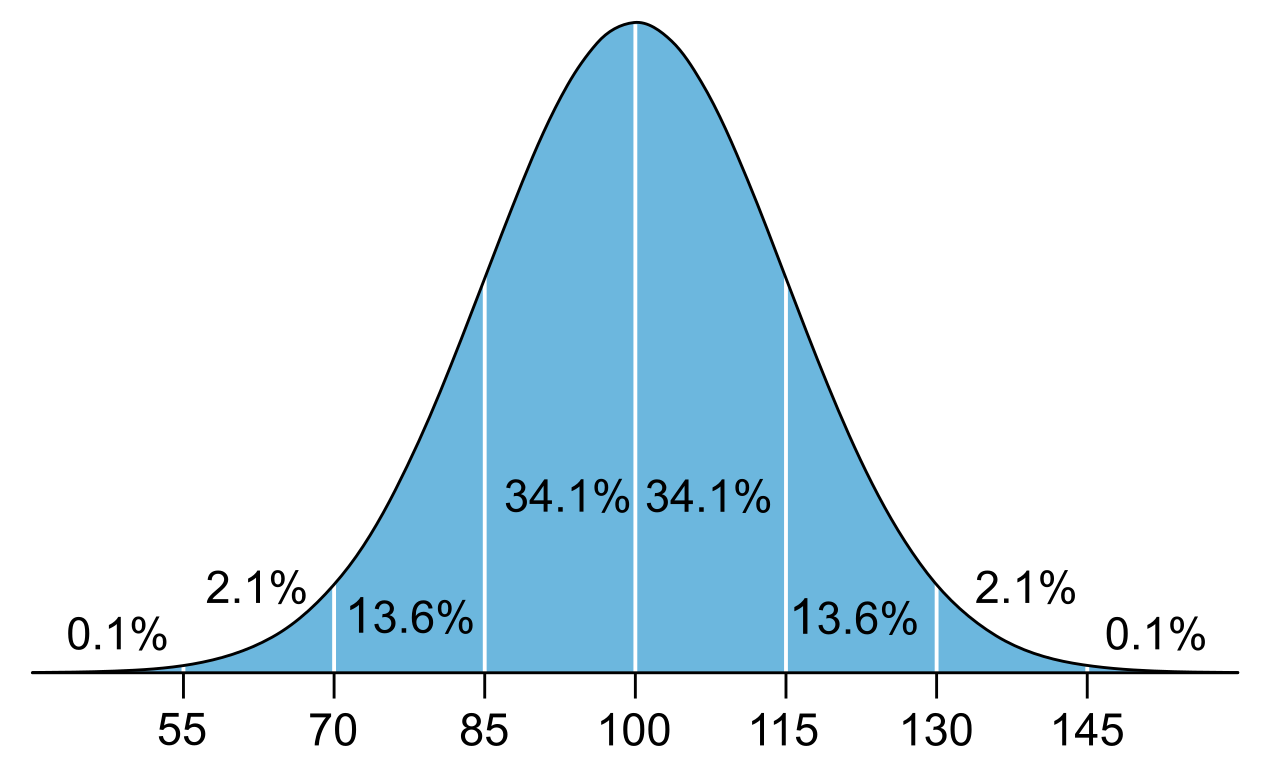
The most common standard score scale used in psychoeducational testing (such as the WISC or the Woodcock-Johnson) sets the mean at exactly 100. Furthermore, the standard deviation for standard scores in typical intelligence and academic achievement tests is 15 points.
If your student earns a standard score of 85, they are exactly one standard deviation below the mean. If they score a 115, they are one standard deviation above it. Both still sit on the outer boundary of that 68 percent average cluster.
While the 100-mean/15-SD scale is ubiquitous in cognitive and academic testing, psychometricians use other scales to convey specific types of information. As a special education teacher, you will routinely encounter three specific variations in psychological reports:
The Z-Score: The Purest Metric
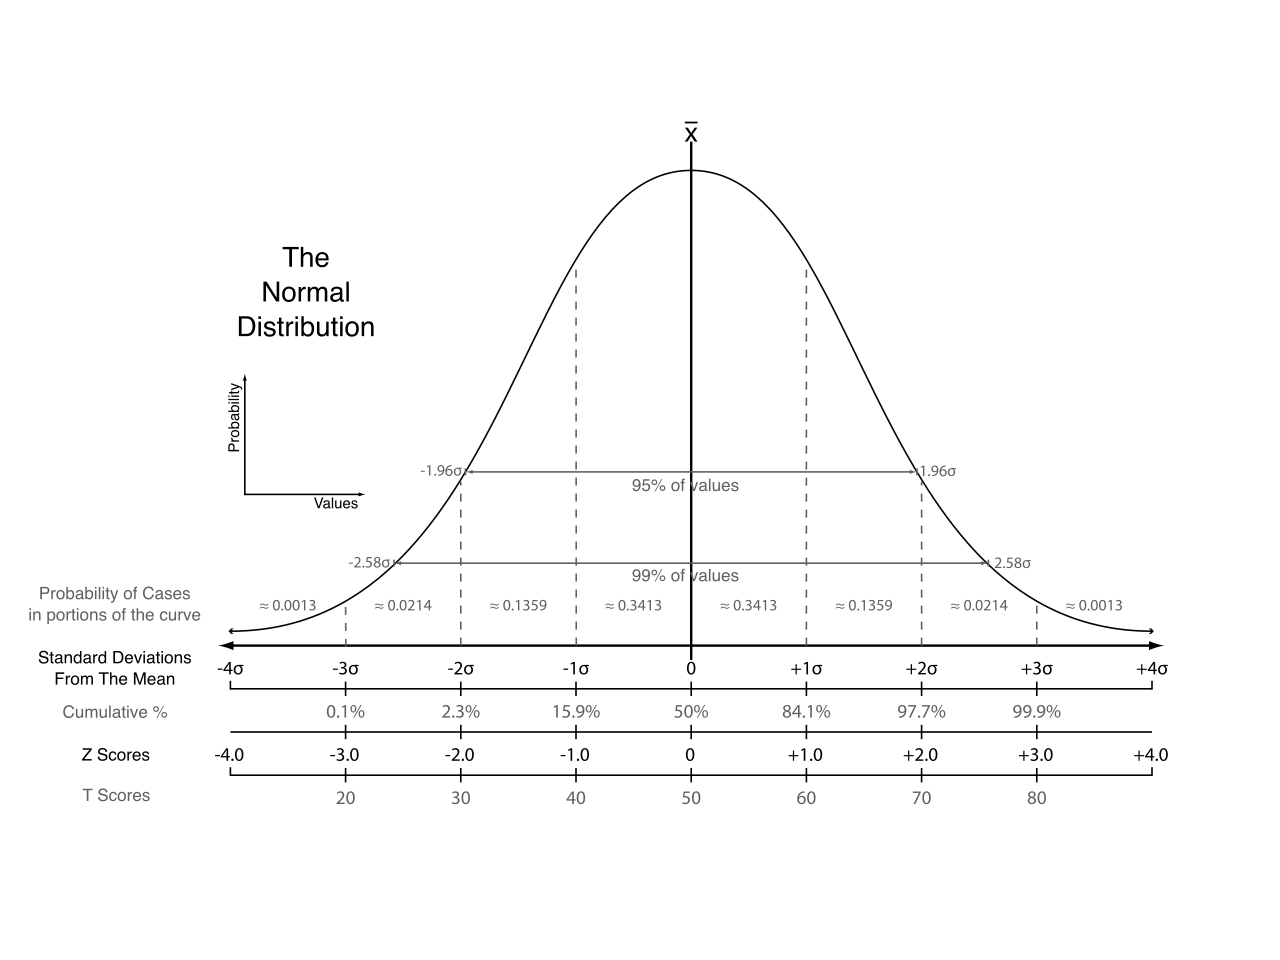
A z-score measures exactly how many standard deviations a student's assessment score falls above or below the mean. A z-score distribution always has a mean of exactly zero and a standard deviation of exactly one. A standard score of 115 (one SD above the mean) is simply a z-score of +1.0. A standard score of 70 (two SDs below the mean) is a z-score of -2.0. It is the rawest mathematical translation of the bell curve.
The T-Score: Protecting the Human Element
Imagine sitting in an IEP meeting and telling a parent that their child has a "-2.5" in emotional regulation. Negative numbers carry a heavy psychological weight and are easily misunderstood. Enter the T-score, a standardized metric used to report behavioral or personality assessment results without using negative numbers. A T-score distribution always features a mean of 50 and a standard deviation of 10. A T-score of 40 is mathematically identical to a z-score of -1.0, but it removes the stigma of the minus sign.
Stanines: The Broad Strokes
Sometimes, highly specific scores suggest a level of microscopic precision that is mathematically unjustified or practically unnecessary. Stanines (short for "Standard Nines") convert assessment scores into a nine-point scale to provide a broad categorization of student performance.
- Stanines 1, 2, and 3 are below average.
- Stanines 4, 5, and 6 are average.
- Stanines 7, 8, and 9 are above average.
Crucially, the fifth stanine always represents the average performance range within an assessment's normative sample.
| Metric | Mean | Standard Deviation | Primary Use Case |
|---|---|---|---|
| Standard Score | 100 | 15 | Intelligence & Academic Achievement |
| z-score | 0 | 1 | Pure statistical standard deviation mapping |
| T-score | 50 | 10 | Behavioral & Personality Assessments |
| Stanine | 5 | ~2 | Broad, simplified performance bands |
Human beings are intuitively drawn to rankings. When parents and educators look at a psychoeducational report, their eyes immediately search for percentages and grade equivalents. Yet, these are the most frequently misinterpreted metrics in all of special education.
Decoding Percentile Ranks
A percentile rank indicates the percentage of peers in a normative sample who scored at or below a specific student's score. Therefore, percentile ranks indicate relative standing compared to peers rather than the percentage of assessment questions answered correctly.
If a student correctly answers 40 out of 100 questions on a brutally difficult physics exam, their raw score is 40 (or 40% correct). But if that score was the highest in the class, their percentile rank might be 99. A student achieving a 75th percentile rank performed equally to or better than 75 percent of the test's normative sample. By definition, the 50th percentile rank corresponds exactly to the median score of an assessment's normative group.
The Grade Equivalent Trap
A grade equivalent score estimates a student's developmental performance level in terms of a specific school grade and month. For example, a grade equivalent score of 5.3 means the tested student earned the same raw score as the average fifth grader in the third month of school.
Critical Warning: Grade equivalent scores do not signify that a student possesses the prerequisite skills to function successfully in that specific grade classroom.
If a second-grader takes a second-grade math test and achieves a grade equivalent of 5.3, it does not mean they know fifth-grade math (fractions, decimals, volume). It simply means that an average fifth grader, if given that exact same second-grade test, would likely achieve the same raw score. It is a measure of mastery over early concepts, not an indicator of advanced readiness.
Similarly, an age equivalent score indicates that a student's test performance matches the median raw score for students of a specific chronological age. Treat these scores with the exact same caution.
In the physical sciences, we accept that every measurement instrument—whether a ruler, a thermometer, or an oscilloscope—has a margin of error. Cognitive and academic testing is no different. A student's test score on a Tuesday might be slightly different than their score on a Thursday due to fatigue, anxiety, or slight variations in attention.
Psychometricians quantify this fuzziness using the standard error of measurement, which is the expected amount of statistical error inherent in a student's observed test score. Because we know this error exists, we never assume an observed score is a perfect reflection of a student's true ability.
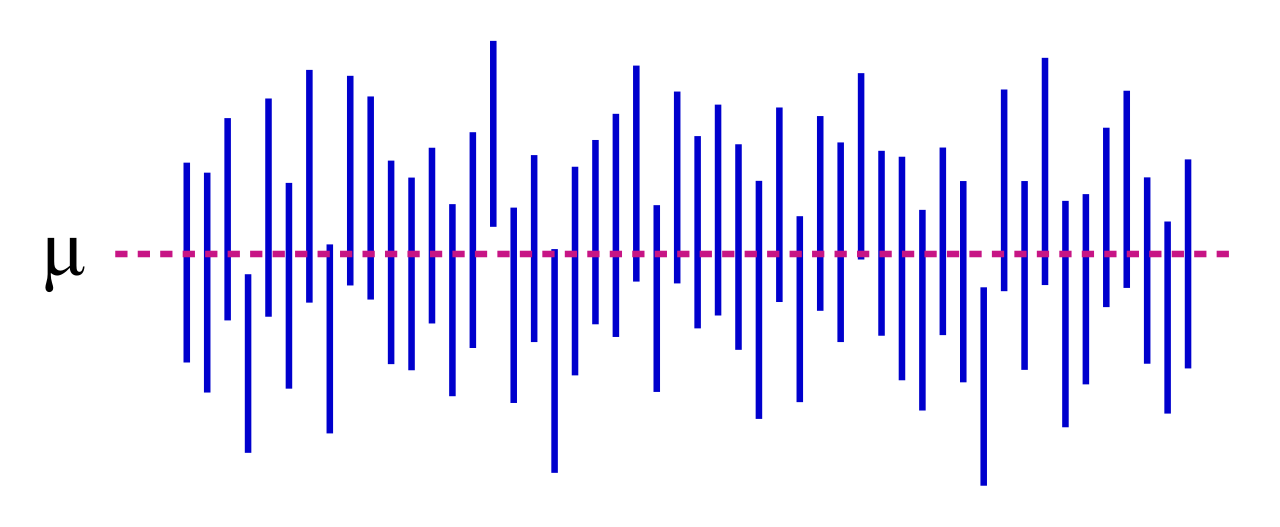
Instead, we use a confidence interval. A confidence interval defines a specific score range that is statistically likely to contain a student's true, error-free test score. For example, rather than saying a student's reading standard score is exactly 88, a report might state the score is 88 with a 95% confidence interval of 82 to 94.
Wider confidence intervals on an assessment report indicate a lower degree of precision in measuring the student's true ability. If a test has high standard error, the confidence band must be widened to ensure the true score is actually captured within it.
Why do we endure this rigorous statistical labor? Because numbers, correctly interpreted, illuminate the invisible architecture of a student's mind. We use diagnostic assessment results to identify specific cognitive or academic deficits to help educators design targeted special education interventions. We do not test to label; we test to intervene.
This data finds its ultimate home in the IEP, specifically within the Present Levels of Academic Achievement and Functional Performance (PLAAFP). The PLAAFP statement documents a student's current baseline skills before setting new individualized goals. It is the foundation of the entire special education process; if the foundation is flawed, the goals built upon it will collapse.
Analyzing baseline assessment data helps educators establish the starting point for drafting the Present Levels of Academic Achievement and Functional Performance statement. However, standard scores and percentiles alone do not tell the whole story. A student is not a collection of standard deviations.
Determining a student's present level of performance requires synthesizing quantitative data from formal tests and qualitative data from classroom observations. The quantitative data tells you where the student falls compared to their peers; the qualitative data tells you how the student navigates their deficits in real time, when they experience frustration, and what strategies currently help them succeed.
When you master the interpretation of assessment results, you no longer see just numbers on a page. You see the student's exact coordinates on the map of human learning, and more importantly, you possess the knowledge to chart their path forward.