Understand and Use the Results of Assessments
Not sure you’re ready?
Take the ~3-minute readiness diagnostic and see where you stand.
A navigator steering a ship through dense fog relies on radar, depth sounders, and GPS coordinates to avoid running aground. In the special education classroom, assessment data is the navigational instrumentation that prevents instructional shipwreck. We do not gather data simply to satisfy a rubric or populate a gradebook. We gather data to uncover the hidden mechanics of a student's mind, to isolate exactly where a cognitive process breaks down, and to construct a bridge over that exact gap. In special education, assessment is not an end point; it is the raw material for design, modification, and relentless advocacy.

Before you can build an instructional bridge, you must know precisely where the student is standing. This begins at the macro level with the legal framework of special education.
To qualify a student for special education services under the Individuals with Disabilities Education Act (IDEA), an Individualized Education Program (IEP) team must review evaluation data to determine eligibility. Crucially, a medical diagnosis alone is insufficient; the assessment data must indicate an adverse educational impact. The disability must demonstrably hinder the student's ability to access the general education curriculum.
Once eligibility is established, the instructional design begins with the Present Levels of Academic Achievement and Functional Performance (PLAAFP).
The PLAAFP Mandate The Individuals with Disabilities Education Act requires an Individualized Education Program to include a statement of the present levels of academic achievement and functional performance. Furthermore, Present Levels of Academic Achievement and Functional Performance statements must be directly based on recent assessment data.
You cannot write a PLAAFP based on gut feeling. It must be anchored in baseline data, which represents a student's current performance level on a specific skill before an educational intervention begins.
Crafting the Goal
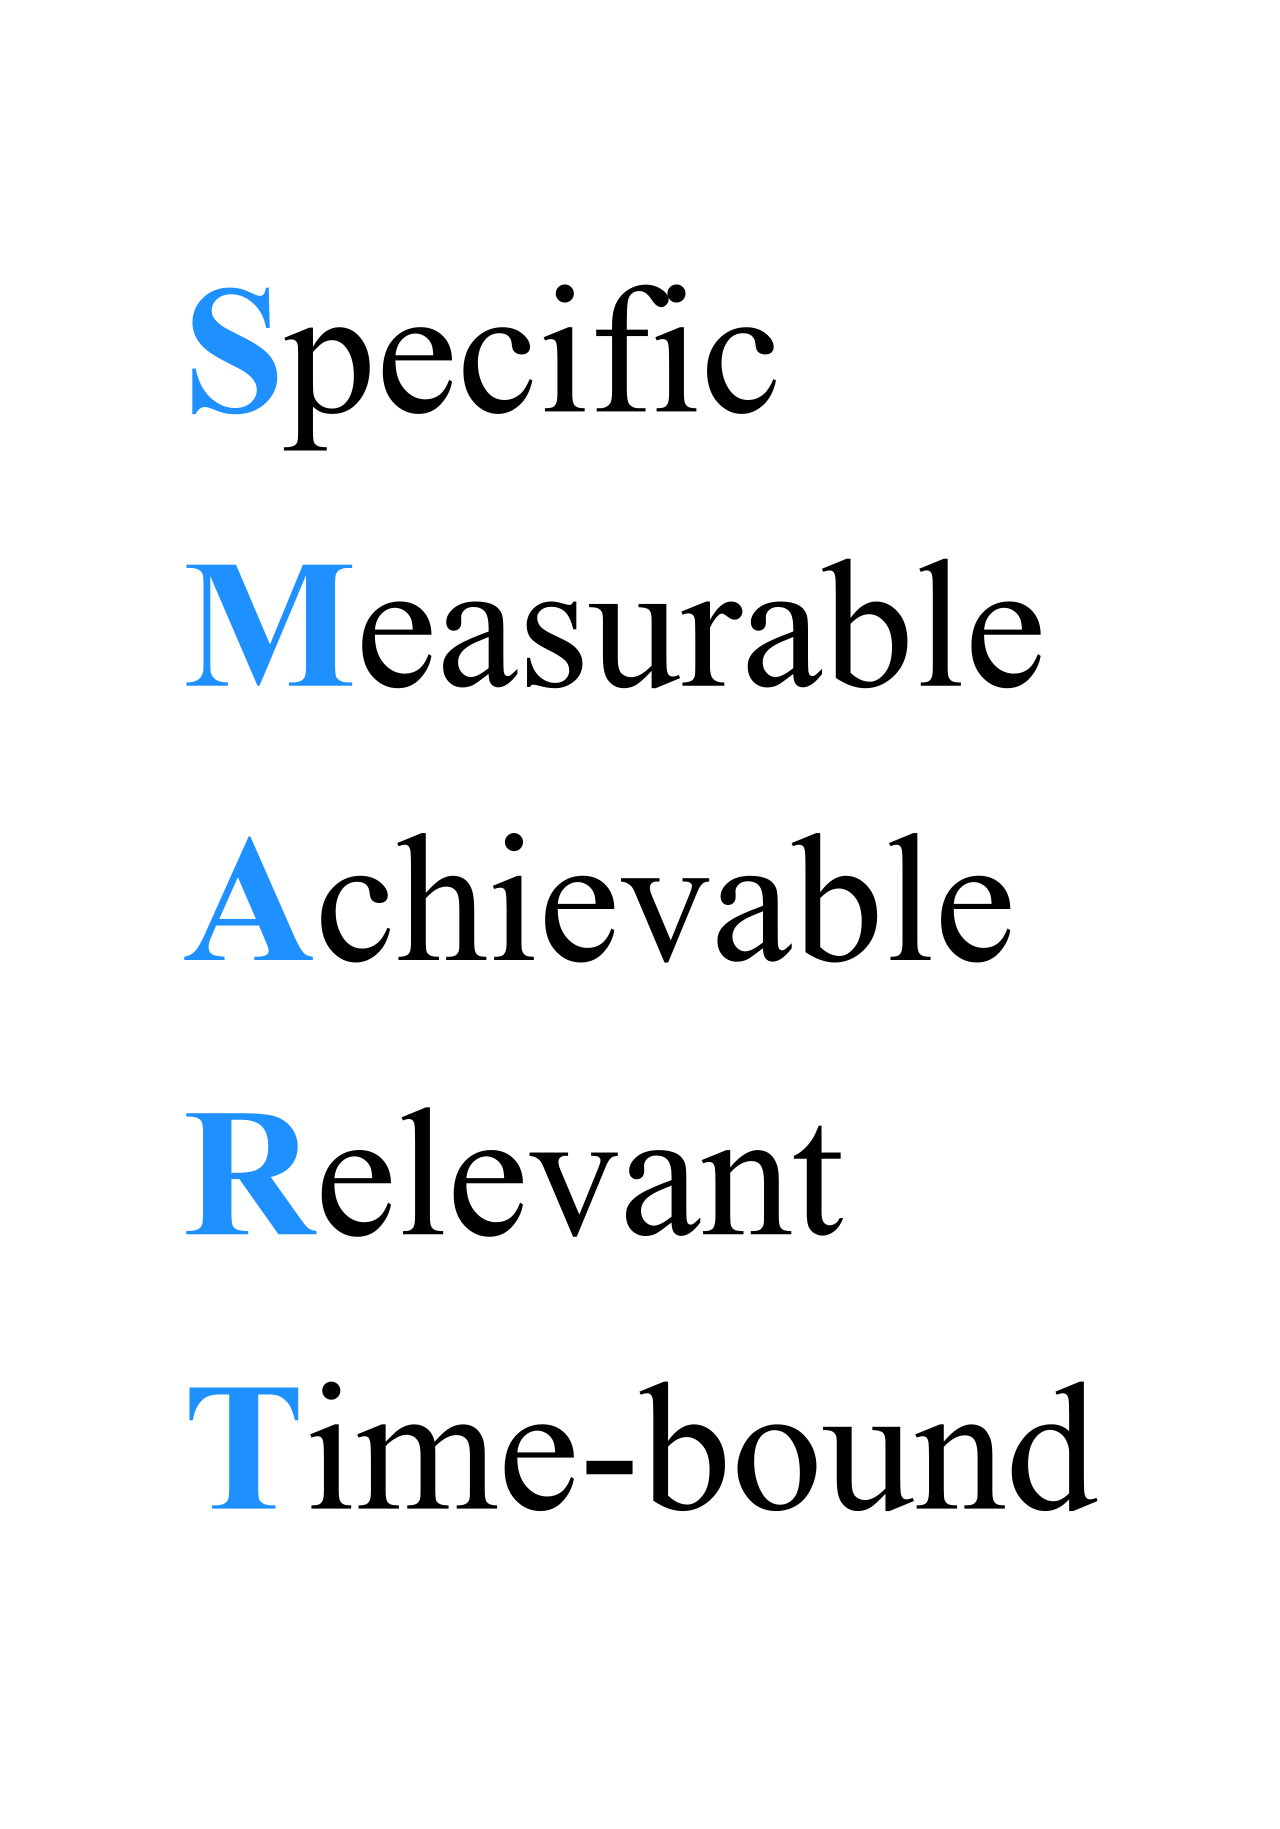
Individualized Education Program teams use baseline assessment data to establish realistic and measurable annual goals for a student. Without a precise baseline—knowing, for example, that a student reads 45 words correct per minute when the expectation is 90—you cannot plot a trajectory. This trajectory is defined through SMART goals in an Individualized Education Program, which must be Specific, Measurable, Attainable, Relevant, and Time-bound.
Just as a mechanic uses different tools to diagnose a spark plug versus a transmission, special educators must deploy specific assessments for specific inquiries.
| Assessment Type | Core Function | Classroom Application |
|---|---|---|
| Norm-Referenced | Special educators use norm-referenced assessment data to compare a student's performance to a national sample of peers. | Yields percentiles. Useful for determining if a student is significantly behind their age or grade cohort during the eligibility phase. |
| Criterion-Referenced | Special educators use criterion-referenced assessment data to determine a student's mastery of specific educational standards. | Useful for measuring whether a student has acquired the specific skills dictated by the state curriculum, regardless of how peers perform. |
| Diagnostic | Special education teachers use diagnostic assessment data to pinpoint specific academic deficits for targeted remedial instruction. | Isolates why a student is failing. For instance, diagnostic data might reveal a student cannot read because they lack specific phonemic blending skills. |
| Alternate | Alternate assessment data is used to measure the academic progress of students with the most significant cognitive disabilities. | Ensures students who cannot access standard assessments are still held to rigorous, modified standards and their growth is formally recognized. |
| Summative | Summative assessment data evaluates a student's cumulative learning at the end of an instructional unit. | The "autopsy" of a unit. Did the student grasp the fractions unit as a whole? |
| Formative | Formative assessment data allows teachers to make immediate adjustments to their daily instructional delivery. | The "checkup." Exit tickets or quick whiteboard checks that tell you whether to move on tomorrow or reteach the concept immediately. |
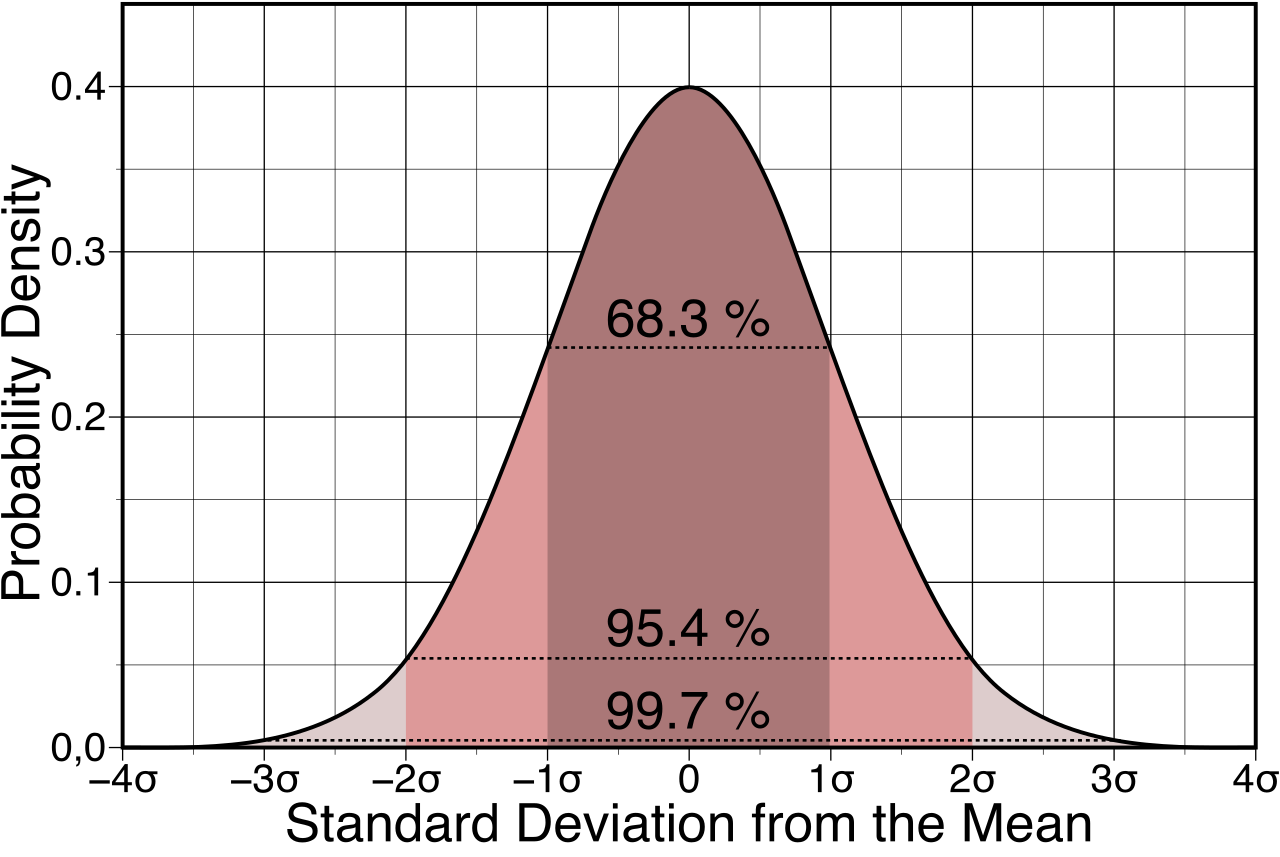
Modern special education operates largely within Multi-Tiered System of Supports (MTSS) frameworks. These frameworks use universal screening data—brief, highly predictive assessments given to all students—to identify those who require targeted instructional interventions.
Once a student is placed in an intervention, we do not wait until the end of the year to see if it worked. Progress monitoring data determines whether a student should move between different tiers of support in a Multi-Tiered System of Supports framework. The engine driving this monitoring is Curriculum-Based Measurement (CBM).
Curriculum-Based Measurement provides frequent data to monitor student progress toward specific instructional goals. Imagine plotting a student's weekly CBM scores on a graph. You draw an aimline—a straight line from the baseline data point to the end-of-year SMART goal. Then, you plot the student's actual weekly performance, creating a trend line.
- The Upward Trajectory: A rising trend line on a progress monitoring graph suggests that the current instructional intervention should be maintained. The mechanism is working.
- The Warning Signal: Teachers use Curriculum-Based Measurement data to adjust instructional strategies when a student's progress line falls below the aimline. You do not wait; you intervene.
- The Call for Overhaul: A flat trend line on a progress monitoring graph indicates that the current instructional intervention is not effective. The student is stagnant, and continuing the same instructional delivery is educational malpractice.
When standard interventions stall, the special educator must zoom in to a microscopic level of data analysis.
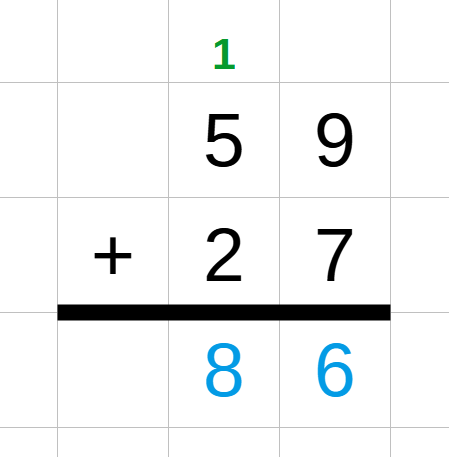
If a student consistently fails double-digit addition, a summative score of "40%" tells you nothing about how to fix it. Instead, error analysis data helps teachers identify specific patterns in a student's academic mistakes to guide targeted reteaching. You look at the paper and realize the student is adding the columns left-to-right instead of right-to-left. You haven't just found a failure; you've found the exact mechanical flaw to correct.
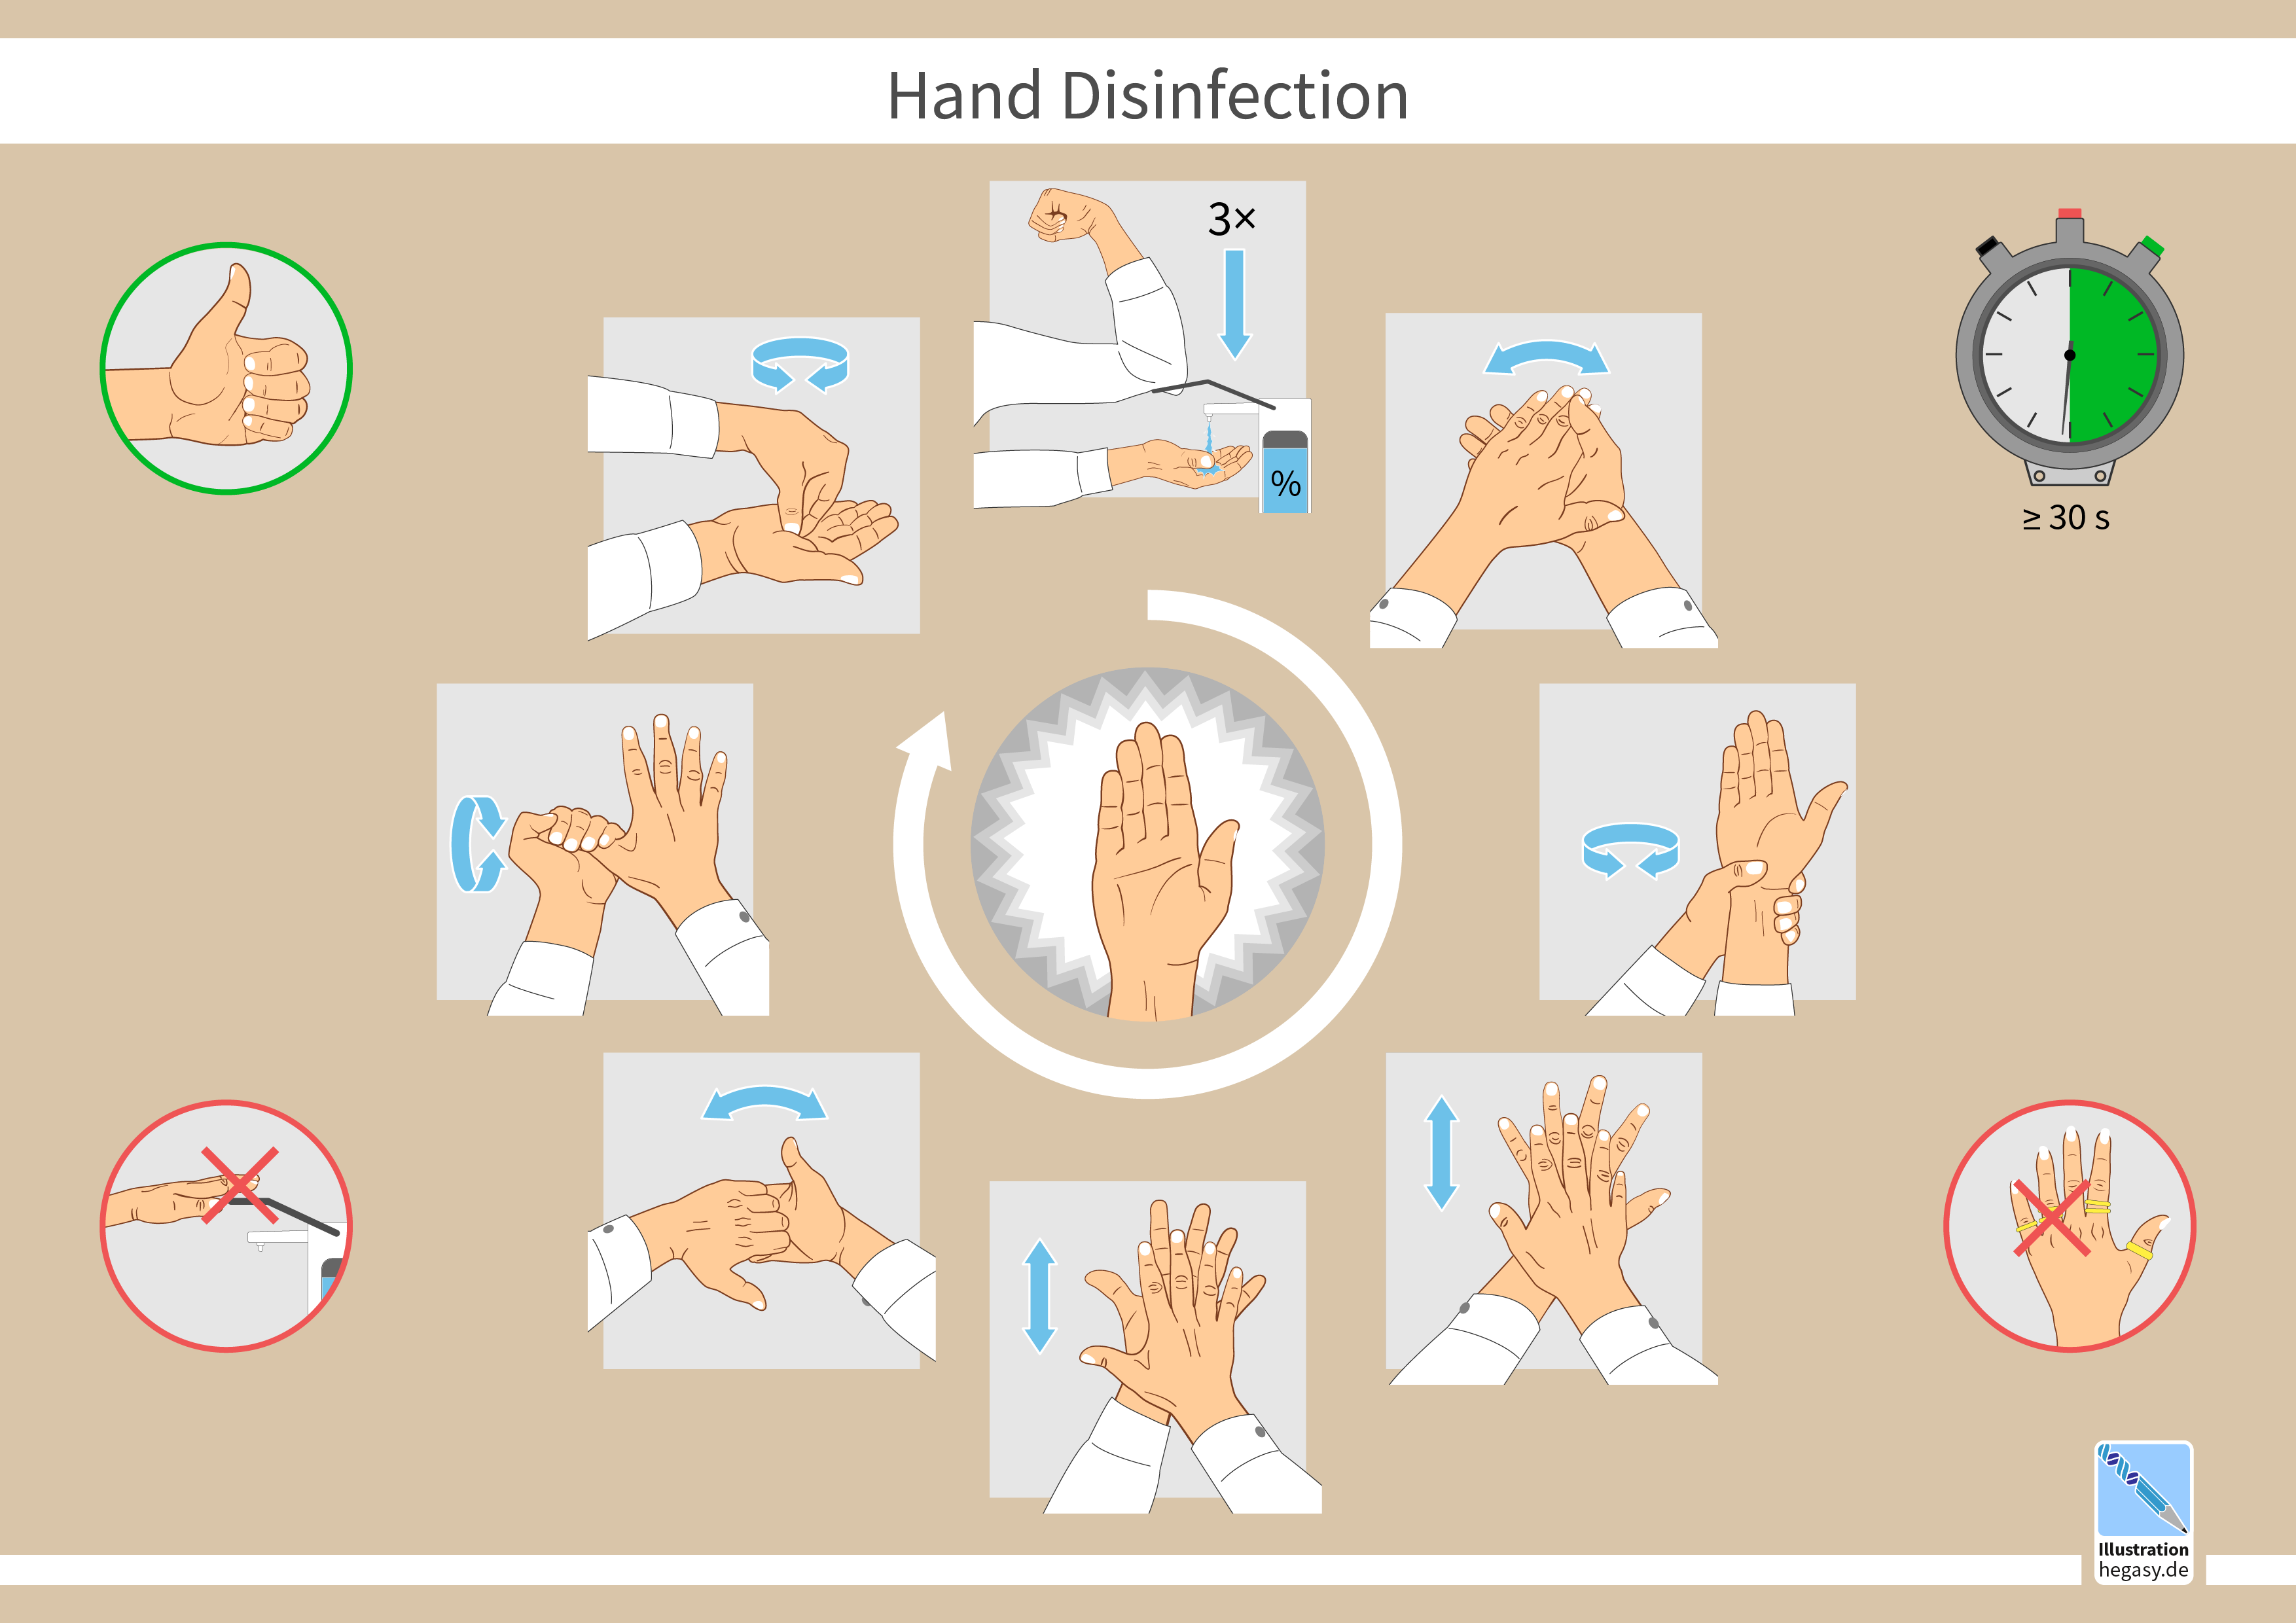
To teach that correction, you might rely on task analysis assessment data, which helps teachers break down complex skills into smaller instructional steps for a student. Washing hands or solving a quadratic equation are not single actions; they are chains of micro-behaviors. Task analysis dictates exactly which link in the chain requires instruction.
We also capture growth that numbers struggle to articulate. Portfolio assessment data showcases a student's growth over time through a curated collection of student work. This is highly effective for writing, art, or project-based learning, allowing the student and IEP team to see undeniable, concrete evolution in skill.
A student does not learn in a vacuum. A child might thrive in a quiet resource room but exhibit severe off-task behavior in a loud cafeteria.
To understand this, ecological assessment data helps educators understand how different environmental factors (lighting, noise, seating arrangements, peer proximity) impact a student's learning and behavior. Coupling this with observational data provides context about a student's social interactions during unstructured school activities. A student might pass a social skills worksheet with a 100% but sit entirely alone during recess—observational data reveals the true functional deficit.
When behaviors actively disrupt learning, we deploy a Functional Behavior Assessment (FBA). Special education teachers use Functional Behavior Assessment data to identify the antecedents (what happens immediately before) and consequences (what happens immediately after) maintaining a problem behavior. Behavior is communication. The FBA translates that communication, revealing whether a student throws a chair to escape a difficult math task or to gain peer attention.
Consequently, an Individualized Education Program team uses Functional Behavior Assessment data to develop a targeted Behavior Intervention Plan (BIP), replacing the maladaptive behavior with a functional, socially acceptable alternative that achieves the same desired outcome for the student.
Assessment data is not just an instructional tool; it is the legal currency used to advocate for a student's rights, services, and future.
Accommodations and Related Services
If a student requires physical modifications to hold a pencil or navigate a hallway, special educators use related service assessment data from occupational therapists to integrate physical accommodations into the classroom. If the barrier is expressive language, speech and language assessment data guides the integration of specific communication supports into a student's daily instruction.
When standard tools fail, assistive technology evaluations provide data to determine which specific devices—ranging from specialized text-to-speech software to eye-gaze communication boards—will improve a student's functional capabilities.
Furthermore, special educators use assessment data to advocate for specific accommodations on standardized state assessments, such as extended time, a scribe, or a quiet testing environment, ensuring the test measures the student's knowledge rather than their disability.
Extended School Year (ESY) and Placement
Over the summer, many students forget some material. But for students with severe disabilities, the loss can be catastrophic. Educators use academic regression and recoupment data to advocate for Extended School Year (ESY) services for a student. If the data proves it takes a student nine weeks in the fall to recoup the skills they lost over a standard summer break, the team is legally obligated to provide summer services to prevent that regression.
Data also dictates where a child learns. Special educators use assessment data to justify a student's placement in the Least Restrictive Environment (LRE). The data must prove that the chosen setting—whether a general education classroom with co-teaching or a specialized self-contained room—is the environment where the student can make meaningful progress while interacting with non-disabled peers to the maximum extent appropriate.
Looking to the Future
Finally, special education is inherently temporary; the ultimate goal is independence. In high school, transition assessment data is used to develop measurable post-secondary goals for students with disabilities, mapping out their trajectory for employment, independent living, and further education.
To ensure no student languishes in the system unchecked, the Individuals with Disabilities Education Act mandates that reevaluations occur at least once every three years. This reevaluation data is used to determine if a student continues to need special education and related services.
Through every stage of the special education process, from the initial baseline to the final transition plan, data acts as the ultimate arbiter of truth. It strips away our biases, highlights the student's authentic capabilities, and provides the exact coordinates required to build a masterful instructional plan.