Plate Tectonics and Water's Roles
Not sure you’re ready?
Take the ~3-minute readiness diagnostic and see where you stand.
Beneath the asphalt of a school playground, and extending far below the abyssal plains of the ocean, the Earth is perpetually in motion. To teach a young mind about planetary systems—specifically plate tectonics and the global distribution of water—is to instruct them in the art of visualizing the invisible. Students arrive in the classroom with deeply ingrained observational biases: they believe continents are static, the ground beneath them is entirely solid, fresh water is endlessly available, and classroom maps dictate literal physical reality (such as the belief that "up" on the wall means uphill). Our task as educators is to dismantle these intuitive illusions using empirical data, maps, and precise models. We must build a conceptual bridge between the microscopic pores of water-soaked rock and the massive, grinding margins of continental plates, providing aspiring teachers with the pedagogical content knowledge required to lead students toward genuine scientific literacy.
To understand the surface of the Earth, we must first look beneath it. Earth's outer shell is divided into several hard and rigid pieces called tectonic plates. These slabs of rock do not sit stationary like tiles on a floor; instead, tectonic plates glide slowly over Earth's hotter and semi-fluid mantle layer. The mechanism is driven by immense heat radiating from the Earth's core, creating convection currents that carry the rigid crust along with them.
When introducing this to elementary students, a critical spatial bias immediately emerges.
Instructional Warning: A common student misconception is that tectonic plates perfectly match the shapes of visible continents.
Children look at a globe, see Africa or South America, and assume those isolated landmasses are individual "puzzle pieces" floating in water. You must explicitly teach that tectonic plates can include both continental landmasses and ocean floors acting as a single, rigid unit. The North American Plate, for example, carries not just the United States and Canada, but also the western half of the Atlantic Ocean floor.
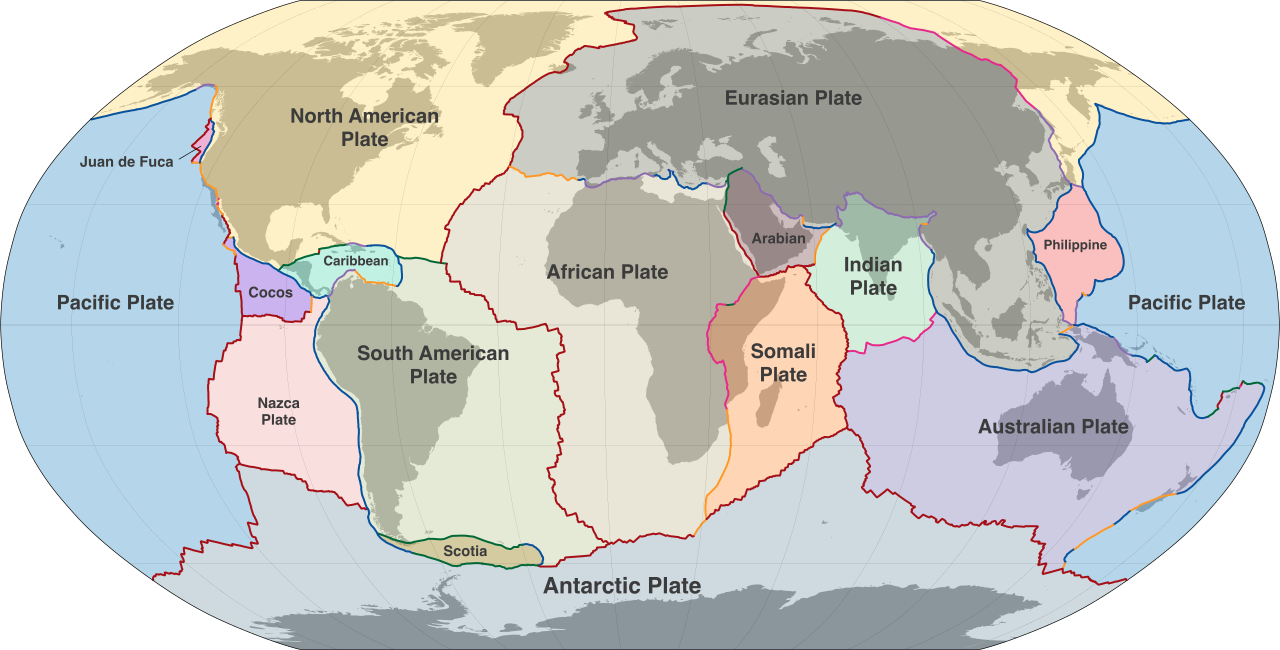
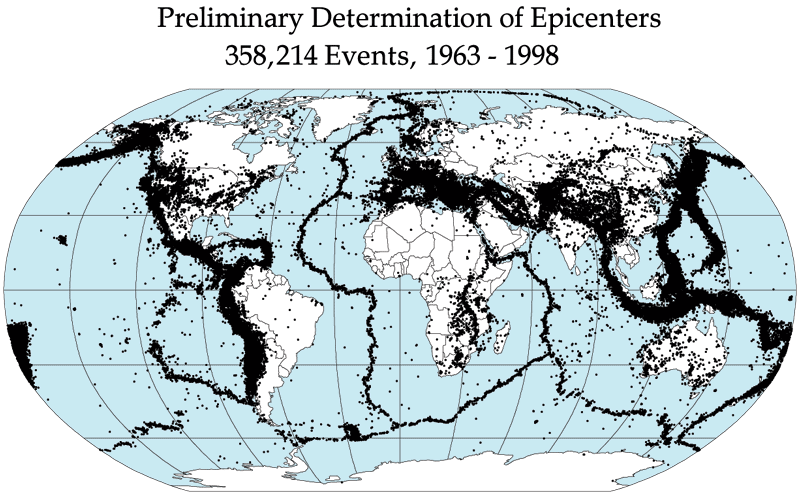
If tectonic plates are invisible to the naked eye, how do we know where their boundaries lie? In science, we find the invisible by measuring its effects. When you present students with planetary data sets, the edges of the plates draw themselves.
Maps of historical earthquake epicenters reveal the outlines of tectonic plate boundaries. By plotting where earthquakes happen, a seemingly random scatterplot instantly organizes into sharp, distinct lines across the globe. Similarly, maps of active volcano locations correspond closely to the edges of tectonic plates.
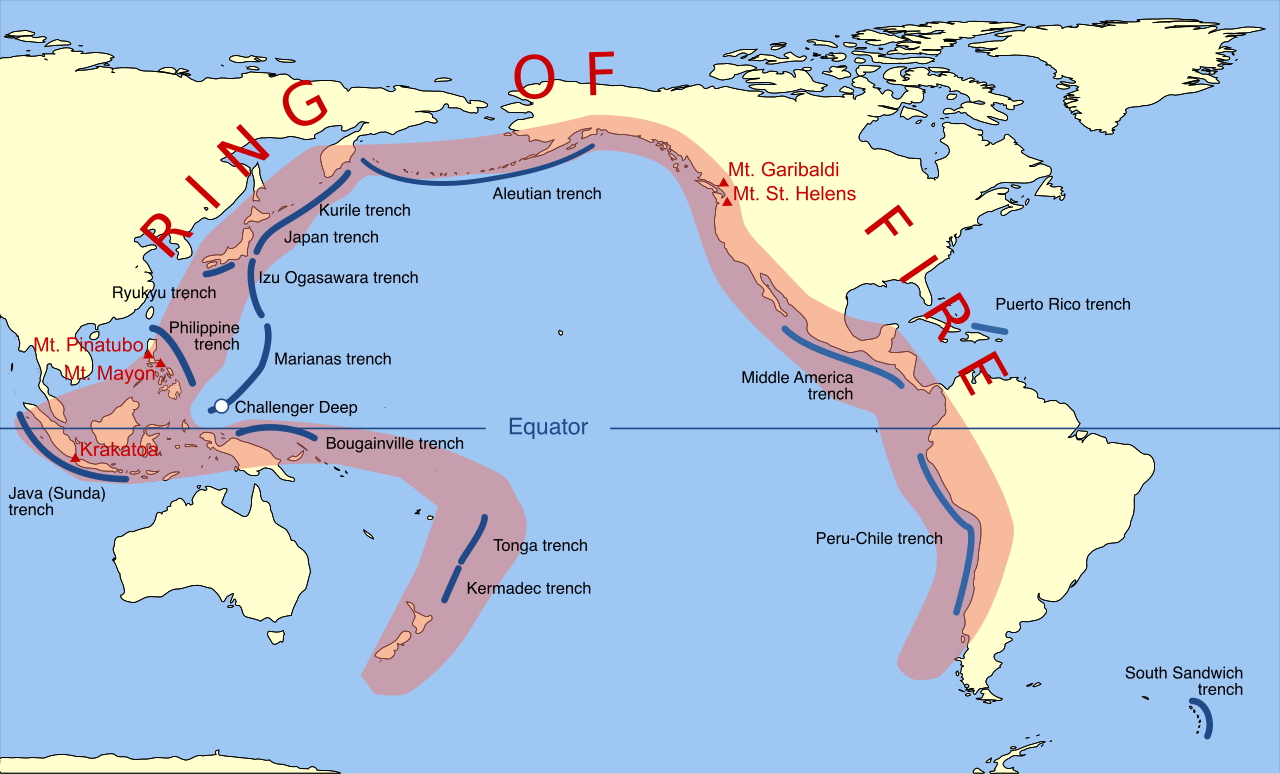
A perfect application of this in the classroom is examining the Pacific Ocean.
- The Ring of Fire is a horseshoe-shaped geographic region around the Pacific Ocean basin.
- Because it sits on a highly active tectonic margin, the Ring of Fire experiences exceptionally frequent earthquakes and volcanic eruptions.
- When students overlay a map of plate tectonics onto a map of volcanoes, they will discover that the boundaries of the Pacific Plate roughly align with the Ring of Fire.
Where these massive plates meet, the crust of the Earth is fundamentally reshaped. We classify these interactions by their movement:
Convergent Boundaries (Colliding)
Convergent plate boundaries occur where two tectonic plates move toward each other and collide. When two plates carrying buoyant continental crust crash into one another, the rock has nowhere to go but up. As a result, large mountain ranges frequently form along convergent plate boundaries.
If you ask students to examine a physical map of the world, a distinct geographic pattern emerges: analyzing world maps reveals that major mountain ranges often parallel the coastlines of continents (such as the Andes running down the western coast of South America). This parallel alignment is a direct geographical artifact of oceanic plates converging with continental plates at the coastline.
Subduction Zones (Diving)
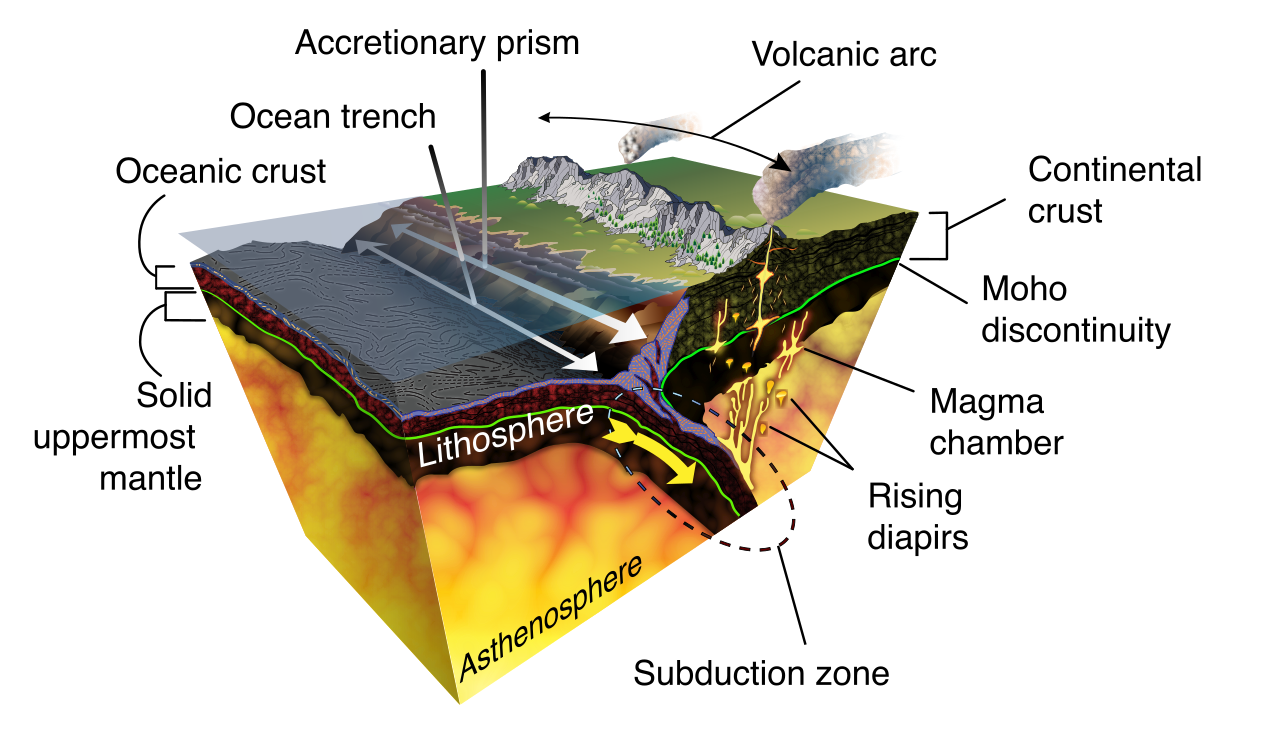
A specific and violent type of convergence happens when a dense oceanic plate meets a lighter continental plate. Subduction zones occur where one tectonic plate is forced beneath another tectonic plate. As the dense rock dives deep into the mantle, it drags the seafloor down with it. Consequently, deep ocean trenches typically form along tectonic subduction zones.
Divergent Boundaries (Separating)
Divergent plate boundaries occur where two tectonic plates pull apart from each other. As the plates separate, magma from the mantle rises to fill the expanding gap, cooling to form new crust. Because of this continuous eruption and cooling, mid-ocean ridges typically form at divergent plate boundaries.
It is easy for students to underestimate the scale of these features because they are hidden under miles of water, but mid-ocean ridges are extensive underwater mountain systems—in fact, they form the longest continuous mountain range in the solar system.
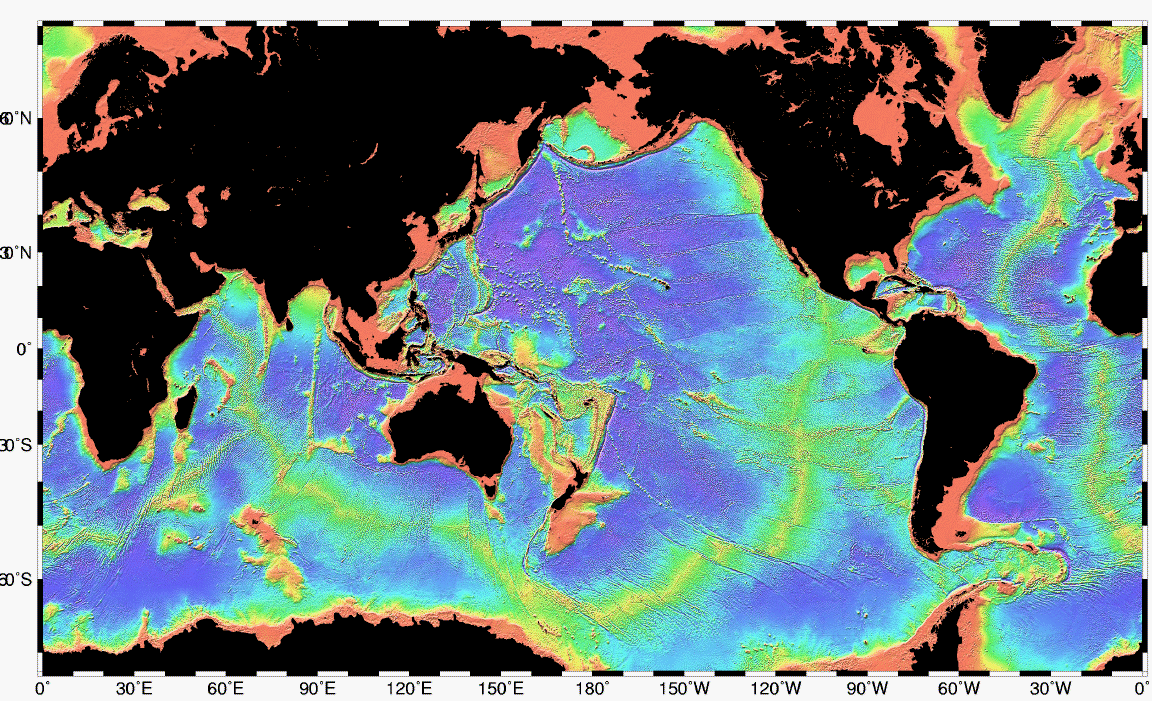
Visualizing Topography
To teach these features, educators must utilize the correct cartographic tools.
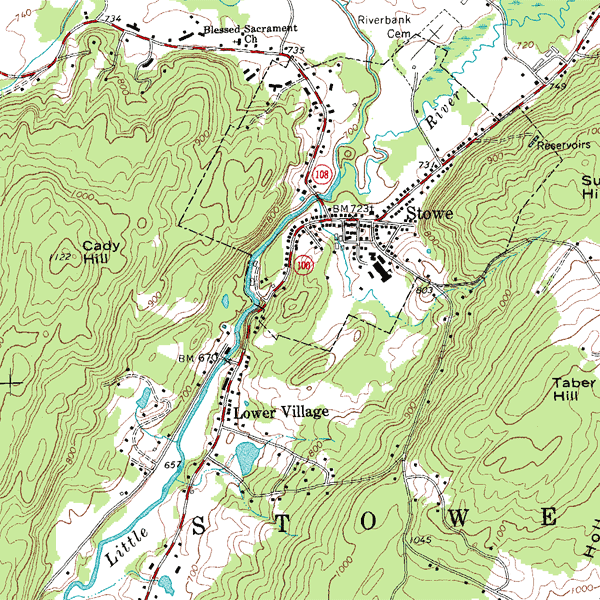
- Topographic maps use contour lines to represent the elevation and shape of land features above sea level.
- However, to reveal the hidden trenches and mid-ocean ridges to your students, you must utilize bathymetric maps, which display the underwater depth and topography of ocean floors.
Having established the rigid, shifting container of the Earth's crust, we must now examine the fluids that pool upon it. Approximately 71 percent of the Earth's surface is covered by water.
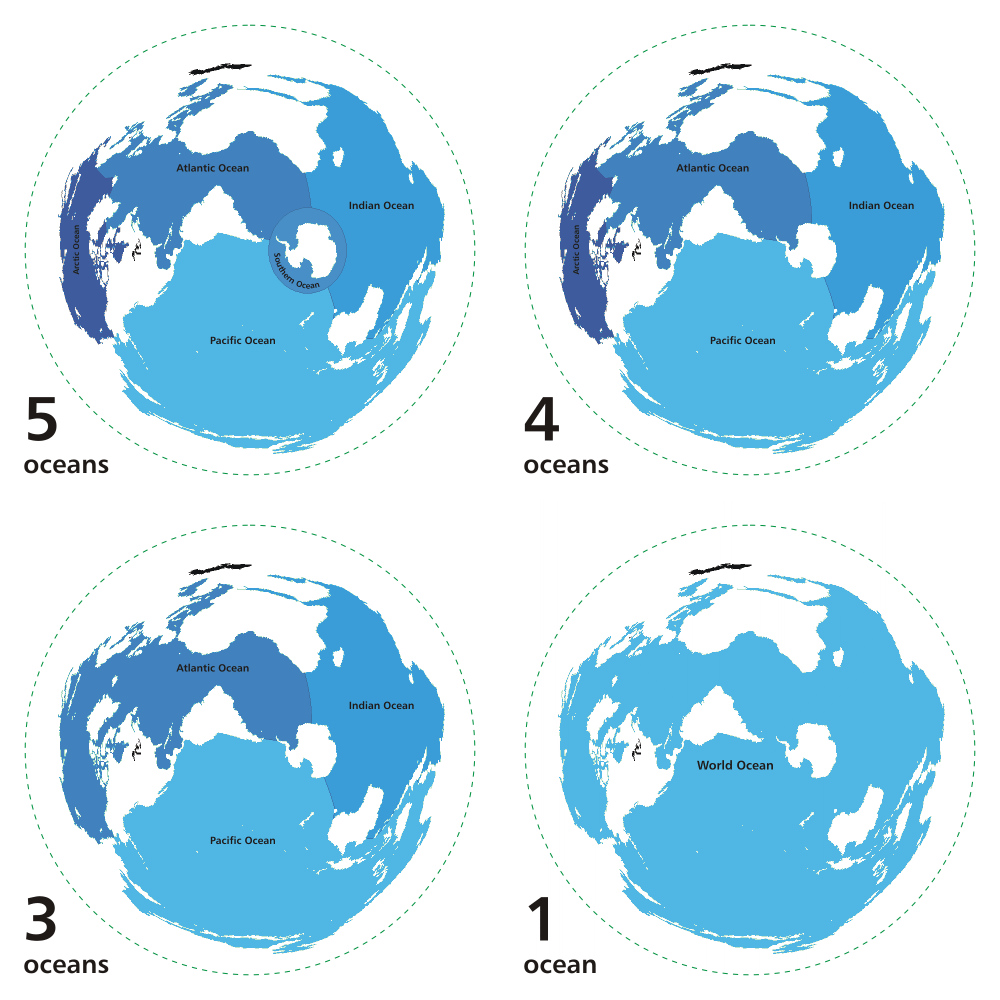
When children look at maps, the presence of localized names—the Atlantic, the Pacific, the Indian—suggests distinct, separate pools. In reality, map data shows that the world's major oceans are continuously interconnected into a single global ocean.
To understand water's role, students must grasp its immense volume and highly unequal distribution.
| Water Source | Percentage of Earth's Total Water |
|---|---|
| Oceans (Salt Water) | Approximately 96.5% |
| Fresh Water | Only about 2.5% |
| Saline Groundwater & Lakes | Approximately 0.9% |
Note: Oceans contain approximately 96.5 percent of all water on Earth, and saline groundwater and saline lakes account for approximately 0.9 percent of Earth's total water, making the vast majority of our planet's water undrinkable.
The Pedagogy of Graphing Water Data
Teaching the disparity between salt and fresh water is an exercise in data visualization. The type of graph you choose directly impacts student comprehension.
- Pie charts are highly effective visual tools for graphing the vast disparity between Earth's salt water and fresh water percentages. By utilizing a pie chart, the 2.5% fresh water becomes a tiny, fragile sliver against a massive wheel of ocean water, viscerally communicating scarcity.
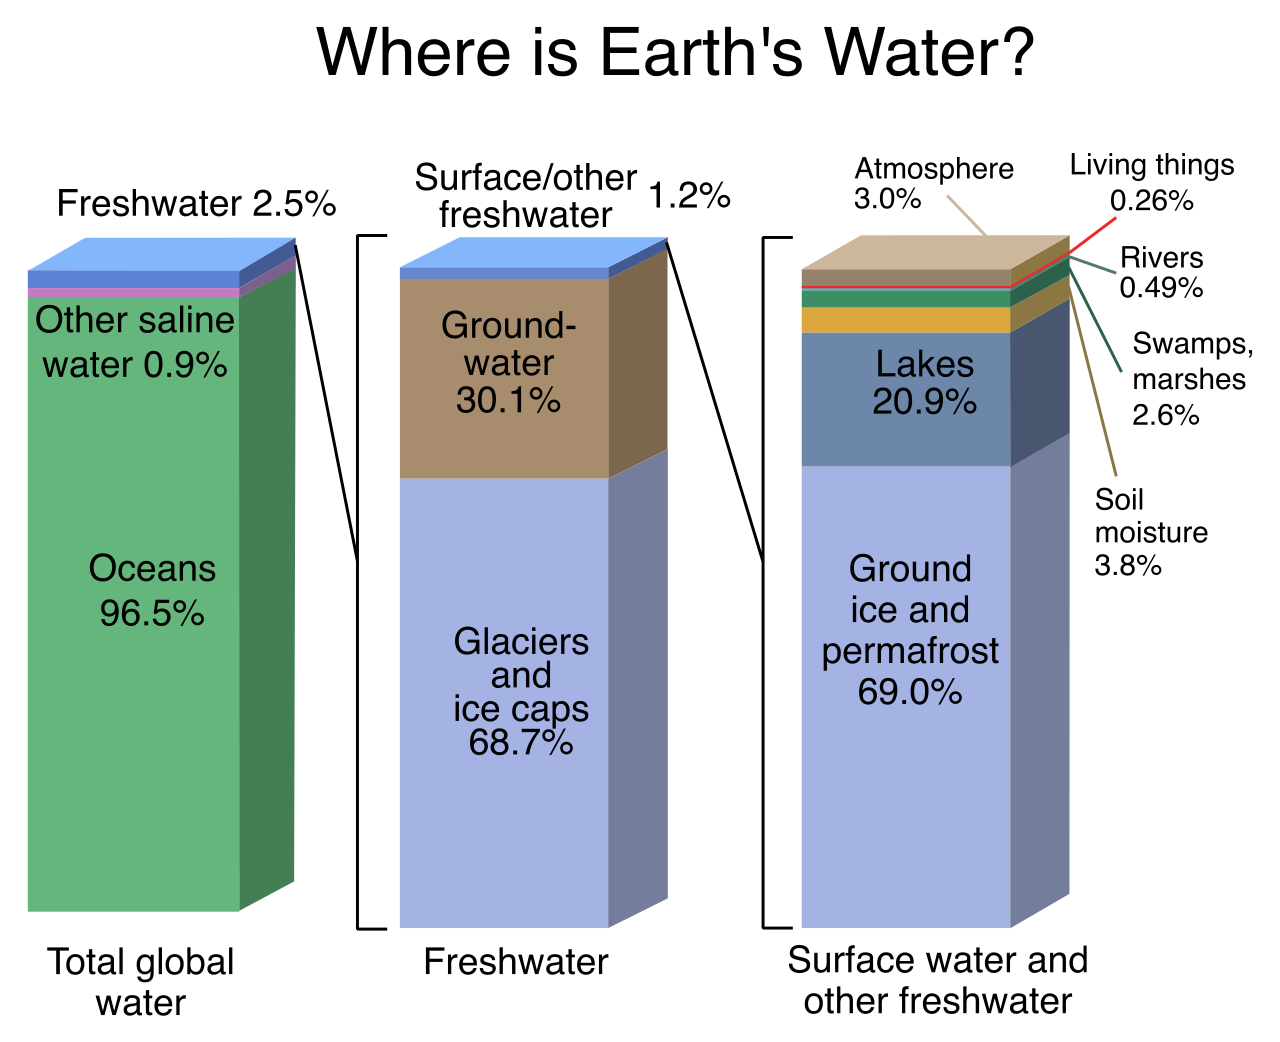
- Conversely, bar graphs are commonly used to compare the specific proportions of different fresh water sources. Because the subsets of fresh water (glaciers, groundwater, surface water) are fractions of a fraction, a pie chart of the whole Earth would render them invisible. A bar graph allows students to isolate that 2.5% and compare its internal components clearly.
Instructional Warning: A common student misconception is that most of Earth's fresh water is readily accessible for human consumption.
Children turn on a tap and water flows; they see rivers and lakes in their towns. Thus, they assume fresh water is primarily surface liquid. The reality is drastically different. We divide fresh water into three primary categories:
1. Solid Water (68.7% of Fresh Water)
Glaciers and ice caps contain approximately 68.7 percent of the fresh water on Earth. They are, by far, the largest reservoirs of solid water on Earth. This vast amount of frozen water is locked away from daily human use because most of Earth's solid water is located in polar regions and high mountain elevations.
2. Groundwater (30.1% of Fresh Water)
The second-largest cache of fresh water is directly beneath our feet. Groundwater constitutes approximately 30.1 percent of the fresh water on Earth. By definition, groundwater is liquid water stored beneath Earth's solid surface.
Instructional Warning: A common student misconception is that groundwater exists as large hollow underground rivers or lakes.
If you ask a third-grader to draw groundwater, they will often sketch an enormous underground cavern filled with splashing water. You must correct this with a more accurate physical model—like a damp kitchen sponge. Groundwater resides in the microscopic pores and fractures of underground rock formations and soil. It slowly seeps and saturates the earth rather than flowing in hollow subterranean tubes.
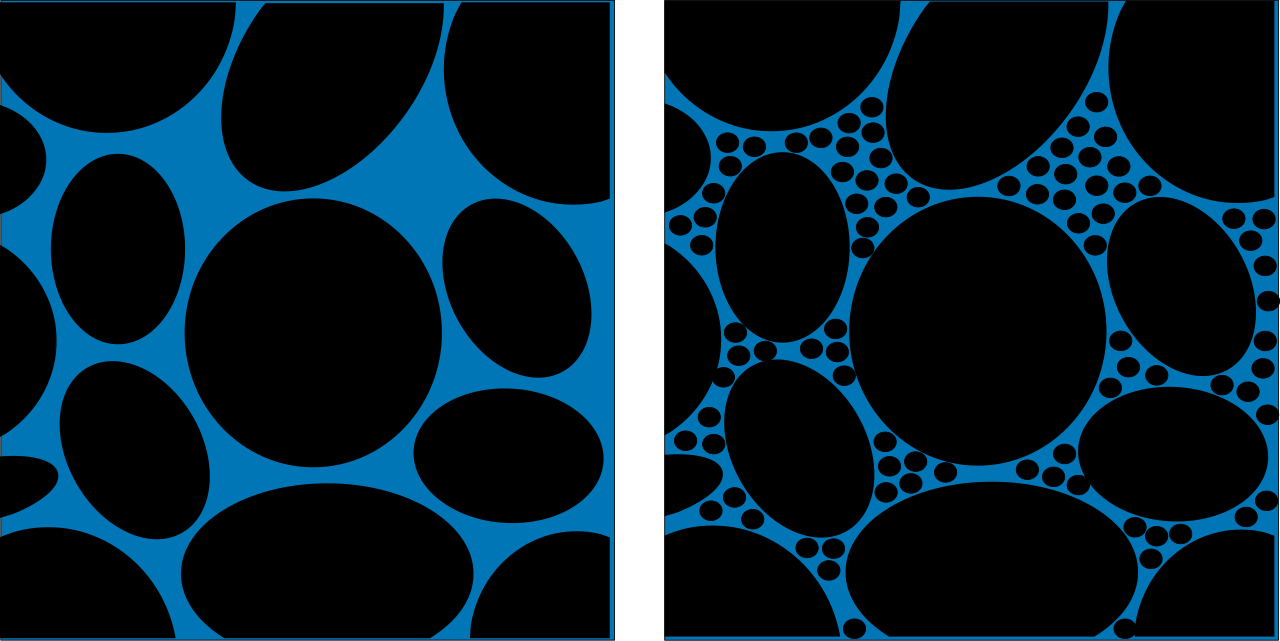
3. Surface Water (1.2% of Fresh Water)
The fresh water that humans actually see and interact with represents a statistical anomaly. Surface water comprises only about 1.2 percent of all fresh water on Earth. This fraction of a fraction of surface freshwater is predominantly found in lakes, rivers, and swamps.
When teaching about rivers, educators inevitably encounter a profound spatial mapping error.
Instructional Warning: A common student misconception is that all rivers automatically flow from north to south on a map.
Because maps are usually hung on walls, "North" aligns with the classroom ceiling, and "South" aligns with the floor. Students intuitively assume rivers must flow "down" the wall toward the South. You must explicitly decouple map orientation from gravity. Teach them that rivers flow downhill due to gravity regardless of map orientation. The Nile River, for instance, flows North because the elevation of the African continent drops toward the Mediterranean Sea.
Finally, a comprehensive understanding of the hydrosphere requires looking to the sky. Water cycles continuously through the atmosphere, transitioning between states of matter. Here, empirical reality collides sharply with student intuition.
Water vapor in the atmosphere is an invisible gas. Because it exists entirely in a gaseous state, water vapor is not considered liquid or solid water. It is the humidity you feel on a summer day, entirely unseen.
Instructional Warning: A common student misconception is that clouds are composed of invisible water vapor gas.
Students learn that water evaporates into a gas, they look up, see white, fluffy clouds, and deduce that clouds are the gas. The logic is understandable but flawed. If you can see something in the sky blocking the sun, it is interacting with light; therefore, it is no longer an invisible gas. You must clarify that as water vapor rises and cools, it condenses. Clouds are composed of tiny liquid water droplets or solid ice crystals suspended in the atmosphere.
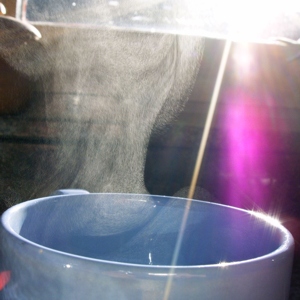
When you teach a child that a cloud is essentially a floating lake of microscopic liquid droplets, you have succeeded in your primary objective: you have taught them to see the mechanics of the Earth as they truly are.