Correlation vs. Causation
Not sure you’re ready?
Take the ~3-minute readiness diagnostic and see where you stand.
If you stand on a busy street corner and watch the sky, you will eventually notice a reliable pattern: whenever people open their umbrellas, the pavement gets wet. The two variables are intimately linked. But if you were to run through the crowd and steal everyone's umbrella, the rain would still fall. The umbrellas do not cause the rain; they merely fluctuate alongside it. This distinction—between observing that two things happen together and proving that one forces the other to occur—is the foundational bedrock of scientific and mathematical reasoning.
To master the mathematics of the physical and social world, we must learn to separate the shadows of observation from the gears of direct influence.
Before we can ask why something happens, we must first document what is happening. We do this by collecting data. Observational studies gather data without manipulating the variables. We simply record the world exactly as we find it. Because we are merely watching, observational studies can establish mathematical correlations between variables.
Correlation is a statistical relationship indicating that two variables fluctuate together. We classify these fluctuations by their direction:
- A positive correlation means that as one variable increases, the other variable also increases. For instance, as the hours spent studying increase, exam scores tend to increase.
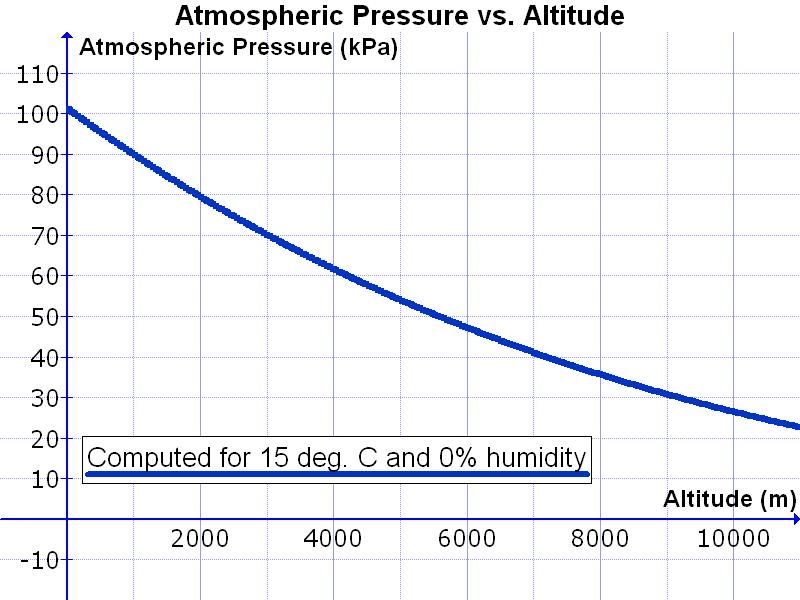
- A negative correlation means that as one variable increases, the other variable decreases. As the altitude of a mountain increases, the air pressure decreases.
Visualizing and Quantifying the Link
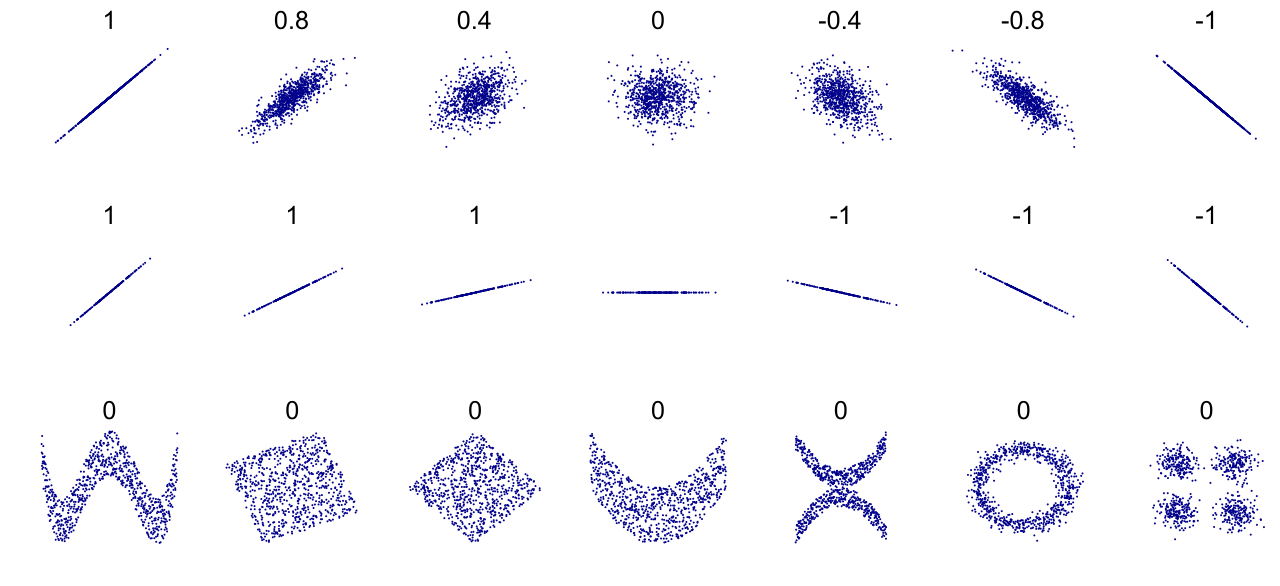
To make sense of these relationships, mathematicians rely on specific visual and numerical tools. Scatterplots visually display the statistical correlation between two quantitative variables. By plotting one variable on the horizontal x-axis and the other on the vertical y-axis, we can immediately see if the data points form an ascending line, a descending line, or a formless cloud.
Beyond visual intuition, we quantify the exact mathematical tightness of this relationship. The correlation coefficient mathematically measures the strength of a linear relationship between two variables. Designated by the letter r, the correlation coefficient is a numerical value ranging strictly from negative one to positive one.
- A value of +1 indicates a perfect positive linear relationship.
- A value of −1 indicates a perfect negative linear relationship.
- A value of 0 means the variables are scattered entirely at random with no linear relationship whatsoever.
It is profoundly tempting for the human mind to look at a scatterplot showing a tight upward cluster of dots and declare a mechanism. But correlation only measures the association. Causation indicates that a change in one variable directly produces a specific effect in another variable. Causation is the invisible gear turning the machine.
Here is the central axiom of statistics: The presence of a correlation between two variables does not prove that one variable causes the other to change.
The Golden Rule of Statistics A strong mathematical correlation is logically insufficient on its own to justify a claim of causation.
Why must we be so strict? Because observational studies cannot definitively establish causation between variables. They show us the mathematical shadow on the wall, but they do not tell us what is casting the shadow. To claim causation, we must demand a higher standard of proof.
If you are asked to judge a scenario in the real world, you must become a skeptical detective. Evaluating a scenario for causation requires identifying alternative explanations for the observed relationship. Once you have found them, evaluating a scenario for causation requires ruling out alternative explanations for the observed relationship. Until you eliminate the illusions, you cannot claim a fundamental truth.
When two variables fluctuate together, there are three common alternative explanations that trick us into seeing a causal link that does not exist.
1. The Third Wheel: Confounding Variables
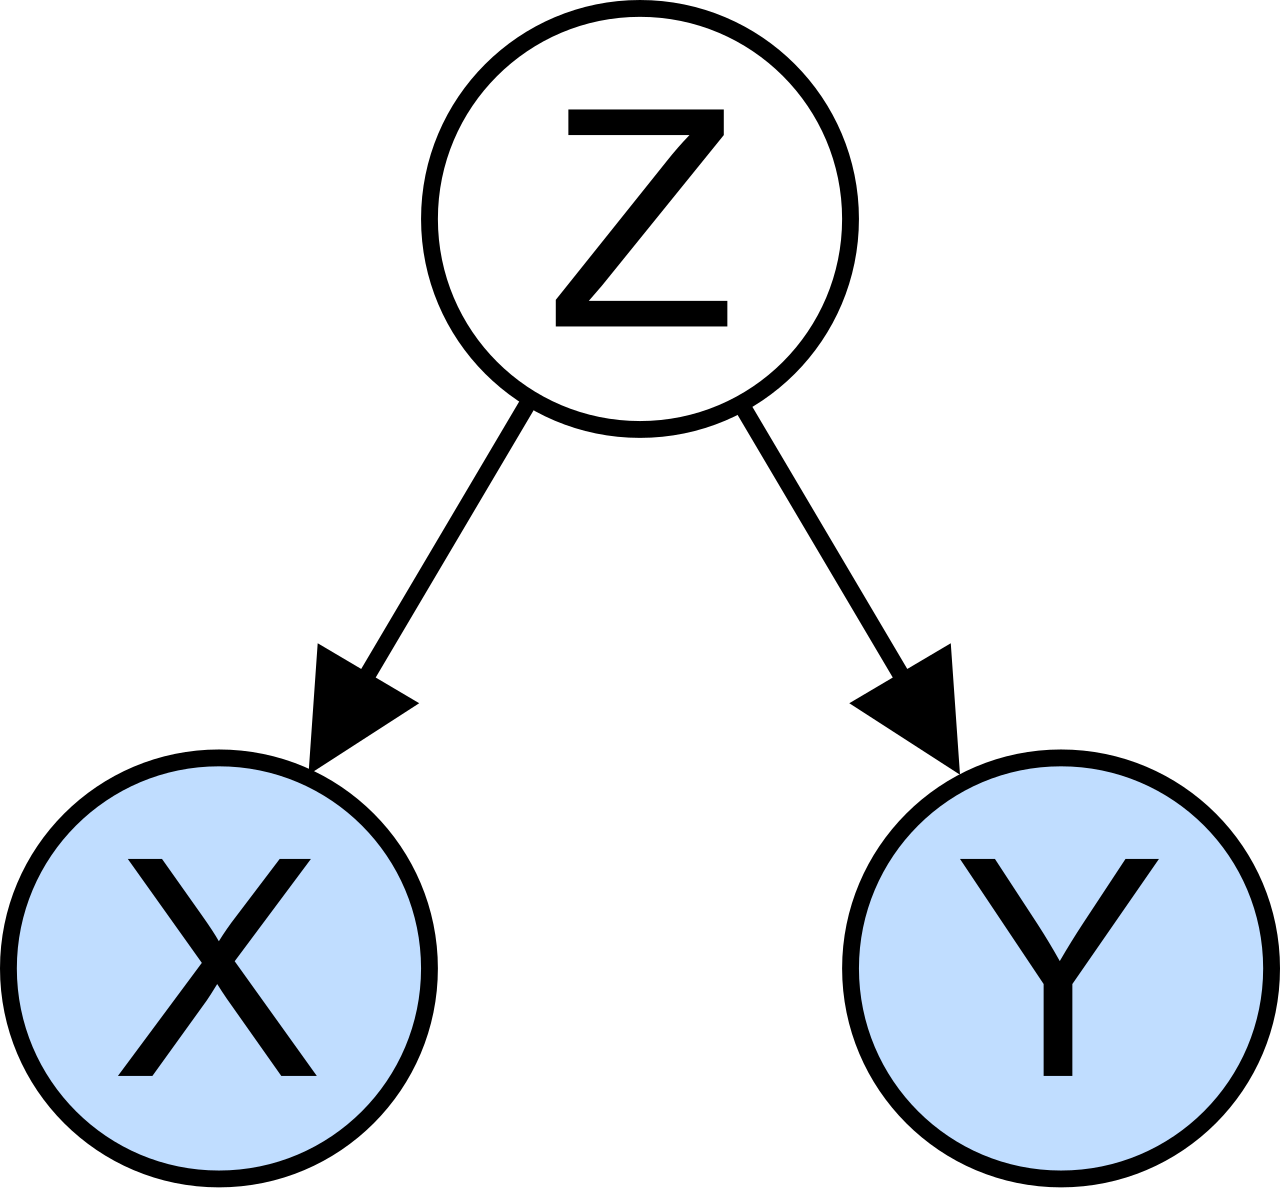
Confounding variables are unmeasured external factors that independently affect both of the correlated variables. The presence of a confounding variable can create a false appearance of a direct causal relationship between two observed variables.
Consider a classic statistical trap: Ice cream sales and sunburn rates exhibit a positive statistical correlation in real-world data. As one goes up, the other reliably goes up. However, assuming ice cream consumption causes sunburns based on their positive correlation is a common logical fallacy. Obviously, eating a frozen dessert does not damage your skin cells.
The missing piece of the puzzle is the ambient temperature. A confounding variable like hot weather can independently cause increases in both ice cream sales and sunburn rates. Summer is the hidden driver pushing both variables upward simultaneously.
2. The Backward Arrow: Reverse Causation
Sometimes the arrow of time is simply misread. Reverse causation occurs when the assumed direction of cause and effect between two variables is actually the opposite of reality.
Imagine observing a strong positive correlation between the number of police officers in a city neighborhood and the volume of violent crime in that neighborhood. If you assume the presence of police causes the crime, you have fallen prey to reverse causation. In reality, the high crime rate caused the city to assign more police officers to that area.
3. Spuriousness: Random Coincidence
If you search hard enough through massive datasets, you will inevitably find patterns that are entirely meaningless. Because the universe is vast and chaotic, two entirely unrelated variables can exhibit a strong statistical correlation purely by random coincidence.
For example, statistical trackers have found a nearly perfect year-over-year positive correlation between the per capita consumption of cheese in the United States and the number of people who became tangled in their bedsheets. There is no confounding variable here, and there is no reverse causation. It is nothing more than statistical noise.
If observational studies routinely fail us for proving causation, what works? If we want to know what the gears are doing, we cannot just watch the machine—we must intervene. We must tinker with the universe.
Controlled experiments measure the effect of an actively manipulated independent variable on a dependent variable. By holding all other environmental factors constant in a laboratory, we eliminate the outside noise.
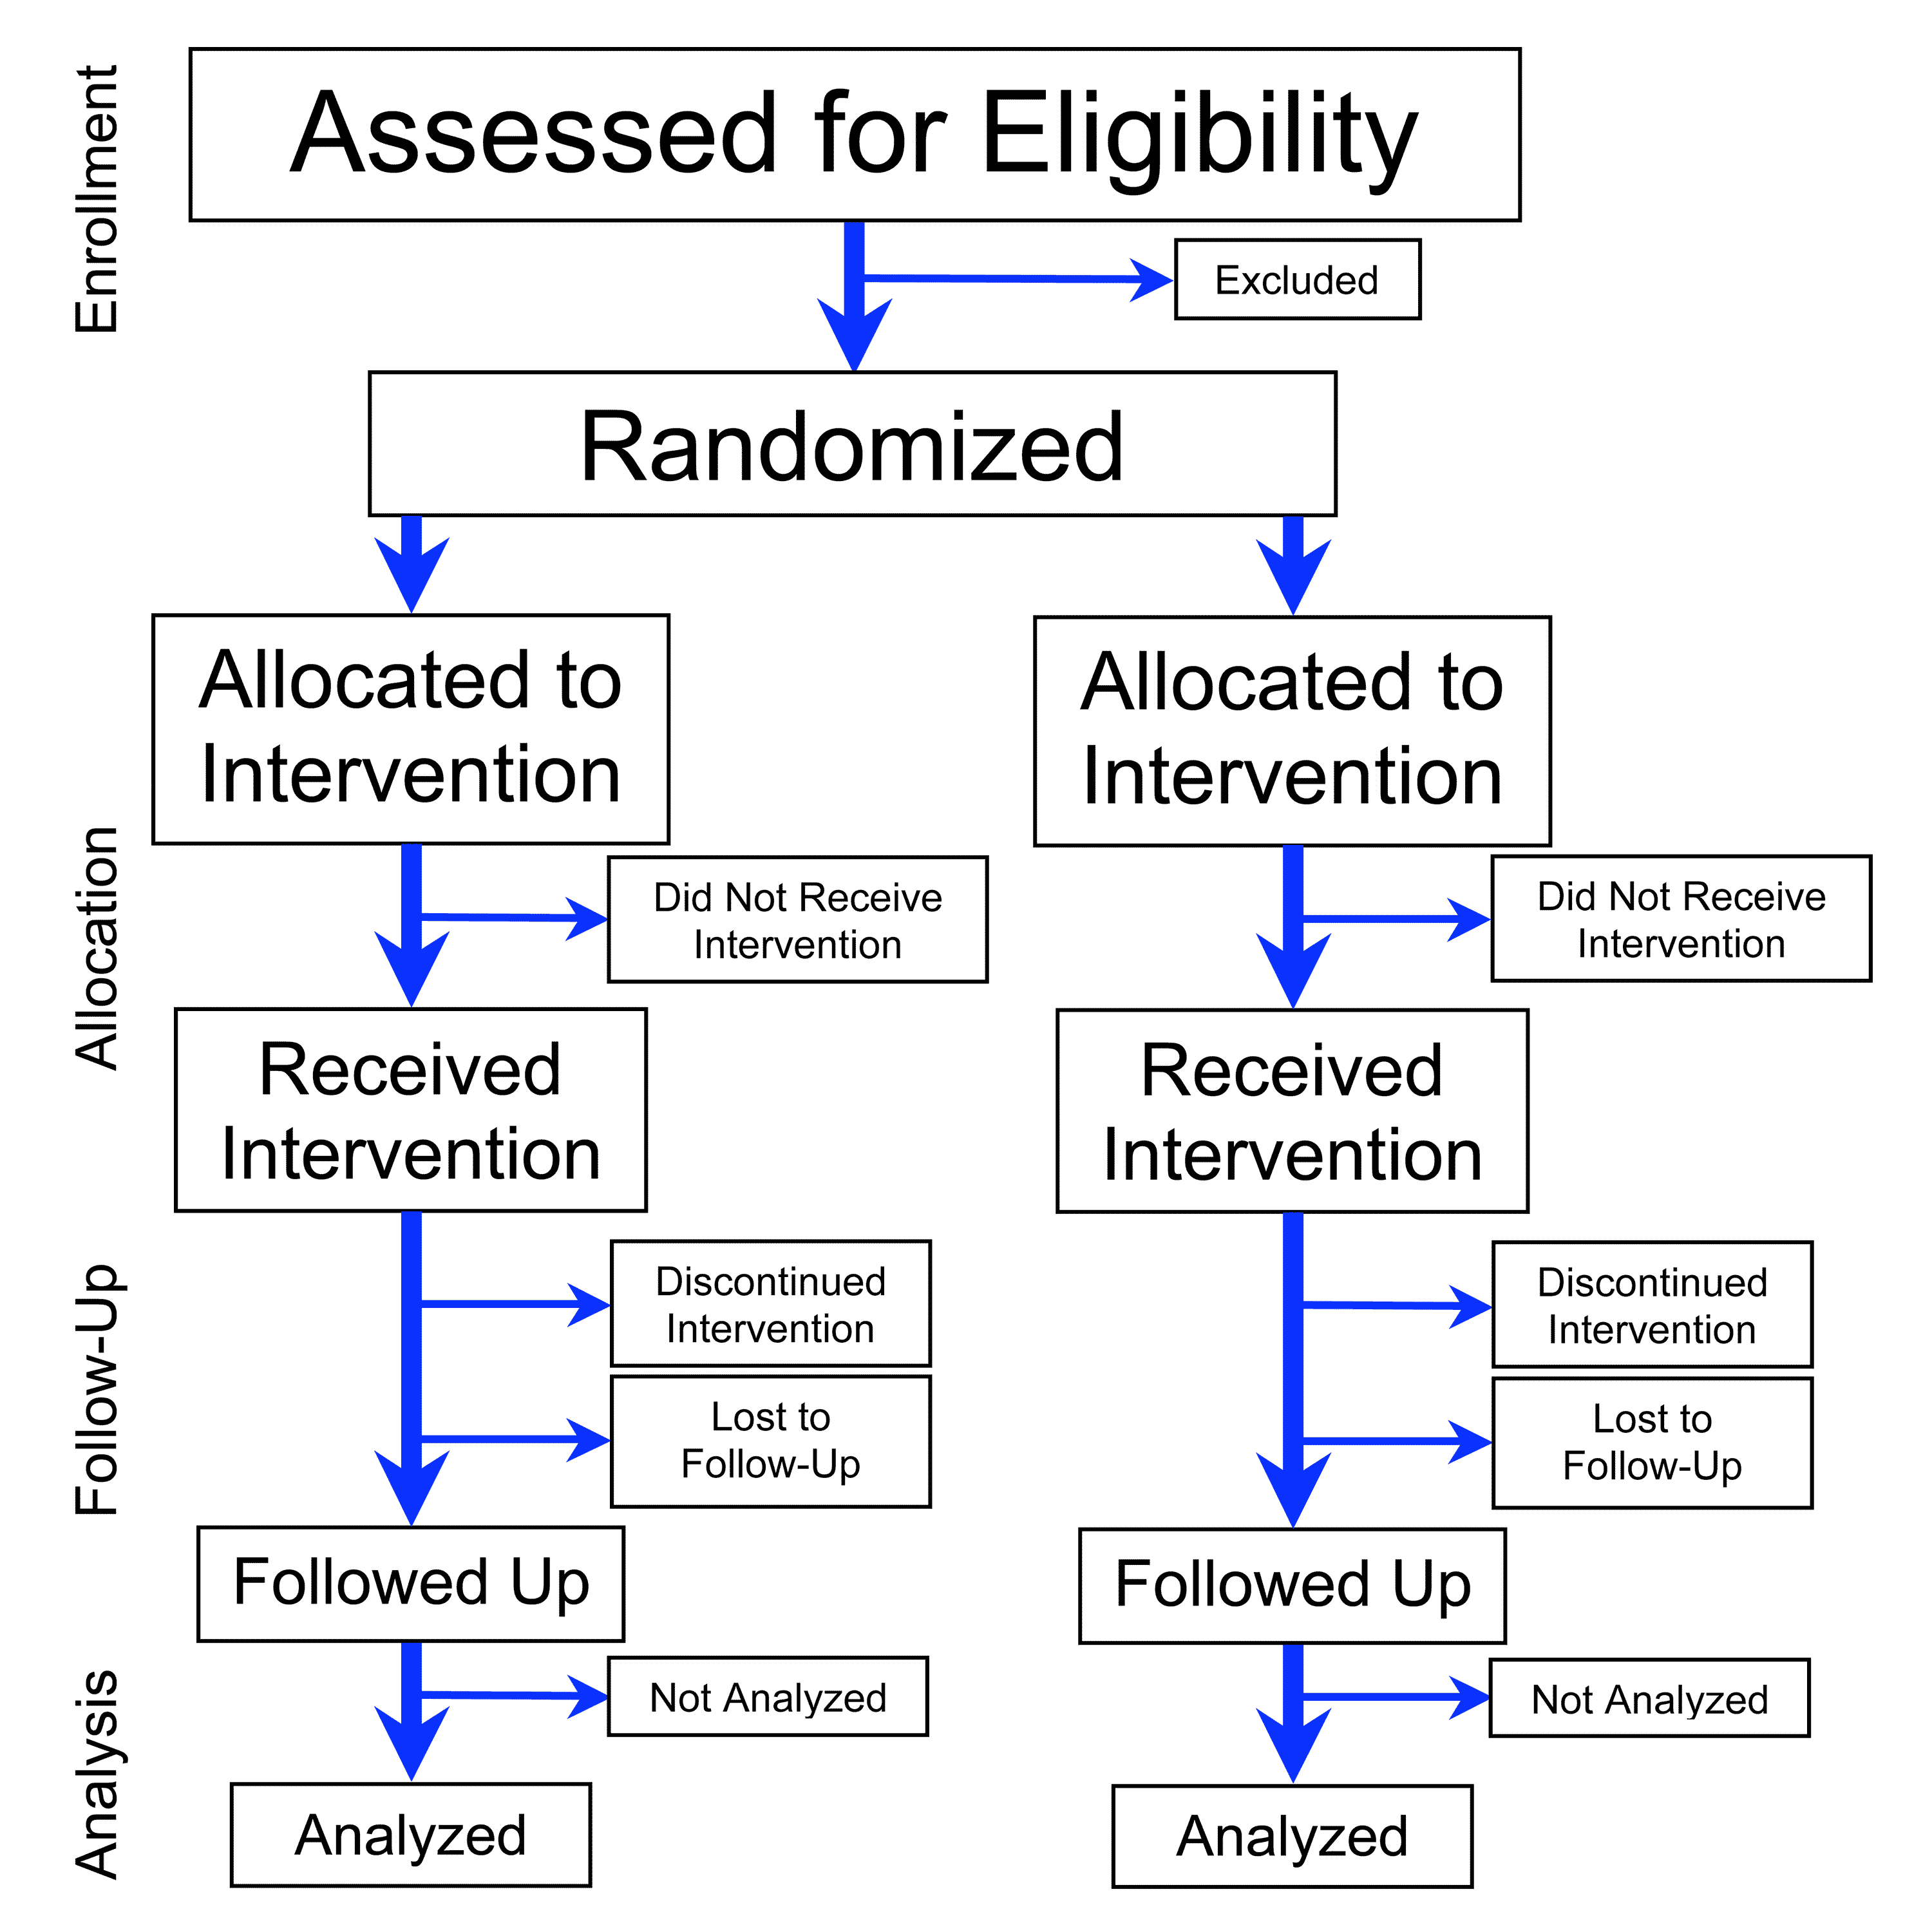
However, in the real world (such as in medicine or education), we cannot hold everything perfectly constant. We solve this through randomization. Randomized controlled experiments are the primary statistical method used to establish true causation between variables. By taking a large group of participants and randomly assigning them to either a treatment group or a control group, we ensure that any hidden confounding variables—like genetics, diet, or prior knowledge—are distributed evenly across both groups.
When you eliminate the confounders, the reverse causation, and the random chance, whatever difference remains between the two groups can finally be declared, with mathematical and scientific confidence, as cause and effect.