Asset allocation and portfolio diversification
Imagine attempting to predict the outcome of a massive, chaotic physical system—like fluid dynamics or atmospheric weather—by tracking the trajectory of a single microscopic particle. The erratic behavior of that isolated particle makes prediction impossible. Yet, when you aggregate billions of these particles, stable, predictable patterns emerge. The same principle governs financial markets. Instead of attempting to guess the trajectory of a single company's stock, we construct a resilient aggregate system. We shift our focus from the unpredictable behavior of the individual asset to the highly quantifiable interactions between multiple assets. This paradigm shift from isolated selection to systemic design is the foundational bedrock of modern asset allocation.

Before the mid-20th century, investors largely viewed portfolios as mere collections of individually "good" investments. If an investor found ten strong companies, they bought them, assuming a portfolio of good stocks made a good portfolio.
In 1952, a young graduate student named Harry Markowitz introduced Modern Portfolio Theory in a seminal paper, fundamentally shattering this notion. He proved that the risk of an individual asset matters far less than how that asset behaves relative to the other assets in the portfolio. In 1990, Harry Markowitz won the Nobel Memorial Prize in Economic Sciences for his work on Modern Portfolio Theory, permanently altering the landscape of wealth management.
Modern Portfolio Theory (MPT) asserts that a risk-averse investor can construct an optimal portfolio that maximizes expected return for a given level of risk.
To achieve this optimization, practitioners utilize asset allocation, which is the strategy of dividing an investment portfolio across various distinct asset classes like equities, fixed income, and cash equivalents.
To optimize a portfolio, we must first dissect the nature of risk itself. Total portfolio risk is not a monolith; rather, total portfolio risk consists of both systematic risk and unsystematic risk. As a financial planner, your ability to manage a client's wealth hinges entirely on distinguishing between these two forces.
Unsystematic Risk
Unsystematic risk is the company-specific risk inherent in a specific individual investment. Consider a pharmaceutical company facing a sudden FDA drug rejection, or an airline suffering a pilot strike. These events ravage the specific stock but do not crash the global economy.
Because this risk is isolated, unsystematic risk can be mathematically eliminated through adequate portfolio diversification. By holding a broad array of assets, the negative idiosyncratic events of a few companies are offset by the positive idiosyncratic events of others. In fact, empirical data demonstrates that a portfolio eliminates nearly all unsystematic risk when it holds approximately 20 to 30 randomly selected stocks. Holding one stock is gambling; holding thirty removes the localized hazard.
Systematic Risk
Conversely, systematic risk is the broad market risk that affects all investments in a specific asset class. Think of macroeconomic variables: sudden changes in interest rates, global pandemics, or geopolitical conflicts. These forces act like gravity; they pull on the entire market. Therefore, systematic risk cannot be eliminated through portfolio diversification. No matter how many stocks you own, a global recession will impact your equity holdings.
| Risk Type | Source | Eliminable via Diversification? | Primary Metric |
|---|---|---|---|
| Unsystematic | Company-specific events (strikes, lawsuits) | Yes (Requires 20-30 random stocks) | N/A (Diversified away) |
| Systematic | Macroeconomic events (inflation, wars) | No | Beta (β) |
| Total Risk | Both systematic and unsystematic | Partially | Standard Deviation (σ) |
To quantify these forces, we use two distinct metrics:
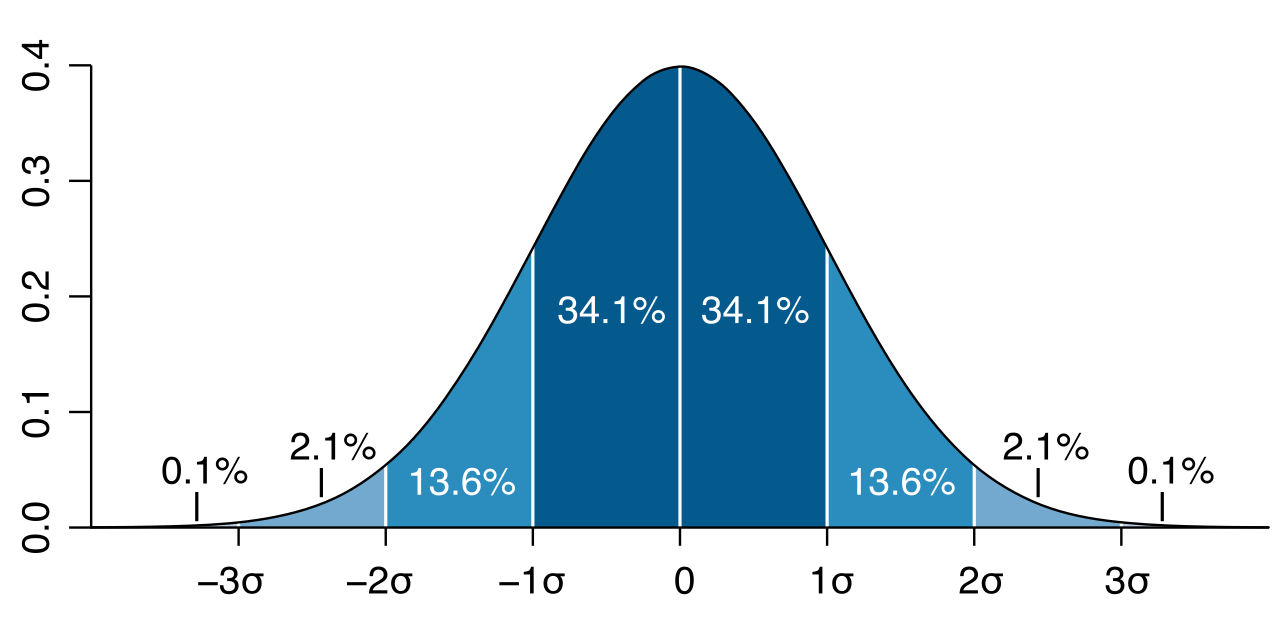
- Standard deviation measures the total risk of an investment portfolio, capturing every fluctuation, whether caused by market-wide panic or a single CEO's scandal.
- Beta measures a portfolio's systematic risk relative to the overall market. It strips away the company-specific noise and tells you exactly how sensitive your portfolio is to the unavoidable macroeconomic tides.
How exactly does diversification reduce unsystematic risk? It does so by combining investments that respond differently to identical macroeconomic events.
If you build a portfolio consisting solely of an umbrella manufacturer and a raincoat producer, you are not truly diversified. A prolonged drought will bankrupt both simultaneously. To build structural integrity into a portfolio, we measure exactly how assets interact using two vital statistical tools.
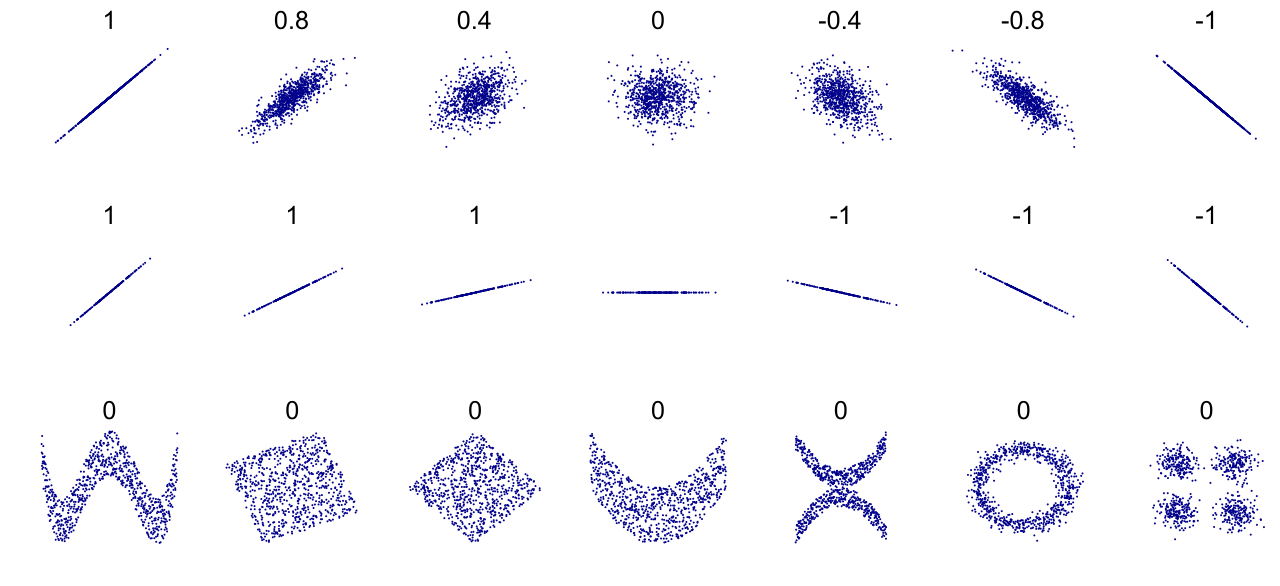
First, covariance measures the directional relationship between the historical returns of two different assets. If they tend to move up and down together, the covariance is positive. If one falls while the other rises, the covariance is negative. However, covariance is an absolute number, making it difficult to interpret across different asset scales.
To solve this, we standardize covariance into the correlation coefficient, which measures the mathematical degree to which two different assets move in relation to each other.
- A correlation coefficient ranges mathematically from negative 1.0 to positive 1.0.
- A correlation coefficient of exactly negative 1.0 indicates that two assets move in perfectly opposite directions. If Asset A drops $10, Asset B rises by precisely proportionate metrics.
- Crucially, you do not need negatively correlated assets to protect a client. Combining assets with a correlation coefficient of less than positive 1.0 reduces overall portfolio risk. As long as the assets do not move in perfect, identical lockstep (+1.0), blending them smooths out the journey.
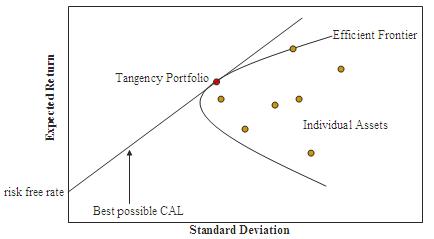
If we plot every conceivable combination of available risky assets on a graph—with expected return on the vertical axis and standard deviation (risk) on the horizontal axis—a distinct curved boundary emerges at the top edge of the data points.
This boundary is the efficient frontier, a graphical representation of optimal portfolios that offer the highest expected return for a specific level of risk.
Think of the efficient frontier as the absolute physical limit of market efficiency.
- Portfolios located below the efficient frontier are considered sub-optimal. For the exact same amount of volatility, the investor could be earning higher returns if they allocated their assets more intelligently.
- Portfolios located above the efficient frontier are mathematically impossible to achieve with the given set of underlying assets. They are the financial equivalent of a perpetual motion machine.
The Capital Market Line (CML)
The efficient frontier deals exclusively with risky assets (like stocks and corporate bonds). But what happens when we introduce a totally risk-free asset, such as a short-term U.S. Treasury Bill, into the equation?
We can draw a tangent line from the risk-free rate on the y-axis directly to the optimal portfolio on the efficient frontier. This creates the Capital Market Line, which represents all portfolios that optimally combine a risk-free asset with the broadly diversified market portfolio.
Importantly, the Capital Market Line uses standard deviation as the measure of risk on its horizontal axis. Any portfolio lying on the CML dominates portfolios lying merely on the efficient frontier, offering the absolute highest Sharpe ratio (return per unit of total risk) possible in the market.
Mathematics provides the efficient frontier, but it cannot tell you which optimal portfolio along that curve a specific client should own. That requires translating human psychology and financial reality into geometry.
Risk Capacity vs. Risk Tolerance
As a fiduciary, you must bifurcate how a client handles risk into two distinct categories:
- Risk capacity represents a client's objective financial ability to endure permanent investment losses without jeopardizing their essential financial goals. This is dictated by their balance sheet, cash flows, and time.
- Risk tolerance represents a client's psychological comfort level with experiencing temporary declines in the value of their investments. This is dictated by their emotional fortitude and behavioral biases.
A young tech executive earning $500,000 annually might panic and sell everything during a 10% market correction. She has massive capacity, but minimal tolerance. You must plan for both.
The Power of the Time Horizon
An investment time horizon is the total length of time a client expects to hold an investment before requiring access to the capital. Time acts as the ultimate shock absorber in finance.
Because markets trend upward over long periods despite short-term volatility, a longer investment time horizon mathematically allows an investor to tolerate a higher level of short-term portfolio volatility. The longer the runway, the heavier the equity allocation the client can sustain.
Finding the Tangency Point
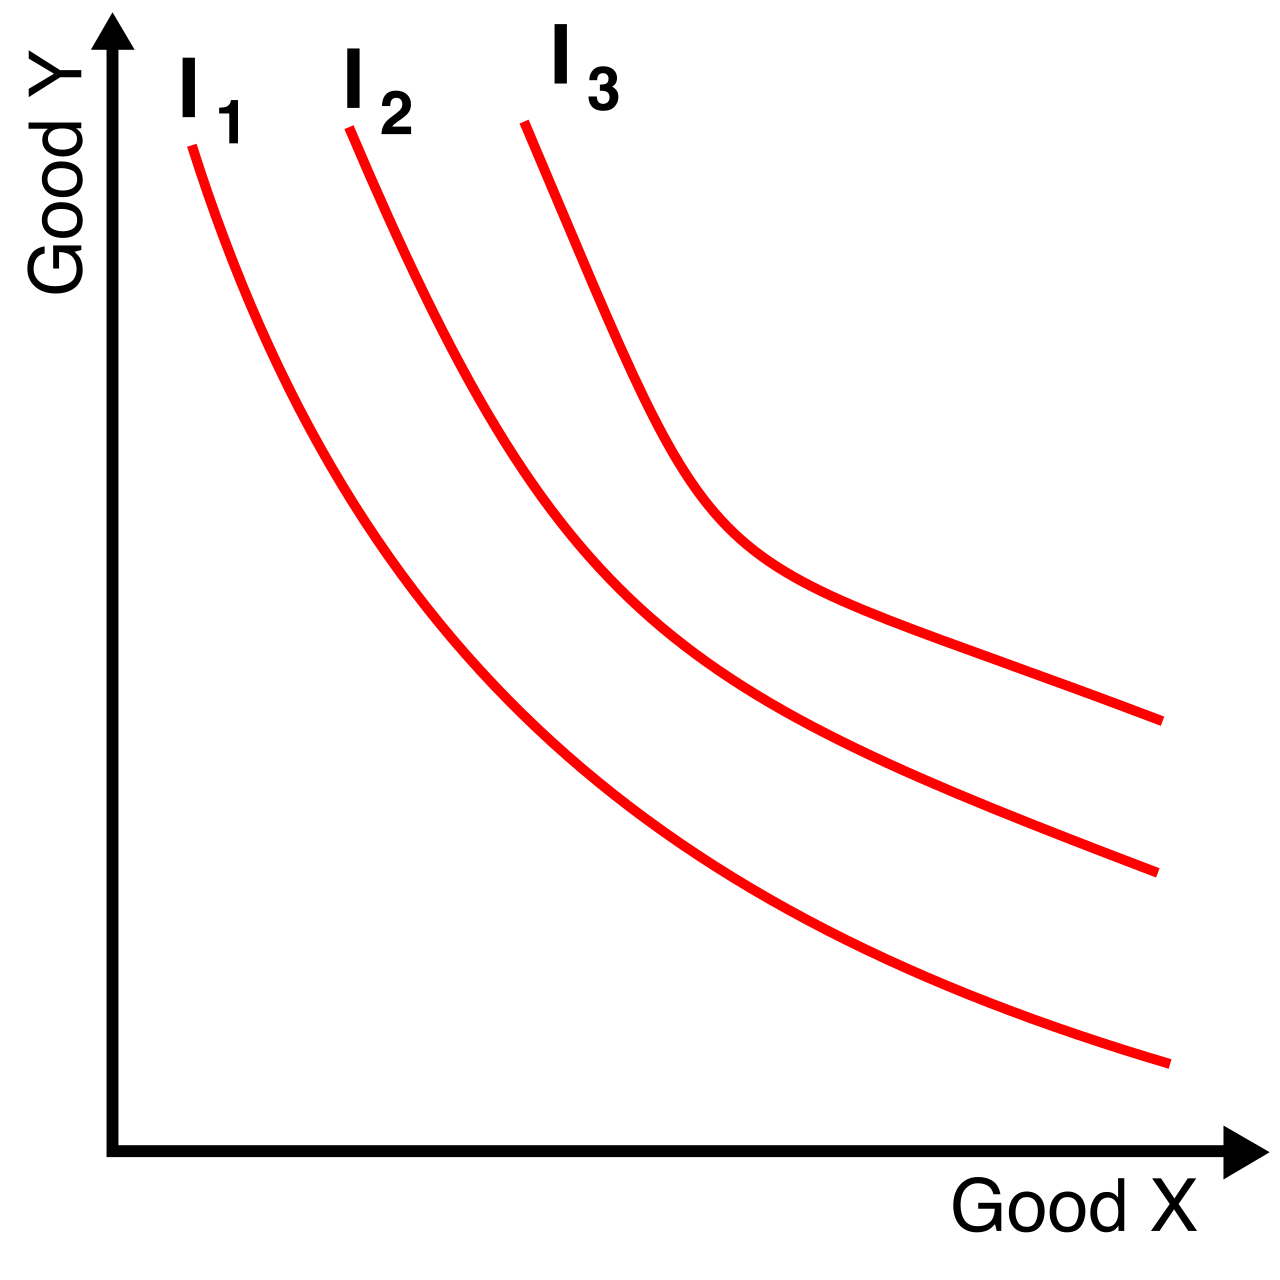
We map a client's unique blend of risk tolerance and return requirements using an investor's indifference curve, which plots the specific combinations of risk and return that yield equal psychological satisfaction to that specific investor. A highly risk-averse client will have a steep indifference curve; they demand massive amounts of return to take on even a tiny bit of additional risk.
The culmination of MPT in financial planning is a geometric certainty: An investor's optimal portfolio occurs at the exact point of tangency between the efficient frontier and the investor's highest achievable indifference curve. This is the precise mathematical point where the realities of the market perfectly intersect with the psychological and financial needs of the human being sitting across your desk.
Once the optimal allocation is calculated, the financial planner must build and maintain the portfolio using distinct operational strategies.
Strategic Asset Allocation and Rebalancing
Strategic asset allocation establishes a proportional baseline mixture of asset classes based on an investor's long-term financial goals. Think of this as the architectural blueprint. If the optimal point dictates 60% equities and 40% bonds, you build exactly that.
However, markets move. If equities experience a massive bull run, that 60/40 portfolio might drift to 70/30, exposing the client to more risk than their indifference curve allows. To fix this, practitioners use portfolio rebalancing, which is the process of realigning the weightings of a portfolio's assets back to the original strategic asset allocation targets. You systematically sell what has gone up (equities) and buy what has lagged (bonds), mechanically enforcing the discipline of buying low and selling high.
Tactical and Core-Satellite Approaches
While strategic allocation is generally passive and static, some managers attempt to exploit market inefficiencies.
- Tactical asset allocation involves actively shifting portfolio capital away from the strategic targets to exploit short-term market pricing anomalies. If a planner believes European equities are temporarily deeply undervalued due to a geopolitical scare, they might tactically shift the equity allocation from 60% up to 65% for a brief period to capture the correction.
- To balance the strict discipline of strategic allocation with the flexibility of active management, many planners employ a core-satellite asset allocation strategy. This uses a primary passive portfolio combined with smaller actively managed investment portions. The "core" (perhaps 80% of the wealth) tracks broad market indexes at an ultra-low cost, while the "satellites" (the remaining 20%) are allocated to high-conviction active managers, alternative investments, or specific sector tilts designed to generate alpha.
Modern Portfolio Theory is not just academic trivia; it is the physical law governing the wealth you will manage. When a client asks why you are adding seemingly underperforming international bonds to their booming tech-stock portfolio, you are not doing it because you hope the bonds beat the stocks. You are doing it because of covariance. You are optimizing their position on the efficient frontier. By deeply understanding these mechanisms—from the mathematical certainty of the Capital Market Line to the behavioral reality of an indifference curve—you transcend being a mere stock-picker. You become an architect of systemic financial resilience.