Economic concepts
An economy is not a static ledger; it is a living, breathing ecosystem driven by human behavior, scarcity, and time. When a client sits across from a financial planner, frightened that rising grocery bills will derail their retirement or confused as to why their "safe" bond portfolio has lost principal, they are caught in the gears of macroeconomic machinery. To build resilient financial plans, one cannot simply memorize tax codes and asset classes. The practitioner must understand the underlying physics of the market—the invisible forces of supply and demand, the rhythmic breathing of the business cycle, and the heavy levers of government policy that shape the cost of capital. A financial plan failing to account for these forces is like a ship’s captain navigating without understanding the tides.
At the most fundamental level, every transaction your client makes is governed by two interacting laws of human behavior.
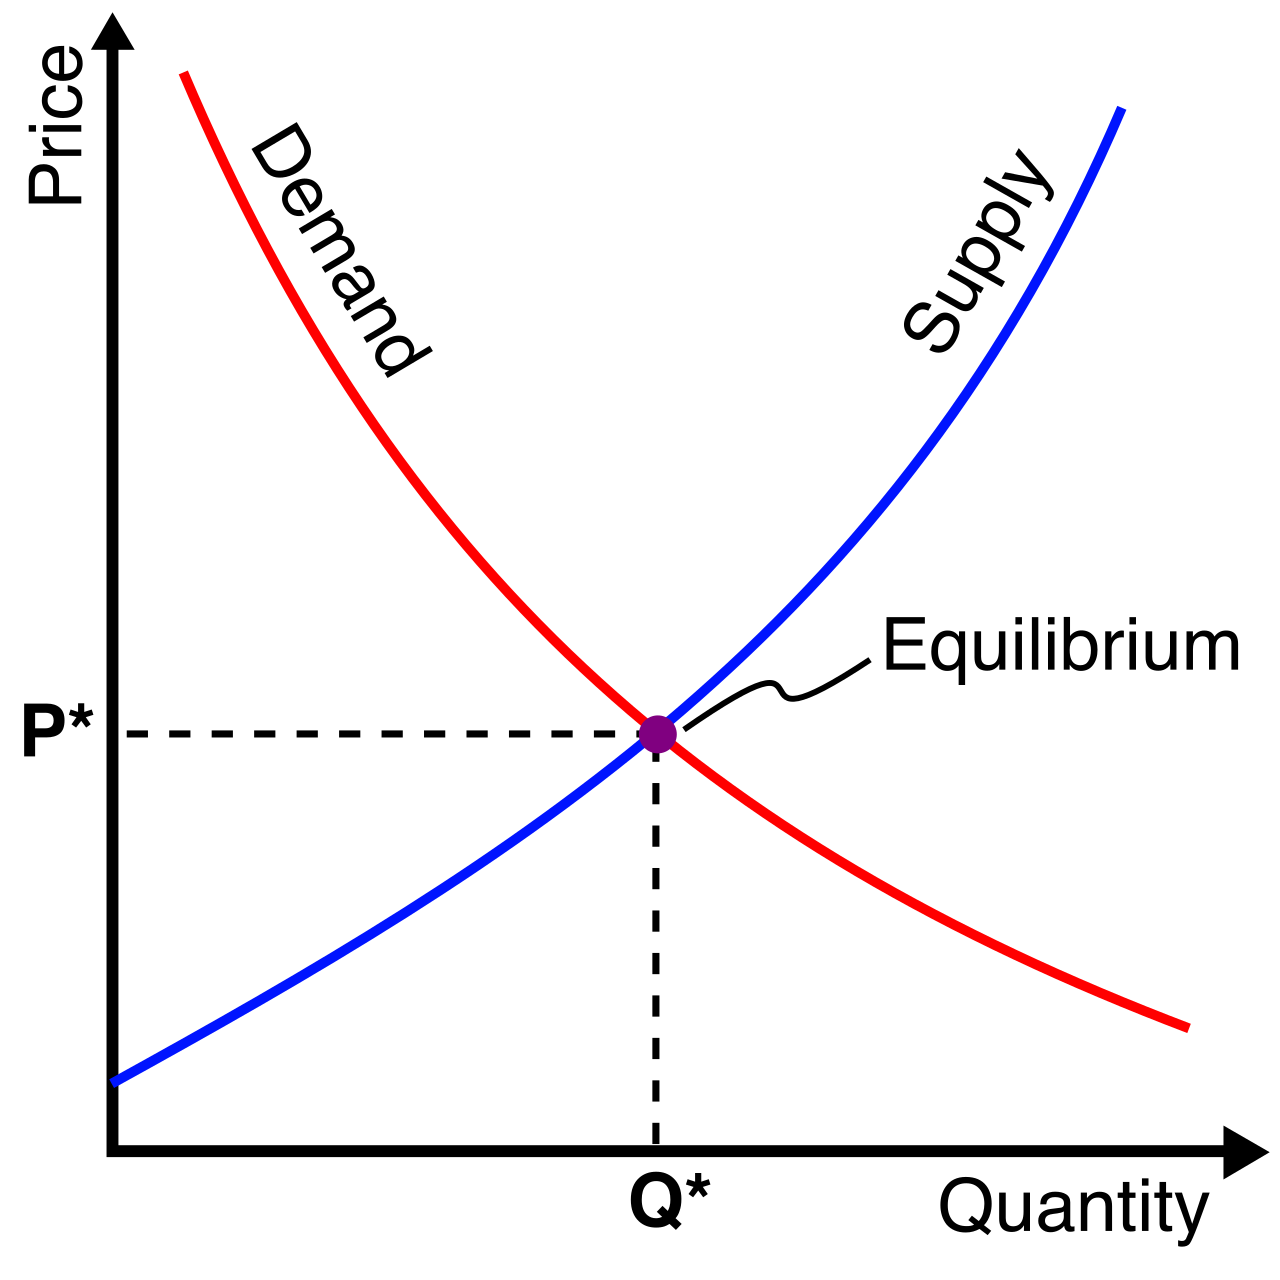
The law of demand states that consumers will buy more of a good when the price of that good decreases. If a product goes on sale, we instinctively want more of it. Conversely, the law of supply states that producers will supply more of a good when the price of that good increases. If a manufacturer realizes they can charge a premium for a new microchip, they will run their factories day and night to produce as many as possible.
These two opposing forces—buyers wanting low prices and sellers wanting high prices—constantly wrestle until they find a balance. This balance point is the equilibrium price, which is simply the price at which the quantity demanded equals the quantity supplied. The market clears.
However, not all goods react to price changes the same way. We measure this sensitivity using price elasticity of demand, which calculates how sensitive the quantity demanded of a good is to a change in its price.
- Inelastic demand applies to necessities. If the price of insulin or a client's necessary heart medication doubles, they will still buy the exact same amount.
- Elastic demand applies to luxuries. If the price of a Caribbean cruise doubles, the quantity demanded will plummet as consumers simply choose to stay home. Understanding elasticity helps you forecast how inflation in specific sectors (like healthcare versus entertainment) will disproportionately impact your client's cash flow.
When we aggregate every microeconomic transaction across an entire nation, we are looking at the macroeconomy. To know the size of this economic engine, we use Gross Domestic Product (GDP).
Gross Domestic Product measures the total market value of all final goods and services produced within a country in a specific time period.
But there is a trap in how we measure this. Imagine a country produces ten cars one year at $20,000 each, and the next year produces the same ten cars at $30,000 each. The total dollar value went up, but actual societal wealth—the number of cars—did not.
- Nominal Gross Domestic Product is measured using current market prices without adjusting for inflation for the specified time period. It reflects the raw sticker price of the economy.
- Real Gross Domestic Product, however, is adjusted for inflation to reflect changes in real economic output. This is the true measure of economic growth.
Over time, this economic output does not grow in a straight, predictable line. Instead, we observe the business cycle, which represents the fluctuation of economic activity over time. Think of it as the economy breathing in and out.
The four phases of the business cycle are expansion, peak, contraction, and trough:
- Expansion: The economy breathes in. An expansion phase is characterized by increasing economic output and decreasing unemployment. Businesses are growing, and wages are rising.
- Peak: The lungs are full. The peak is the highest point of economic expansion before a contraction begins.
- Contraction: The economy exhales. A contraction phase is characterized by declining economic output and increasing unemployment. If this exhalation is sharp enough, it becomes a recession, which is technically defined as two consecutive quarters of negative gross domestic product growth.
- Trough: The lungs are empty. The trough is the lowest point of a contraction before a new expansion phase begins, resetting the cycle.
Financial planners must anticipate these cycles to protect client portfolios. We do this by monitoring three types of economic indicators, categorized by when they shift relative to the broader economy.
| Indicator Type | Definition | Key Real-World Examples |
|---|---|---|
| Leading | Leading economic indicators change before the overall economy changes. They are the headlights on your car. | • The stock market is considered a leading economic indicator, as investors price in future expectations.<br>• Building permits for new private housing units are considered a leading economic indicator, signaling future construction jobs and material demand. |
| Coincident | Coincident economic indicators change at approximately the same time as the overall economy. They tell you exactly where you are right now. | • Industrial production is a coincident economic indicator, reflecting current real-time manufacturing output. |
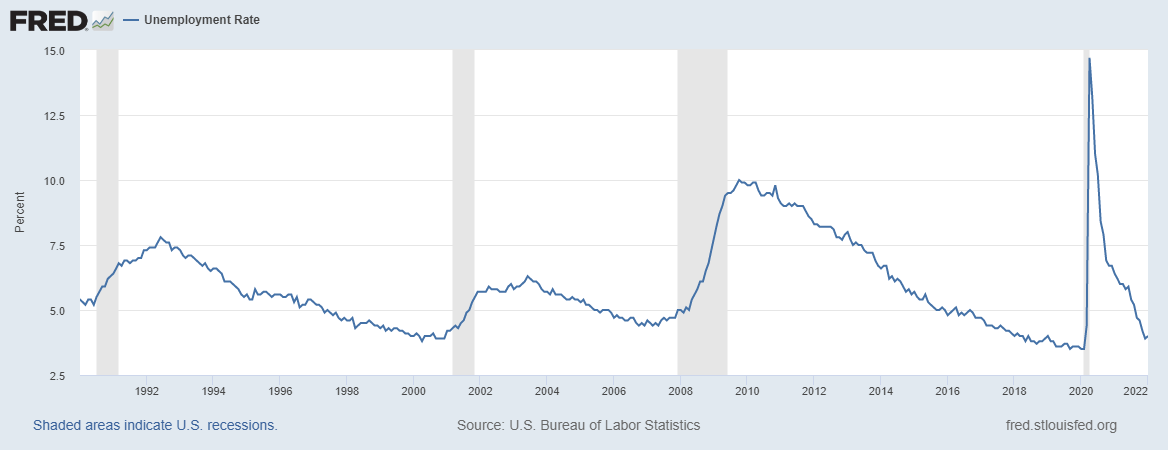
| Lagging | Lagging economic indicators change after the overall economy has changed. They confirm a trend has already occurred. | • The average duration of unemployment is a lagging economic indicator. Employers hesitate to hire even after the economy starts recovering until they are absolutely certain of the trend. |
Few economic forces destroy long-term financial plans more silently than inflation. Inflation is the general increase in the prices of goods and services over time. Because things cost more, inflation decreases the purchasing power of money. A dollar saved today will buy fewer groceries in a decade.
We track this loss of purchasing power using two primary metrics:
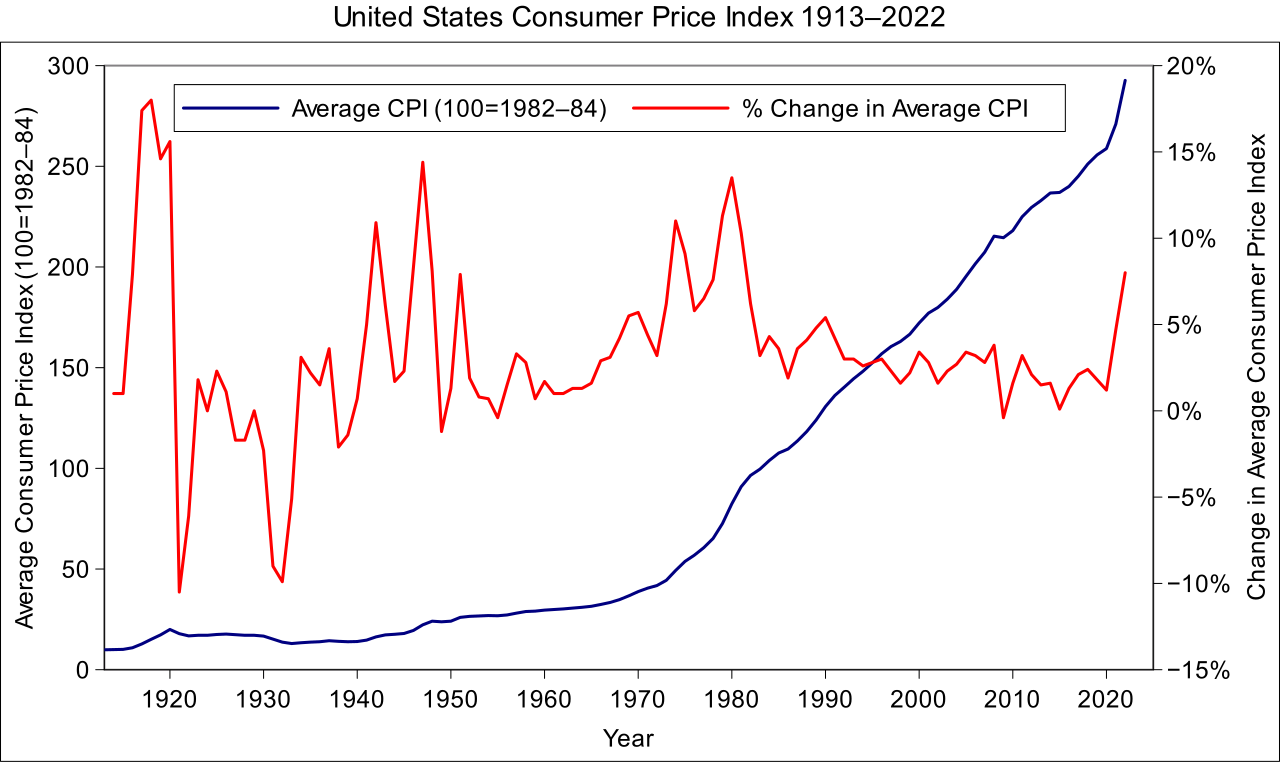
- The Consumer Price Index (CPI) measures the average change over time in the prices paid by urban consumers for a market basket of consumer goods and services (food, energy, housing, etc.). This is the inflation your client feels at the cash register.
- The Producer Price Index (PPI) measures the average change over time in the selling prices received by domestic producers for their output. Because producers often pass their costs down to consumers, a rising PPI is often a harbinger of a rising CPI.
The opposites and extremes of inflation are equally critical:
- Deflation is a general decline in the prices of goods and services. While cheaper goods sound nice, deflation is terrifying for an economy. If consumers know cars will be cheaper next month, they stop buying them today. Economic activity grinds to a halt.
- Stagflation is the worst of all worlds. It occurs when the economy experiences high inflation combined with high unemployment and stagnant economic growth. It is exceptionally difficult to cure because fixing the inflation usually worsens the unemployment, and vice versa.
Interest rates represent the cost of borrowing money. They are the gravity of the financial universe, pulling on every asset class.
For CFP professionals, the relationship between interest rates and fixed-income investments is paramount. The rule is absolute:
- Rising interest rates generally cause existing bond prices to fall. If your client holds a bond paying 3%, and new bonds are issued paying 5%, nobody will buy the client's old bond at full price. It must be discounted.
- Conversely, falling interest rates generally cause existing bond prices to rise.
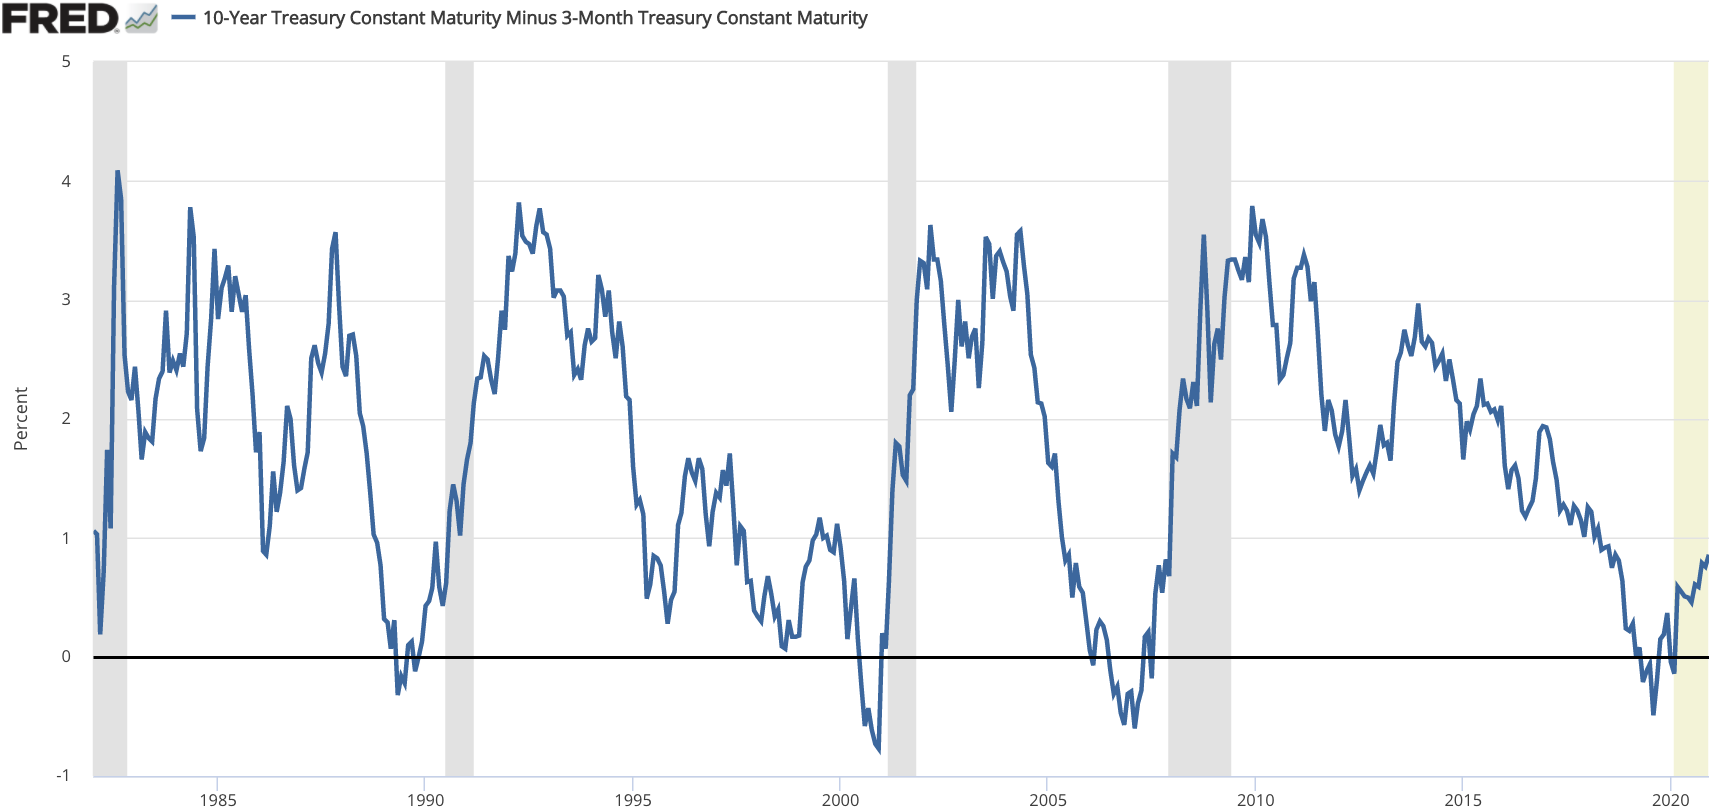
This dynamic creates one of our most reliable economic warning signals. Normally, a 10-year bond pays more interest than a 1-year bond to compensate for the risk of time. But occasionally, we see an inverted yield curve, which occurs when short-term interest rates are higher than long-term interest rates.
Why does this happen? Because investors anticipate massive short-term economic pain, they rush to lock up their money in long-term safe assets, driving long-term yields down. Consequently, an inverted yield curve is widely considered a leading indicator of an impending economic recession.
When the economic engine runs too hot (rampant inflation) or too cold (severe recession), authorities step in. They have two completely separate sets of controls: Fiscal Policy and Monetary Policy.
Fiscal Policy: The Power of the Purse
Fiscal policy relates to changes in government spending and taxation. You can always remember who is in charge of this because the executive and legislative branches of the federal government control fiscal policy. Congress writes the budget; the President signs it.
Depending on the phase of the business cycle, the government will choose one of two paths:
- Expansionary fiscal policy: Used during a contraction or trough. It involves decreasing taxes (leaving consumers with more money to spend) or increasing government spending (injecting cash directly into infrastructure and social programs) to stimulate the economy.
- Contractionary fiscal policy: Used when inflation is running too high during a peak. It involves increasing taxes (draining disposable income) or decreasing government spending to slow economic growth and cool demand.
Monetary Policy: The Plumbing of the Banking System
While Congress argues over budgets, the central bank operates the money supply. Monetary policy involves actions by the Federal Reserve to manage the money supply. By law, the Federal Reserve uses monetary policy to achieve maximum employment and stable prices—often referred to as their "dual mandate."
The Fed does not dictate how citizens spend money; they alter how much money exists and how expensive it is for banks to access it. They do this via three primary tools:
1. Open Market Operations (The Most Common Tool) Open market operations involve the buying and selling of government securities by the Federal Reserve. Imagine the Fed has an infinite vault of cash and a vault of bonds.
- Expansionary: The Federal Reserve increases the money supply by buying government securities from commercial banks. They take the banks' bonds and hand the banks newly created cash, which the banks then lend out to consumers.
- Contractionary: The Federal Reserve decreases the money supply by selling government securities. They throw bonds onto the open market, soaking up cash from the banking system like a sponge, leaving less money available for lending.
2. The Discount Rate The discount rate is the interest rate charged to commercial banks on loans received from their regional Federal Reserve Bank. Think of it as the wholesale cost of money.
- Lowering the discount rate stimulates economic activity by making borrowing cheaper for commercial banks, who then pass those lower rates on to your clients seeking mortgages or business loans.
- Raising the discount rate slows economic growth by making borrowing more expensive for commercial banks, subsequently raising credit card rates and mortgage rates across the economy.
3. The Reserve Requirement By law, banks cannot lend out every dollar you deposit. The reserve requirement is the percentage of specified deposit liabilities that a bank must hold in reserve (literally kept in the vault or at the Fed).
- Lowering the reserve requirement means banks can hold less back, which increases the amount of money banks can lend, instantly multiplying liquidity in the economy.
- Raising the reserve requirement forces banks to lock up more capital, which decreases the amount of money banks can lend, hitting the brakes on economic expansion.
As a financial planner, your role is not to simply react to these concepts in isolation, but to understand their interconnected rhythm. When inflation rises (CPI/PPI), you know the Fed will likely raise the discount rate and sell securities (Monetary Policy). You know this will increase the cost of capital, potentially inverting the yield curve (a Leading Indicator) and causing existing bond portfolios to lose principal value. Knowing this chain reaction is how you build a plan robust enough to survive the trough and thrive in the expansion.