Financial statements
When a physicist seeks to understand a complex dynamic system, they must first distinguish between its state at a frozen instant in time and its trajectory over a duration of time. In financial planning, this exact distinction forms the bedrock of client diagnosis. We cannot prescribe a strategy to build wealth without first capturing the precise thermodynamic state of a client’s finances—what they own, what they owe, and the velocity at which capital enters and exits their life.
To pass the CFP® certification exam and, more importantly, to give competent advice to a family sitting across your desk, you must master the structural anatomy of personal financial statements. These documents are not mere administrative paperwork; they are the empirical evidence of a client's financial behavior.
If you freeze time at midnight on December 31st, what remains? A personal balance sheet represents a client's financial position at a specific point in time. It is a static photograph of accumulated wealth, governed by one immutable equation:
The Fundamental Accounting Equation Total assets equal total liabilities plus net worth on a personal balance sheet.
Assets=Liabilities+NetWorth
When constructing this statement, precision in valuation is paramount. Unlike corporate accounting, which often relies on historical cost, assets are listed on a personal balance sheet at their current fair market value. We are interested in what the client’s resources could be converted into today.
Classifying Assets
To evaluate liquidity and growth potential, we strictly partition total assets into three distinct categories:
- Cash and Cash Equivalents: These are highly liquid assets intended for short-term use and emergency funding. Think of checking accounts, savings accounts, and money market funds. This is the immediate reservoir your client relies on when the roof leaks or the engine block cracks.
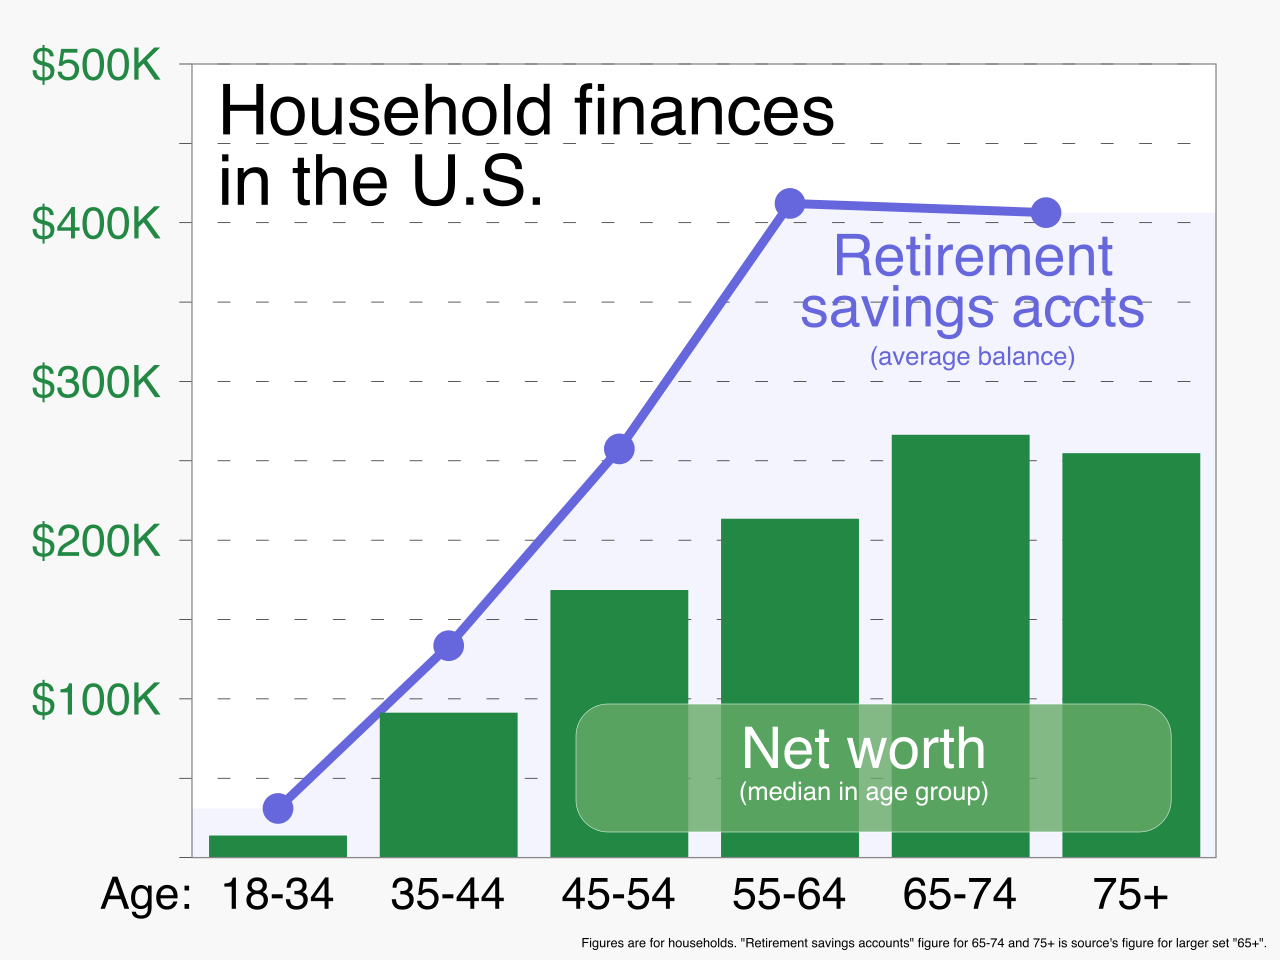
- Investment Assets: These are assets held primarily for capital appreciation or income generation. This includes brokerage accounts, business interests, and mutual funds. Crucially, vested balances in retirement accounts are categorized as investment assets on the balance sheet. (Note the word vested—unvested employer matches do not belong to the client yet, and thus do not appear on their balance sheet).
- Personal Use Assets: These are assets maintained to sustain the client's lifestyle. Primary residences, vehicles, furniture, and jewelry belong here. They hold value, but they are generally illiquid and are not meant to be sold to generate recurring income.

Classifying Liabilities
Liabilities represent claims against the client's assets. We divide these obligations by their time horizons:
- Current Liabilities: These are financial obligations that must be paid off within twelve months. This includes credit card balances, utility bills, and short-term notes. Crucially, property taxes due within the next twelve months are classified as current liabilities.
- Long-Term Liabilities: These are debt obligations with repayment schedules extending beyond twelve months, such as the remaining balance on a 30-year mortgage or a 5-year auto loan.
There is a vital measurement rule here that frequently traps practitioners and exam candidates alike: Only the unpaid principal balances of loans are recorded as liabilities on the balance sheet. Why? Because the balance sheet is a snapshot of today. Future interest payments on loans are excluded from the balance sheet because that interest has not yet accrued; it is a cost of holding the debt over time, not a present-day obligation.
Net Worth: The Bottom Line
When you strip away all external claims on the client’s assets, you are left with their true wealth. Net worth represents the residual value remaining after all liabilities are subtracted from all assets.
If the balance sheet is a photograph, the personal statement of cash flows is a motion picture. It summarizes income and expenses over a defined period of time—typically a month or a year.
It is vital to distinguish this from forecasting. A budget is a proactive financial tool used to plan future cash flows, essentially an architectural blueprint for how a client intends to deploy their money. In contrast, a statement of cash flows is a historical record of actual cash inflows and outflows. It is the empirical truth of what actually happened.
Categorizing Outflows
Expenses are conceptually divided by how much friction is involved in changing them:
- Fixed Expenses: These are predictable outflows that remain constant over short periods. Rent, mortgage payments, auto loan payments, and insurance premiums are fixed. The client cannot easily alter these month-to-month without making drastic lifestyle changes.
- Variable Expenses: These are fluctuating outflows over which the client has direct control. Dining out, entertainment, and vacations fall into this category. When a client needs to optimize their cash flow, variable expenses are the first levers you will pull.
When recording outflows, you must track the physical movement of dollars. For example, income taxes withheld from a paycheck are recorded as an outflow on the statement of cash flows. Even though the client never physically "held" that money, it was legally theirs and was diverted to pay a tax obligation.
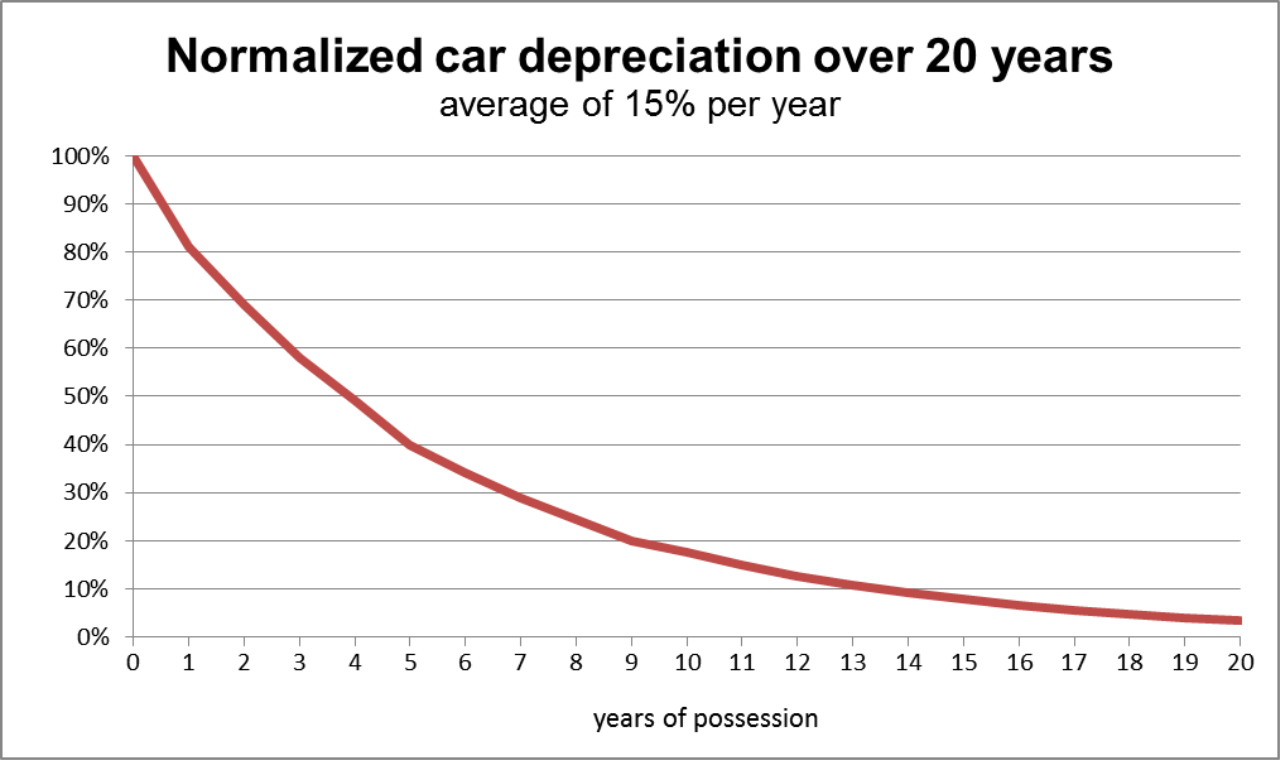
Conversely, depreciation of personal use assets is not recorded on a personal cash flow statement. Depreciation is a theoretical accounting concept representing the declining value of an asset over time; it does not involve an actual physical dollar leaving the client's bank account.
The Cash Flow Result
At the end of the period, you tally the movement. Net cash flow is calculated by subtracting total outflows from total inflows.
Bridging the Two Statements The cash flow statement and the balance sheet are mathematically linked. A positive net cash flow at the end of a period increases the client's overall net worth. If a client has $2,000 left over at the end of the month, that cash must go somewhere—it either increases an asset (moves to a savings account) or decreases a liability (pays down a credit card). Both actions mathematically increase net worth.
To excel in financial planning, you must be able to visualize how daily financial decisions instantly alter the balance sheet. Consider the following structural truths about how transactions behave:
- Asset Swaps: Purchasing an asset with cash results in an asset swap that leaves overall net worth unchanged. If a client uses $30,000 in cash to buy a $30,000 boat, "Cash and Cash Equivalents" drops by $30,000, and "Personal Use Assets" increases by $30,000. Assets remain identical. Liabilities remain identical. Net worth is unchanged.
- Debt Retirement: Paying down a liability with cash decreases both assets and liabilities by the exact same amount. If a client uses $10,000 in cash to pay off a student loan, total assets drop by $10,000, and total liabilities drop by $10,000. Because both sides of the equation drop equally, paying down a liability with cash does not immediately change the client's net worth.
- Financed Purchases: Taking out a loan to purchase a personal use asset increases both total assets and total liabilities. If a client takes out a $50,000 loan to buy a $50,000 car, they add a $50,000 personal use asset and a $50,000 long-term liability. Therefore, taking out a loan to purchase an asset does not increase a client's net worth at the time of purchase.
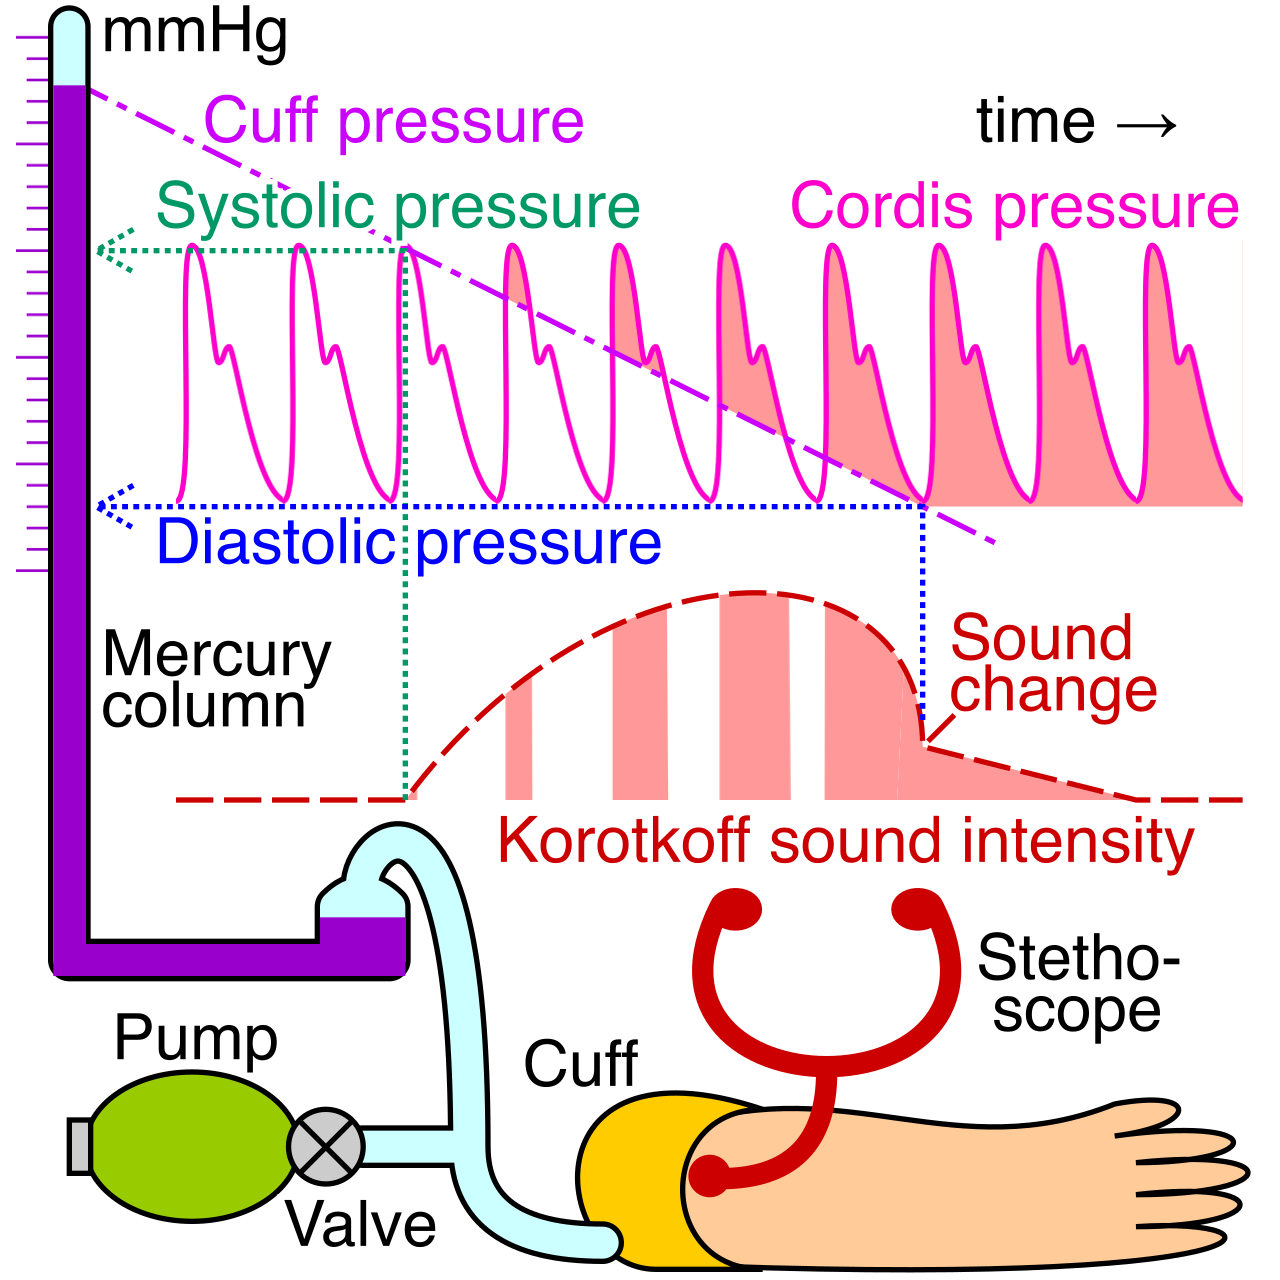
In medicine, a doctor uses blood pressure and resting heart rate to evaluate health against a standardized baseline. In financial planning, we use ratios. Ratios allow us to strip away the sheer magnitude of a client’s wealth and examine the proportional health of their cash flows and balance sheet.
Liquidity Ratios
Can the client survive an unexpected shock?
1. The Emergency Fund Ratio This metric evaluates how long a client could survive an absolute loss of income.
- Formula: The emergency fund ratio divides cash and cash equivalents by monthly non-discretionary expenses. (Note: Do not divide by total expenses; if a client loses their job, they will stop eating at expensive restaurants).
- CFP Benchmark: Financial planners generally recommend an emergency fund covering three to six months of non-discretionary expenses. A dual-income household with highly secure jobs might lean toward three months; a single-income freelance worker should target six months or more.
2. The Current Ratio This evaluates immediate, short-term solvency.
- Formula: The current ratio divides cash and cash equivalents by current liabilities.
- Diagnosis: A current ratio greater than 1.0 indicates the ability to pay off short-term debt using currently available liquid assets. If the ratio is 0.5, the client only has 50 cents in liquid cash for every dollar of obligation due within the next year.
Debt Management Ratios
Is the client carrying a toxic debt load? The CFP Board rigorously tests these benchmarks, particularly in the context of mortgage underwriting.
1. Housing Ratio 1 (The Front-End Ratio) This measures the burden of basic housing costs relative to total earnings.
- Formula: The housing ratio 1 divides monthly principal, interest, property taxes, and homeowners insurance by monthly gross income. (This numerator is frequently abbreviated as PITI).
- CFP Benchmark: The CFP Board benchmark for a healthy housing ratio 1 is twenty-eight percent or less of gross income. (≤28%)
2. Housing Ratio 2 (The Back-End Ratio) This measures the total systemic drag of all debt obligations.
- Formula: The housing ratio 2 divides all monthly recurring debt payments by monthly gross income. This includes PITI, plus auto loans, student loans, minimum credit card payments, and alimony.
- CFP Benchmark: The CFP Board benchmark for a healthy housing ratio 2 is thirty-six percent or less of gross income. (≤36%)
3. Consumer Debt Ratio This isolates high-friction, non-housing debt, which is often symptomatic of cash flow mismanagement.
- Formula: The consumer debt ratio divides monthly consumer debt payments by monthly net income. Notice the critical denominator shift here: we use net income, not gross income, because consumer debt is serviced with after-tax, take-home pay.
- CFP Benchmark: The CFP Board benchmark for a healthy consumer debt ratio is twenty percent or less of net income. (≤20%)
Wealth Accumulation Ratio
Are the client's behaviors actually generating future financial independence?
1. The Savings Ratio This reveals the velocity at which the client is funding their future.
- Formula: The savings ratio divides total annual savings by total annual gross income.
- Critical Exam Rule: Do not forget the employer match. Employer contributions to retirement plans are included in the numerator of the savings ratio (and technically, the denominator as well, though the impact on gross income is often treated as implicit in standard calculations). If a client saves $5,000 and the employer matches $5,000, the total annual savings is $10,000.
- CFP Benchmark: A common financial planning benchmark for a healthy savings ratio is between ten and twelve percent of gross income (though many practitioners advocate for 15-20% depending on the age the client begins saving).
Mastering these statements and ratios allows you to look at a chaotic pile of bank statements, tax returns, and loan documents, and distill them into a pristine, diagnostic reality. You must be able to read a balance sheet the way a conductor reads a musical score—hearing instantly which sections are out of tune, and knowing precisely which adjustments will restore harmony to the client's financial life.