Portfolio development and analysis
Engineering a physical bridge over a seismic fault requires a precise mathematical calculation of both the load it must carry and the tremors it must withstand. Constructing a client’s wealth operates on identical mechanics. An investment portfolio without a rigorous, behavioral, and mathematical blueprint is merely a collection of uncoordinated assets vulnerable to the next market tremor. In the architecture of financial planning, this definitive blueprint is the Investment Policy Statement (IPS).

Once the mathematical foundations of the IPS are laid, the financial planner translates these rules into specific asset allocations and establishes mechanical systems to correct the inevitable decay—or drift—caused by volatile markets.
At its core, an Investment Policy Statement provides a customized, written framework for all investment decisions made on behalf of a client. It eliminates guesswork. By creating a definitive governing document, the Investment Policy Statement outlines the specific duties and responsibilities of both the financial advisor and the client, ensuring that every portfolio action is rooted in logic rather than emotion.
To function properly, an IPS must define the boundaries of the investment strategy. The fundamental components of an Investment Policy Statement are the client's risk tolerance, return objectives, and investment constraints.
Calibrating the Risk Profile
Risk is not a single, vague feeling; it is a two-dimensional matrix. A client's overall risk profile comprises the objective financial ability to take risk and the subjective psychological willingness to take risk.
- Ability to take risk (Objective): Dictated by the client's time horizon, wealth relative to liabilities, and ongoing cash flows.
- Willingness to take risk (Subjective): Dictated by the client's behavioral psychology, prior market experiences, and emotional temperament.
Often, these two dimensions collide. A young, highly compensated executive might panic at the first sign of a market correction, demonstrating a high ability but a low willingness to take risk. Conversely, an elderly retiree might request aggressive tech stocks because they feel they are "falling behind," demonstrating a high willingness but a critically low ability.
A conflict between a client's willingness to take risk and ability to take risk requires the financial planner to educate the client about the discrepancy. The planner must act as a behavioral guide. However, if the client’s desires remain misaligned with their reality, a strict rule applies to protect the client's financial solvency: When a client's willingness to take risk exceeds the client's objective financial ability to take risk, the financial planner must base the portfolio design on the lower ability to take risk.
Defining Return Objectives and Benchmarks
Without a defined destination, it is impossible to measure progress. Therefore, return objectives in an Investment Policy Statement can be stated as absolute percentage targets (e.g., an annualized return) or relative targets compared to a specific market benchmark (e.g., outperforming the S&P 500 by 1% annually).
To ensure accountability, an Investment Policy Statement establishes the precise benchmark index used to evaluate the ongoing performance of the client's portfolio. Comparing a conservative, bond-heavy portfolio to a global equity index is intellectually dishonest; the benchmark must accurately reflect the portfolio's mandated asset allocation.
The Investment Constraints (The TTLLU Framework)
Constraints are the physical boundaries within which the portfolio must operate. Investment constraints within an Investment Policy Statement are categorized as time horizon, taxes, liquidity needs, legal requirements, and unique circumstances.
| Constraint Category | Practical Application within the Portfolio |
|---|---|
| Time Horizon | The time horizon constraint dictates the length of time between the initial investment date and the point at which the client must begin withdrawing the principal. A longer horizon permits higher equity exposure, allowing time to absorb short-term volatility. |
| Taxes | Tax constraints require the portfolio manager to consider the client's marginal income tax bracket and capital gains rates when selecting investment vehicles. For example, utilizing municipal bonds for a client in the 37% bracket. |
| Liquidity | The liquidity constraint defines the client's anticipated requirements for cash distributions from the portfolio within the near future. This ensures cash is available for planned purchases (e.g., a $100,000 home down payment) without forcing the sale of volatile assets at a loss. |
| Legal / Regulatory | Legal and regulatory constraints involve absolute investment restrictions imposed by trust documents, corporate insider policies, or federal securities laws. (e.g., a corporate executive restricted from trading company stock during blackout periods). |
| Unique Circumstances | Unique circumstances in an Investment Policy Statement include specific client preferences such as environmental, social, and governance (ESG) investing restrictions, or a prohibition on investing in specific industries due to personal values. |
Once the IPS establishes the constraints and objectives, the planner builds the portfolio's actual structure. Asset allocation is the engine of portfolio performance.
Strategic Asset Allocation (The Core)
Strategic asset allocation establishes the long-term target percentage weights for various asset classes in an investment portfolio. If the IPS determines a client needs a balanced risk profile, the strategic allocation might be precisely 60% global equities and 40% fixed income.
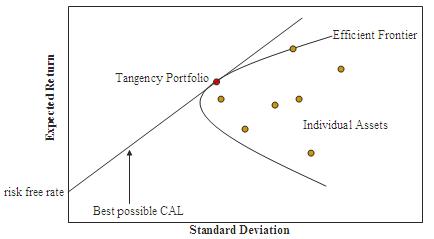
The rationale behind this is not arbitrary. Strategic asset allocation relies on modern portfolio theory to maximize expected portfolio return for a given level of accepted risk. By finding the "efficient frontier," the planner identifies the optimal mix of non-correlated assets.
Why spend so much time on strategic allocation rather than picking individual winning stocks? Because the mathematics of the market dictate it. Academic studies demonstrate that strategic asset allocation explains over ninety percent of the variability in a diversified portfolio's returns over time. Stock picking and market timing pale in comparison to the macro-level asset class weights.
Tactical Asset Allocation (The Satellite)
While strategic allocation is a long-term, passive framework, markets occasionally present immediate, asymmetric opportunities or elevated risks. Tactical asset allocation involves making short-term, intentional deviations from the strategic asset allocation target weights.
For instance, if the strategic weight for emerging markets is 10%, a planner might tactically reduce it to 5% during a localized currency crisis. Tactical asset allocation seeks to generate excess returns by exploiting temporary market inefficiencies or shifting macroeconomic trends.
The Core-Satellite Integration: Most elite practitioners do not view strategic and tactical allocations as mutually exclusive. The core-satellite investment approach combines a passive strategic asset allocation for the majority of the portfolio with active tactical asset allocation for the remaining portion. The "core" tracks broad indices efficiently, while the "satellite" allows the manager to seek alpha or mitigate acute risks in specific sectors.
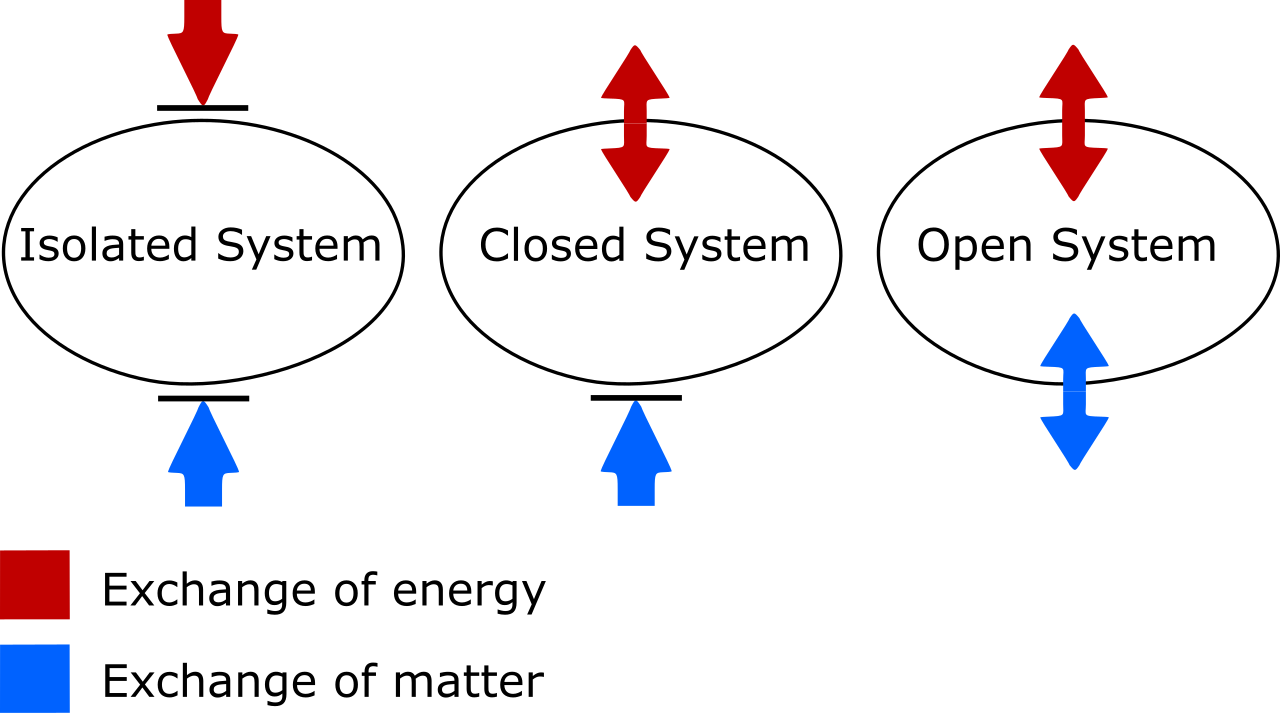
In physics, closed systems naturally move toward disorder, a concept known as entropy. In finance, this entropy is called drift. As soon as a portfolio is constructed, the continuous movement of the markets begins to pull it apart.
The Mechanics of Portfolio Drift
Portfolio drift occurs when differing rates of return among asset classes cause the actual portfolio weights to deviate from the original target asset allocation weights.
Imagine a portfolio initially set to 50% stocks and 50% bonds. During a massive multi-year bull market, the stocks double in value while the bonds remain flat. The portfolio is now mathematically skewed to roughly 66% stocks and 34% bonds. The client is now exposed to significantly more equity risk than their IPS permits.
The Rebalancing Imperative
To correct this structural decay, the planner must intervene. Portfolio rebalancing is the process of realigning the actual proportions of a portfolio's assets back to the strategic asset allocation target weights.
Rebalancing is deeply contrarian to human emotion. Behaviorally, investors want to buy more of what is going up and abandon what is going down. However, rebalancing a portfolio systematically forces investors to sell assets that have recently appreciated and buy assets that have recently declined in value. It creates an automated, emotionless mechanism for buying low and selling high.
To remove subjective decision-making, an Investment Policy Statement mandates the specific methodology and frequency for monitoring and rebalancing the client's portfolio. There are two primary methodologies used to trigger this process:
- Calendar-Based Rebalancing This method relies strictly on the clock. Calendar-based rebalancing adjusts the portfolio to target weights at predetermined time intervals regardless of interim market movements. Whether it is done quarterly, semi-annually, or annually, the planner resets the portfolio on specific dates. It is administratively simple but blind to massive intra-period market swings.
- Percentage-of-Portfolio Rebalancing (Tolerance Bands) This method relies strictly on market movement. Percentage-of-portfolio rebalancing relies on established tolerance bands to trigger adjustments when an asset class weight deviates beyond a specific threshold. For example, an asset class with a 20% target and a +/- 5% tolerance band will only be rebalanced if it drifts above 25% or below 15%.
The Tolerance Band Trade-off: Setting the width of these tolerance bands requires balancing transaction costs against risk control.
- Wider rebalancing tolerance bands reduce overall transaction costs by triggering fewer portfolio adjustments over time. A band of +/- 10% allows the assets to run, minimizing trading fees, but permits higher risk deviation.
- Conversely, tighter rebalancing tolerance bands force more frequent trading to keep the portfolio highly aligned with the original risk profile. A band of +/- 2% will track the IPS perfectly but will incur constant trading drag.
The Tax Friction of Rebalancing
Just as mechanical friction generates heat, financial rebalancing generates taxes. Rebalancing a portfolio in a taxable brokerage account often generates immediate capital gains or capital losses.

When a planner sells off the winners to buy the losers, they are realizing capital gains. If the assets were held for less than a year, they are subject to punitive short-term capital gains rates.
A sophisticated financial planner must actively mitigate this tax friction. Financial planners can minimize the tax impact of portfolio rebalancing by directing new cash deposits exclusively into underweighted asset classes. Instead of selling the overweighted stocks (triggering a taxable event), the planner simply uses the client's new savings, or the portfolio's generated dividend yield, to purchase more of the underweighted bonds until the target mathematical equilibrium is restored.