Windows OS Features and Tools
Not sure you’re ready?
Take the ~3-minute readiness diagnostic and see where you stand.
A modern computer operating system is not merely a piece of software; it is a sprawling, high-speed metropolitan city. Millions of processes act as the commuters, memory serves as the commercial real estate, the CPU is the power grid, and the storage drive is the vast library holding the city’s entire history. When the city flows perfectly, the user never notices the infrastructure. But when traffic jams occur, when a rogue application hoards resources, or when the system architecture begins to fracture, someone has to open the hood of the city and direct the flow. As an IT support professional, you are the chief engineer of this metropolis.
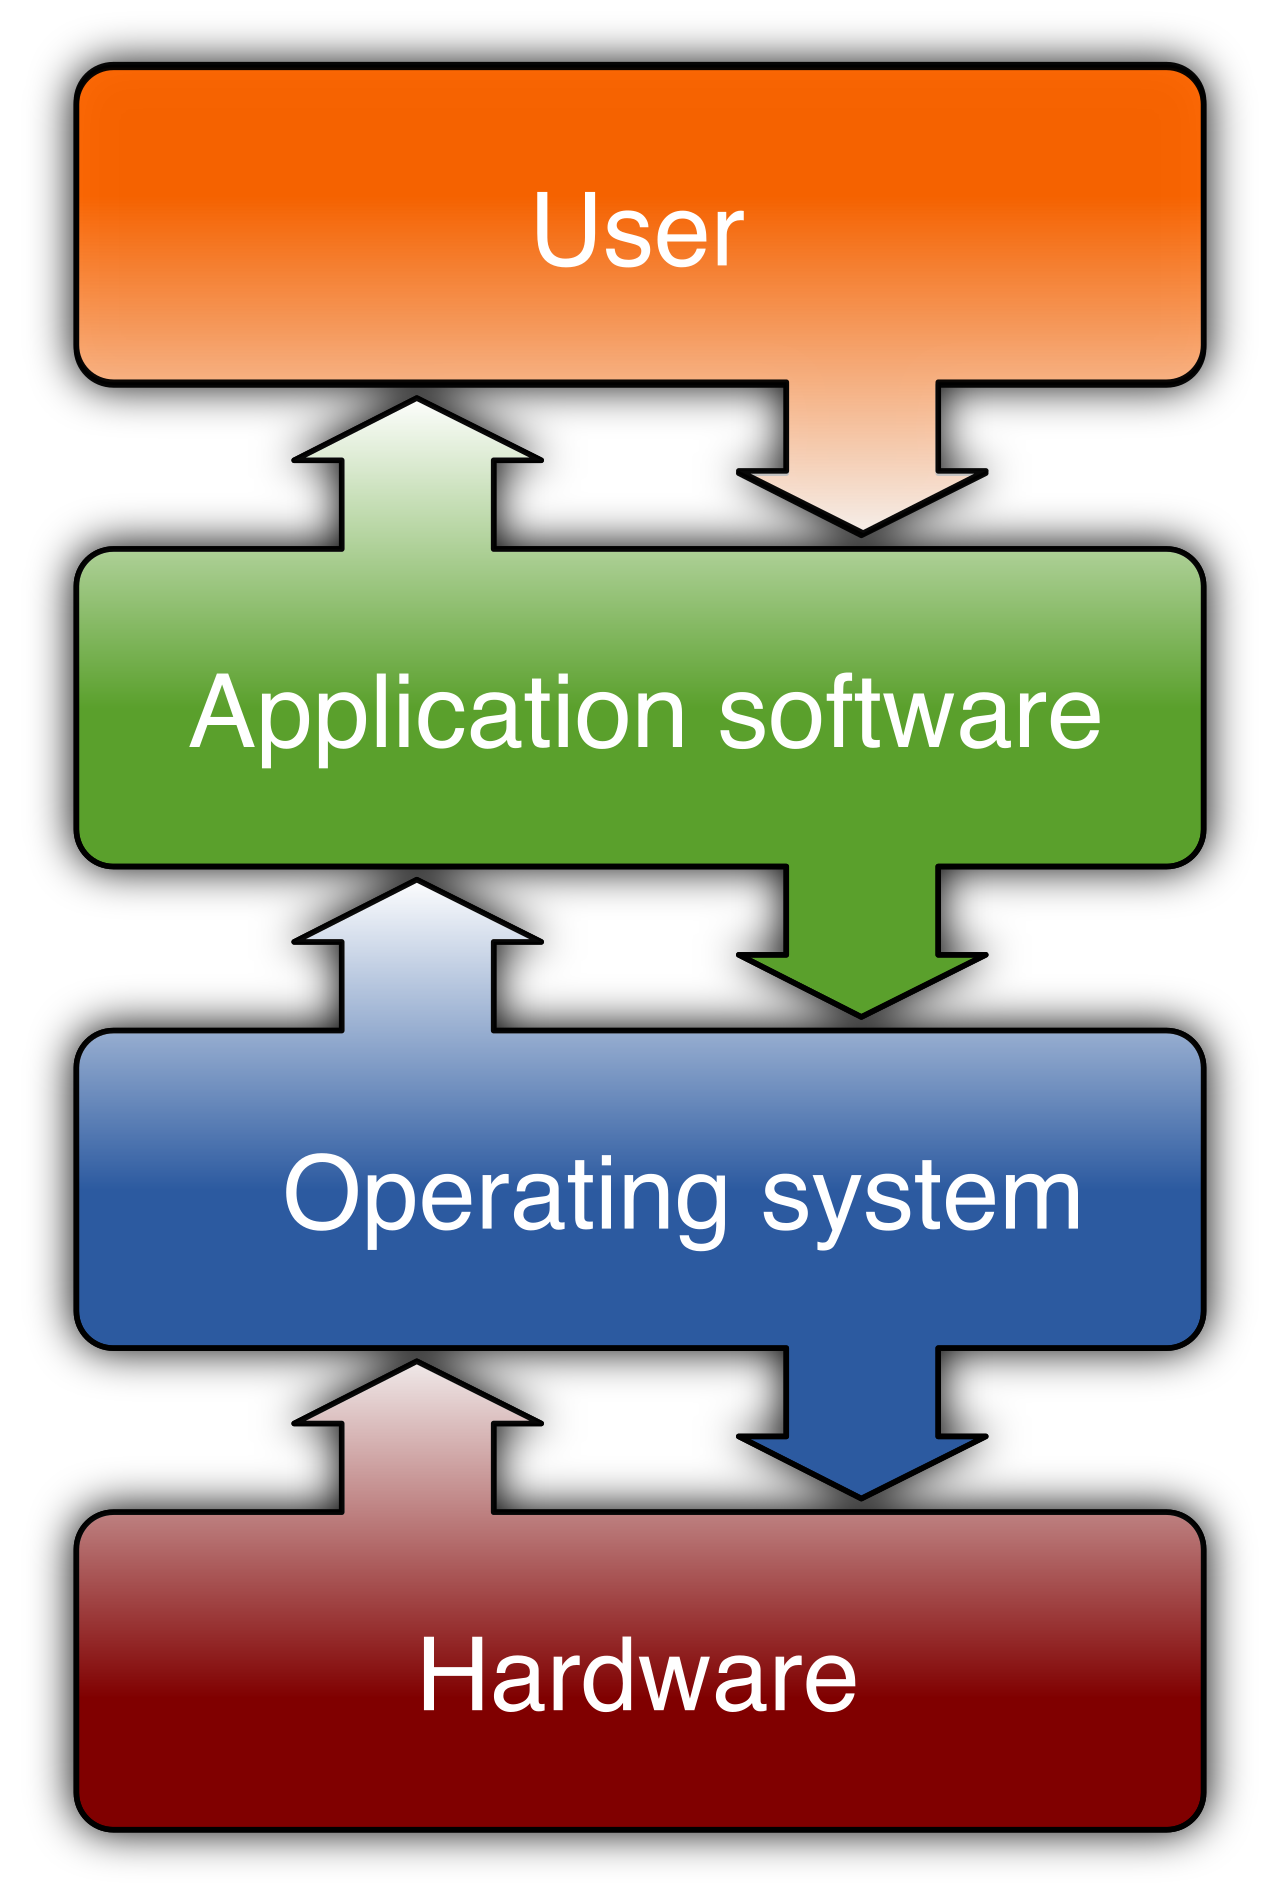
Understanding Windows administrative features is how you transition from guessing what is wrong to knowing precisely what is failing and why.
When an endpoint becomes unresponsive, the Windows Task Manager is your immediate diagnostic tool. It provides a macroscopic view of the entire system's health. You can summon it rapidly using the keyboard shortcut Ctrl+Shift+Esc, or by right-clicking the Windows taskbar and selecting Task Manager if the mouse interface is still responsive.
Inside, Task Manager is divided into highly specialized tabs, each answering a different diagnostic question.
Tracking the Commuters: Processes and Performance
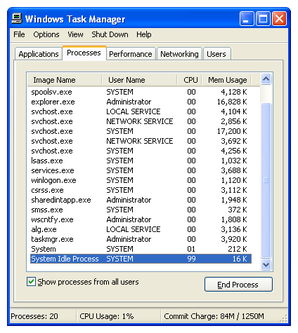
The Processes tab is your live traffic map. It displays running applications alongside background system processes, correlating them directly with their current hardware resource usage. If an application locks up, ending a process here forcefully terminates the selected application or background task, immediately reclaiming its memory and CPU cycles.
If you need to understand the physical constraints of the machine, move to the Performance tab. This provides real-time utilization graphs for CPU, Memory, Disk, and Network hardware. You are not just looking at numbers here; you are looking for bottlenecks. A CPU pinned at 100% while everything else is idle tells a very different story than a disk operating at 100% while the CPU waits for data.
Managing System Startup and Historical Loads
Over time, software accumulates. The Startup tab allows administrators to enable or disable applications from launching during the Windows boot process. Trimming this list is the single fastest way to improve a user's boot times. To understand the long-term impact of modern software, the App History tab displays historical resource usage statistics specifically for Universal Windows Platform (UWP) applications, letting you see what has been draining a laptop's battery over the past month.
Multi-User Environments and Granular Control
In enterprise environments, multiple users often share terminal servers or workstations. The Users tab allows administrators to view hardware resource consumption per logged-in user account. If a disconnected user's background task is lagging the machine, administrators can use the Users tab to forcefully disconnect other active user sessions.
For the deepest level of process control, the Details tab strips away the friendly icons and displays the precise Process ID (PID) for every running executable file on the system. From here, administrators have immense power over the CPU's scheduling algorithm:
- You can set process priority levels, telling the CPU to handle a specific application before anything else.
- You can set processor affinity to restrict a process to specific CPU cores. If a legacy application crashes when trying to use multiple cores, restricting its affinity to a single core often resolves the issue.
Finally, the Services tab in Task Manager allows administrators to start, stop, or restart individual Windows services without having to open the full Services console.
Task Manager is excellent for discovering that a process is consuming resources, but sometimes you need to know exactly what that process is doing. If Task Manager is a heart rate monitor, Resource Monitor is an MRI.
The resmon command launches the Resource Monitor utility, which provides highly granular, real-time data concerning CPU, Memory, Disk, and Network usage.
Its true power lies in its isolation capabilities. Resource Monitor allows administrators to filter resource usage data by selecting a specific running process. Selecting a process in Resource Monitor reveals the specific files and network connections utilized by that single process. If an antivirus scan is dragging the disk to a halt, Resource Monitor will show you exactly which file the scanner is choking on.
Diagnostic Key: Resource Monitor is invaluable for diagnosing RAM limitations. It prominently displays hard faults per second. A hard fault occurs when the processor looks for data in high-speed RAM, but the data has been swapped out to the vastly slower storage drive. A consistently high rate of hard faults is the definitive metric proving a system requires a physical memory upgrade.
Rather than scattering dozens of disparate administrative tools across the operating system, Windows utilizes the Microsoft Management Console (MMC). The MMC provides a unified graphical framework to host administrative tools called snap-ins. These snap-in files use the .msc file extension.
Executing the mmc command from the Run dialog opens a completely blank Microsoft Management Console, allowing you to custom-build a dashboard by adding only the tools you use daily. However, Windows comes pre-packaged with several critical MMC consoles.
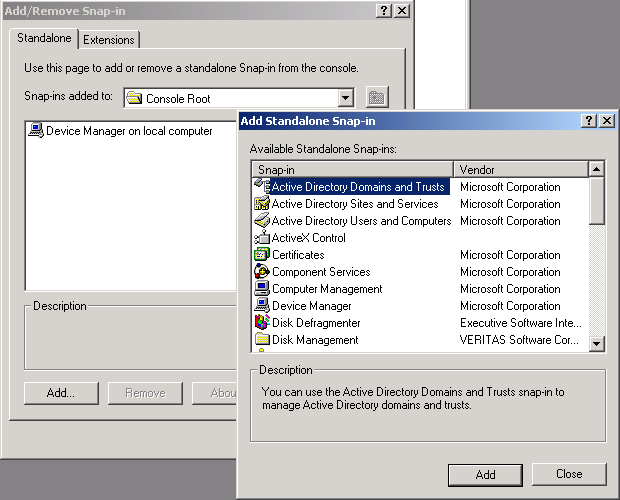
The most comprehensive is the Computer Management console, accessible via the compmgmt.msc command. Think of Computer Management as the technician's multi-tool; it contains an aggregate of administrative tools including Task Scheduler, Event Viewer, and Disk Management all in one window.
The Flight Data Recorder: Event Viewer
When a user tells you, "The computer just crashed," they rarely know why. The Event Viewer console (accessible via eventvwr.msc) is where you find out. It records system and application activities in centralized log files.
Event Viewer categorizes events into severity levels including Information, Warning, Error, and Critical. You will spend most of your time hunting for Errors and Critical events across three primary logs:
- Windows System log: Records events generated by Windows operating system components (e.g., driver failures, hardware timeouts).
- Windows Application log: Records events generated by installed software programs (e.g., a database application crashing).
- Windows Security log: Records audit events such as valid and invalid logon attempts. If you suspect an unauthorized person is trying to guess a user's password, this log will show the trail of failed attempts.
The Foundation: Disk Management
Physical storage must be prepared before Windows can use it. The Disk Management console (accessible via diskmgmt.msc) is the architect's tool for storage.
Upon opening, Disk Management displays the operational status of storage drives using labels such as Online, Offline, or Unallocated. From this console, administrators execute several critical operations:
- Initialize brand-new storage drives for use so the OS can communicate with the hardware.
- Create new partitions on unallocated disk space.
- Format drive partitions with specific file systems (like NTFS or exFAT) so files can be written to them.
- Assign or change drive letters (like changing
D:toE:) for storage volumes.
Disk Management also allows for dynamic resizing without losing data. Administrators use it to extend the size of existing disk volumes into adjacent unallocated space, or shrink the size of existing disk volumes to create unallocated space for a new partition.
Automating and Securing the Environment
Other essential MMC snap-ins provide specialized control over the environment's behavior and security:
| MMC Snap-in | Run Command | Professional Application |
|---|---|---|
| Services | services.msc | Configures whether specific background services start automatically, start manually, or remain disabled. Crucial for turning off unnecessary bloatware running silently in the background. |
| Local Users and Groups | lusrmgr.msc | Used to manage local user accounts and local security group memberships. This is where you create local administrator accounts or lock out departed employees. |
| Local Security Policy | secpol.msc | Defines password requirements (length, complexity) and account lockout policies for the local machine. |
| Device Manager | devmgmt.msc | The central hub for installing, updating, or rolling back hardware drivers. |
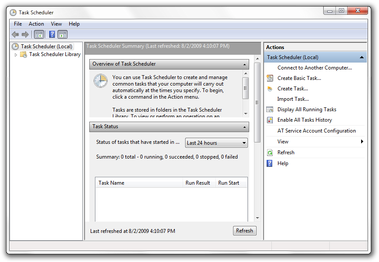
To make the environment self-sustaining, administrators utilize Task Scheduler (accessible via taskschd.msc). Task Scheduler allows administrators to create automated tasks that execute programs at specified dates and times. More powerfully, it bridges the gap with Event Viewer: Task Scheduler allows administrators to trigger scripts automatically in response to specific Event Viewer log entries. If a specific "service crashed" event appears in the logs, Task Scheduler can instantly fire a script to restart it.
When a system is trapped in a loop of crashes, you must strip away the complexity to find the root cause. The System Configuration utility, accessible via the msconfig command, is your pre-flight checklist.
The General tab in System Configuration offers Normal, Diagnostic, and Selective startup options, allowing you to load only basic devices and services. If you need to enter safe mode, the Boot tab allows administrators to configure Safe Boot parameters, forcing the OS to load without network drivers or high-resolution graphics upon the next restart.
The "Clean Boot" Technique: The most frequent use of
msconfigis isolating software conflicts. The Services tab in System Configuration allows administrators to hide all Microsoft services. By checking this box, you are left looking exclusively at third-party services. Disabling these helps to isolate third-party service issues from core OS failures.
While older versions of Windows managed startup software here, in modern Windows versions, the Startup tab in System Configuration redirects users to the Task Manager to manage startup items. Finally, the Tools tab provides a list of administrative tools (like Event Viewer or Registry Editor) with buttons to launch specific utilities directly, serving as a rapid-access launchpad when you are deep in troubleshooting.
If the MMC is the control room, the Registry is the foundational code upon which the entire city is built. The Registry Editor (launched via the regedit command) is a graphical tool used to view and modify the Windows Registry database.
The Windows Registry stores low-level configuration settings for the operating system and installed applications. Every time you change your desktop wallpaper, install a driver, or alter a security policy, the actual variable being saved is written into the Registry.
Because the Registry is vast, it is divided into massive root directories. The highest-level folders in the Windows Registry hierarchy are called Hives. The two most important Hives you will interact with are:
[HKEY_LOCAL_MACHINE](https://en.wikipedia.org/wiki/Windows_Registry)(HKLM): Contains configuration data applicable to the entire computer hardware and operating system, regardless of who is logged in.[HKEY_CURRENT_USER](https://en.wikipedia.org/wiki/Windows_Registry)(HKCU): Contains configuration data specific to the currently logged-on user profile.
The Registry dictates reality for the Windows operating system. As a result, it is unforgiving. Modifying the Windows Registry incorrectly can cause system instability or prevent the operating system from booting entirely. You must treat regedit with the utmost precision—always backing up a Hive before making a change, and only modifying keys when you perfectly understand the mechanism you are altering.