Organizational Documentation and Inventory
Not sure you’re ready?
Take the ~3-minute readiness diagnostic and see where you stand.
Imagine a master architect constructing a 50-story skyscraper, only to immediately burn the blueprints, erase the electrical schematics, and throw away the keys to the mechanical rooms. When a pipe bursts on the 43rd floor at 2:00 AM, the maintenance crew is reduced to tearing down walls at random, hoping to stumble upon the main shutoff valve before the building floods. In computer networking, attempting to manage an infrastructure without meticulous documentation is precisely the same self-inflicted sabotage. You are not merely a technician swapping out broken parts; you are the custodian of a complex, evolving nervous system. When the network fails and business operations grind to a halt, your speed and accuracy depend entirely on the quality of your maps, inventories, and operating procedures.
To understand a network, you must be able to see it. But a network exists simultaneously in two dimensions: the tangible reality of copper, fiber, and silicon, and the invisible logic of data flow. To troubleshoot effectively, we must separate these perspectives into distinct diagrams.
Physical vs. Logical Network Diagrams
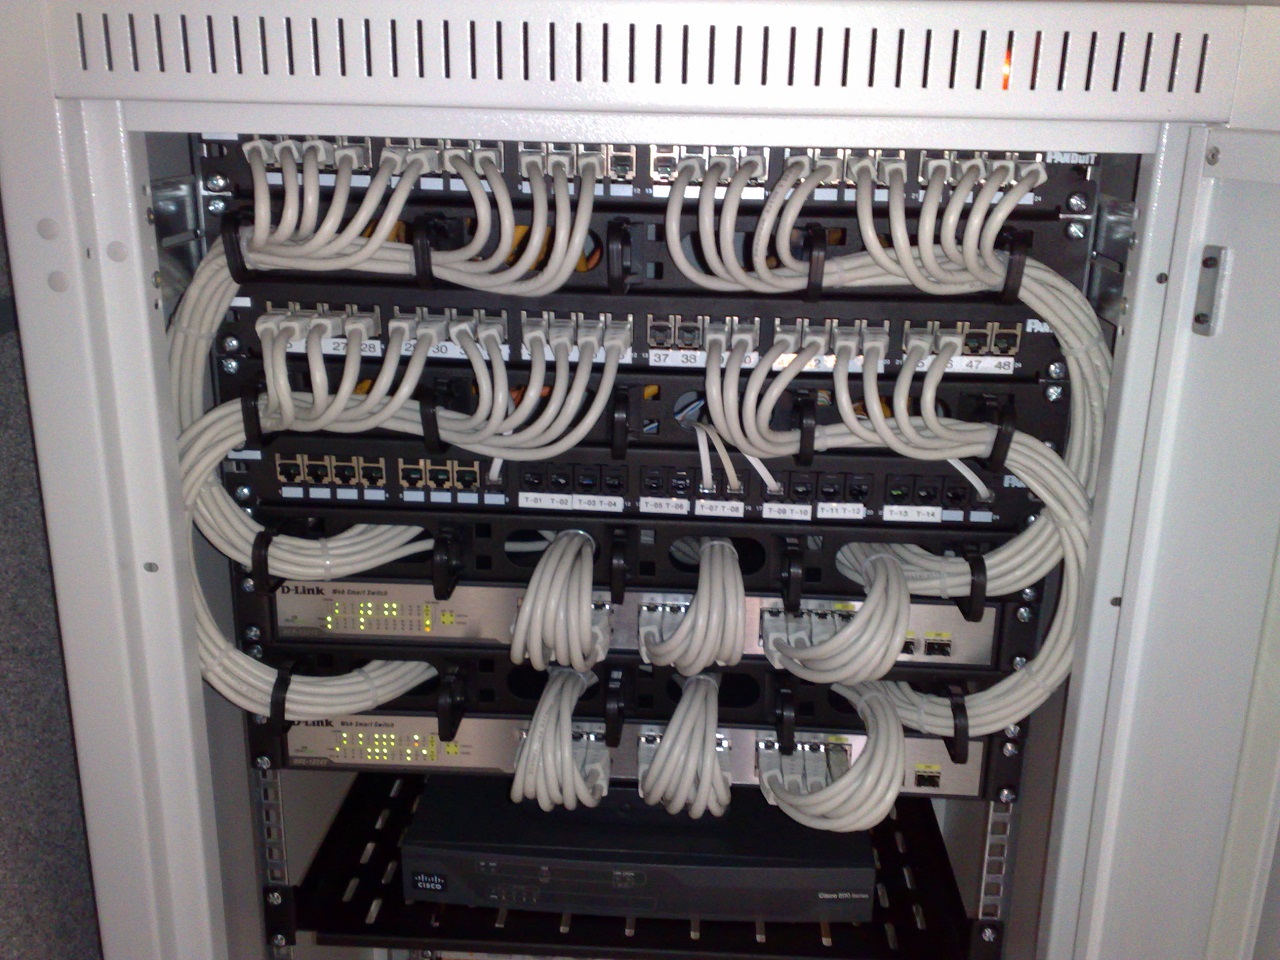
A physical network diagram illustrates the actual hardware layout of a network infrastructure. It is your architectural blueprint. When a backhoe cuts a fiber line or a switch dies, you consult the physical diagram because it outlines the geographic locations of network endpoints. These diagrams document cable lengths, port numbers, and specific hardware locations down to the exact closet and wall.
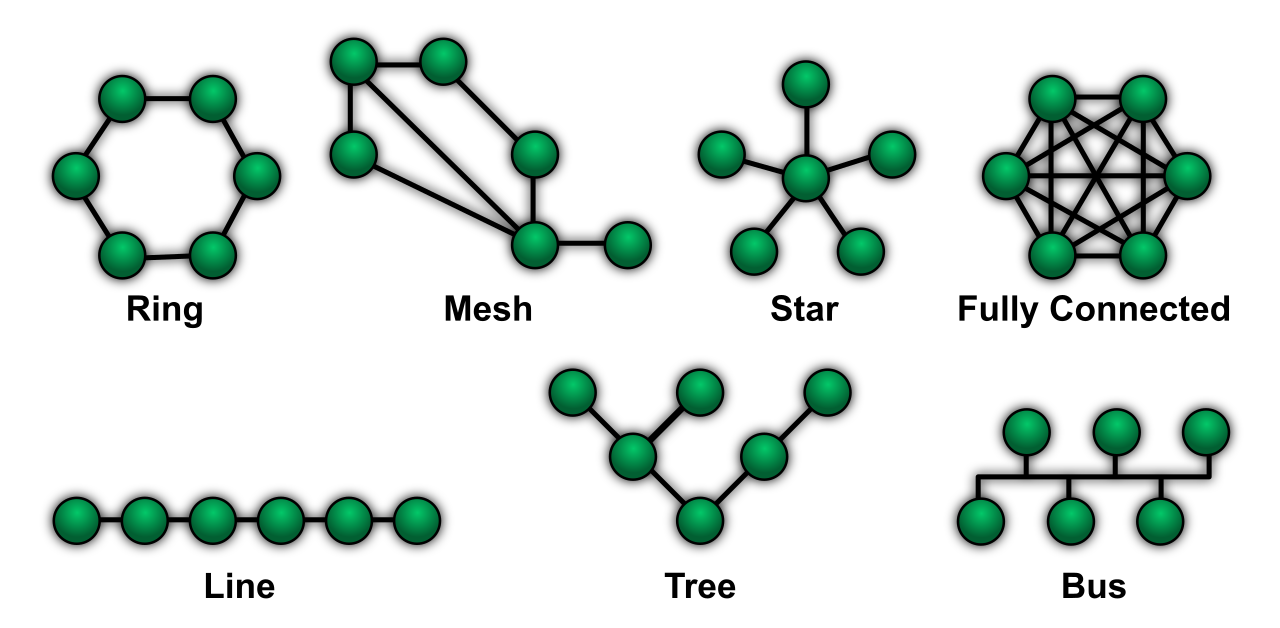
Conversely, a logical network diagram depicts the conceptual flow of data across a network infrastructure, completely abstracted from where the physical boxes sit in the real world. A router in New York and a switch in London might be connected by a single line on this diagram if they are logically adjacent. Logical network diagrams display IP address schemes, subnets, and VLAN configurations. Furthermore, they document routing protocols and virtual network boundaries (like firewalls and VPN tunnels).
| Feature | Physical Network Diagram | Logical Network Diagram |
|---|---|---|
| Primary Focus | Hardware, cables, exact locations | Data flow, addressing, segmentation |
| Key Details | Port numbers, cable lengths, endpoints | Subnets, VLANs, routing protocols |
| Use Case | Replacing a dead switch, tracing a physical wire | Troubleshooting routing loops or IP conflicts |
Navigating Racks and Cables
Zooming in on the physical infrastructure, we rely on highly specific tools for the data center and the wiring closet.
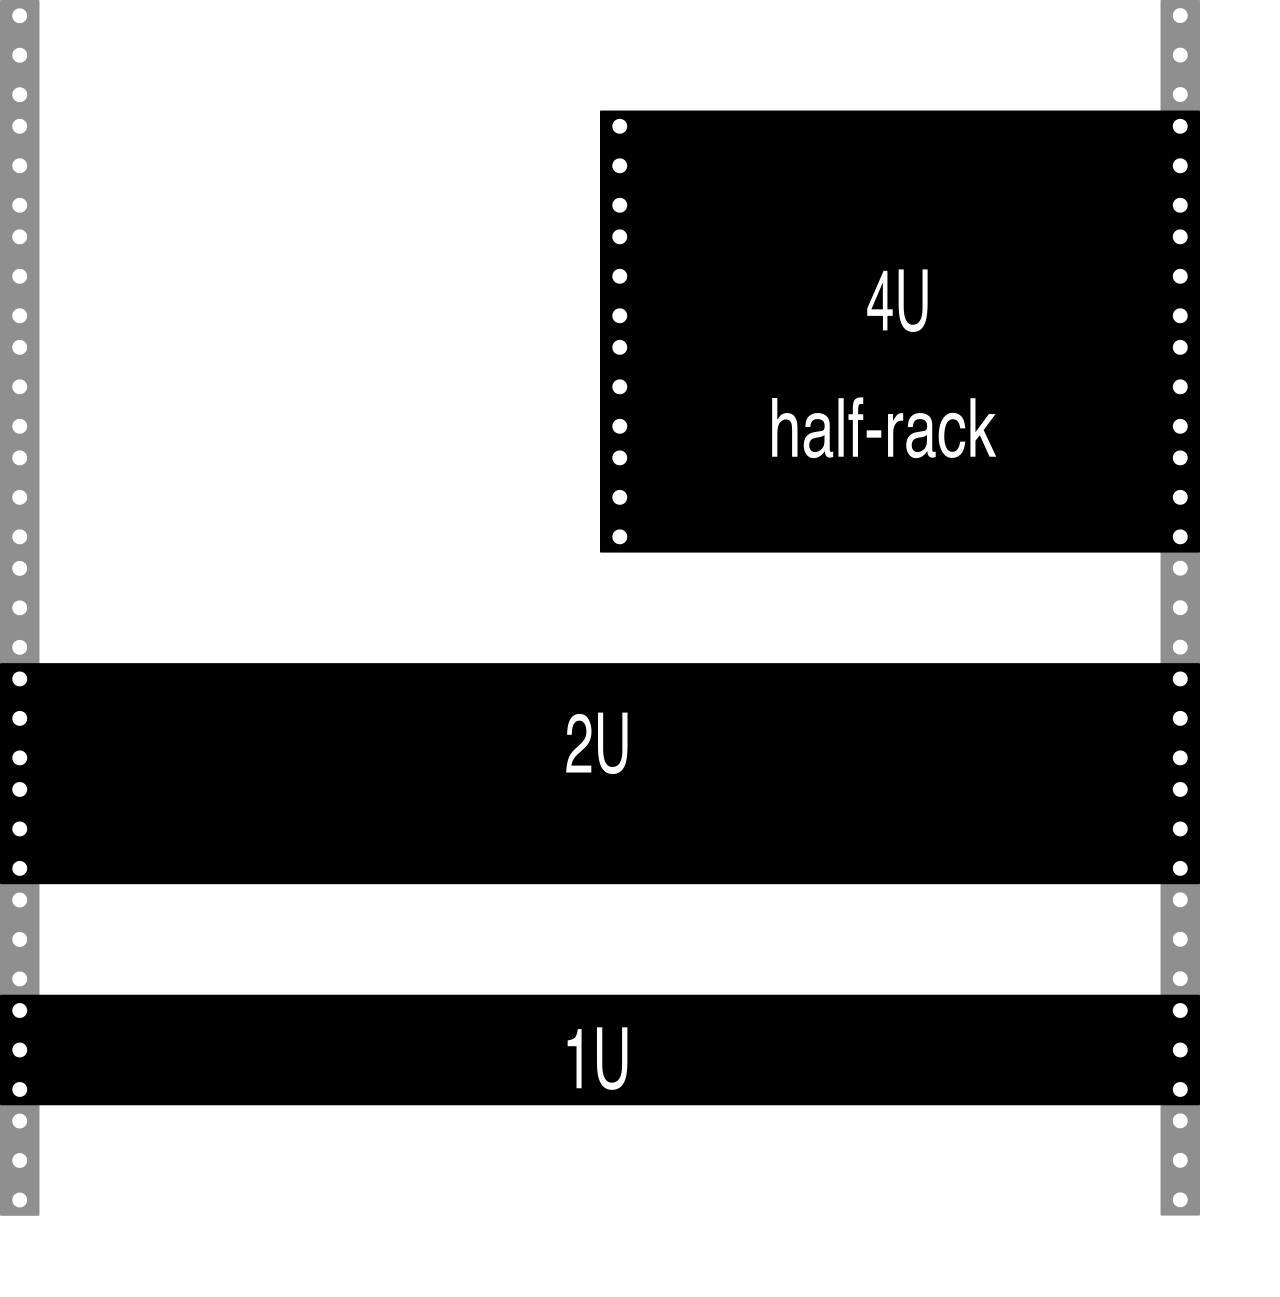
A rack diagram provides a scaled visual representation of the equipment installed within a server rack. In a dense server environment, space and thermals are premium commodities. Rack diagrams track the exact unit height occupied by switches, routers, and servers. This vertical space is standardized: a single standard Rack Unit (1U) measures exactly 1.75 inches in height. Network administrators use rack diagrams to plan for power distribution and cooling airflow within a data center. If you stack too many heat-generating 2U servers without planning the exhaust paths, the equipment will cook itself.
Between those racks and the users' desks lies a maze of wiring. A cable map documents the physical cable connections between endpoints, patch panels, and switch ports. When a user in Cubicle 4B reports a dead connection, a well-maintained cable map traces individual cable runs to specific wall jacks and patch panel ports, allowing you to instantly isolate the broken link rather than blindly tugging on cables in a tangled closet.
You cannot secure, update, or troubleshoot equipment you do not know you own. Meticulous inventory management is the bedrock of operational stability.
Hardware and Asset Tags
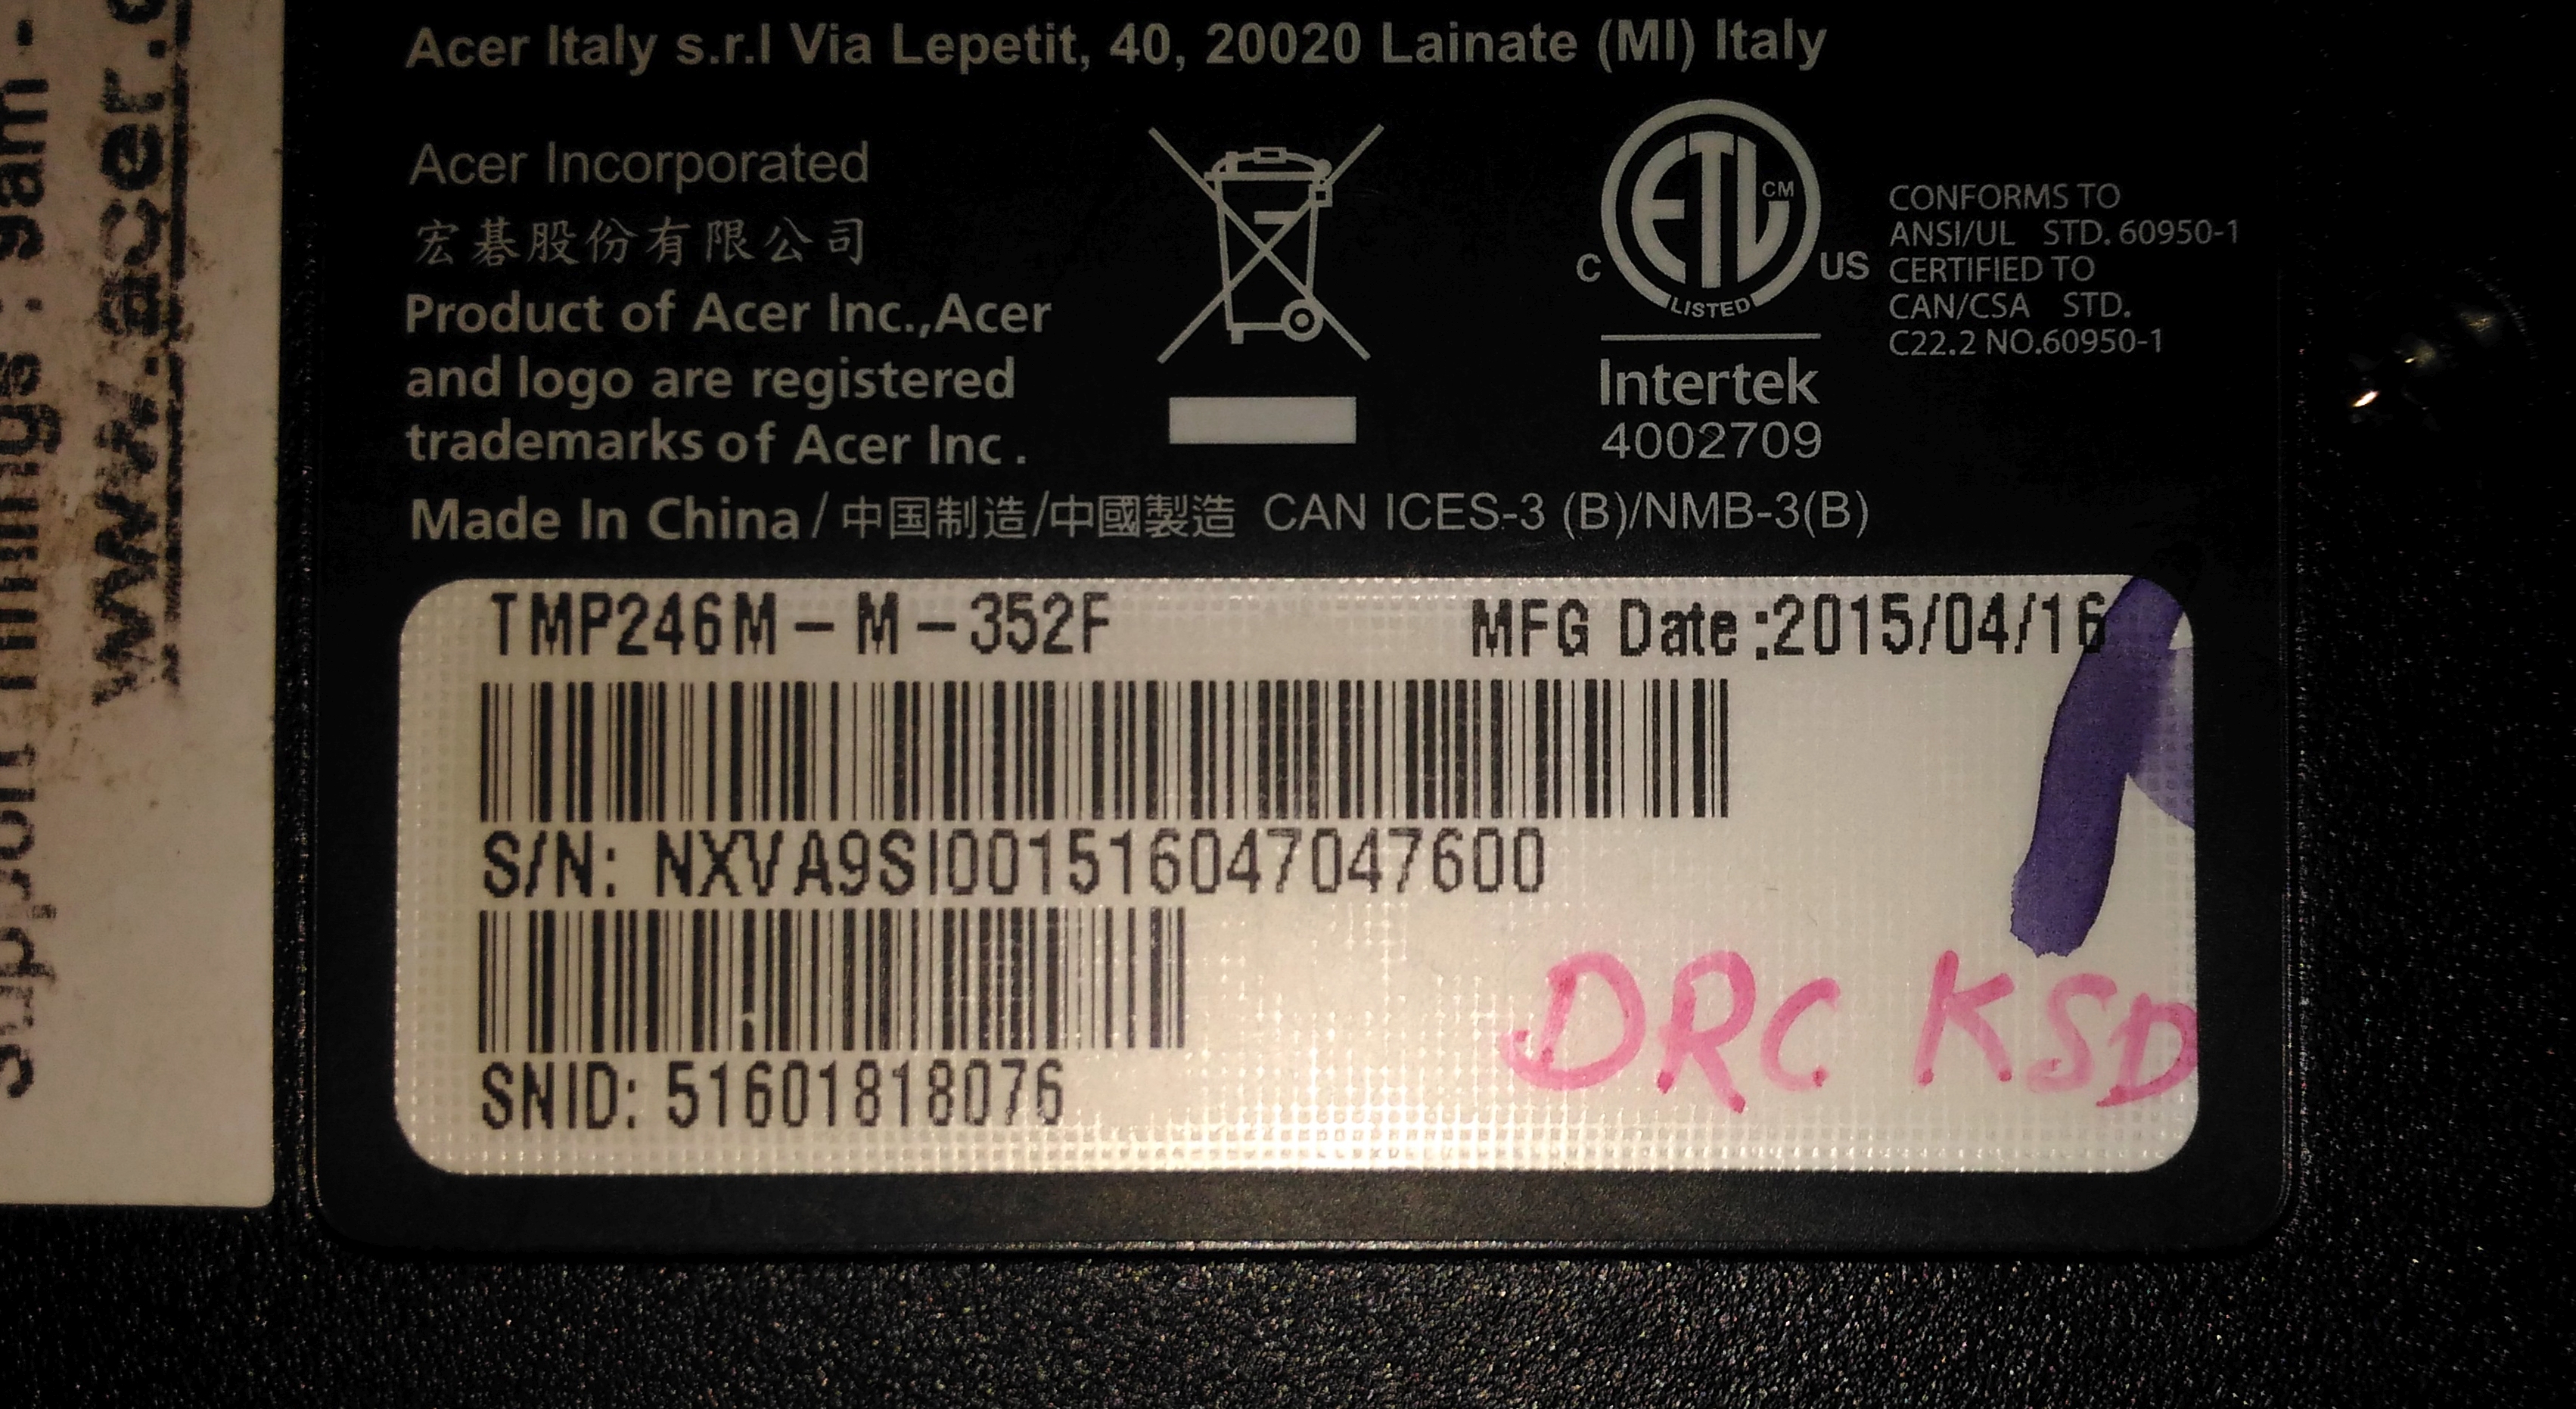
A hardware asset inventory tracks the lifecycle state of physical networking equipment from the loading dock to the recycling bin. Proper hardware asset inventories record device serial numbers, MAC addresses, and physical locations.
To bridge the gap between a spreadsheet and a physical device, administrators use asset tags. These provide a physical tracking number attached directly to networking hardware—usually a durable barcode or QR code sticker. When an auditor or technician scans the tag, it correlates instantly with the inventory database.
Software Licensing and Compliance
Software is invisible, making it incredibly easy to mismanage. Software licensing inventory management ensures organizational compliance with vendor usage agreements. This documentation tracks the number of purchased seats and license expiration dates.
If your organization ignores this, the financial consequences are severe. Software vendors routinely conduct software licensing audits, which verify that an organization is not using more concurrent software instances than legally purchased. Failing an audit can result in massive, unbudgeted true-up fees.
The Inevitable Decay: Equipment Lifecycles
Technology ages rapidly. Proper documentation anticipates obsolescence rather than reacting to it as an emergency.
- End of Life (EoL) documentation tracks the date when a vendor will stop selling a specific hardware or software product. This is your signal to stop buying older models and begin planning a transition.
- End of Support (EoS) documentation tracks the date when a vendor will no longer provide updates or technical support for a product. Running an EoS firewall is a massive security liability, as zero-day vulnerabilities will never be patched.
- Warranty documentation records the active service contracts and return-to-vendor procedures for network equipment. When a $15,000 core router suffers a hardware failure, you need to know instantly if it is covered for a next-day replacement.
A network without organized IP addressing is a chaotic metropolis without street signs. Historically, administrators used sprawling, error-prone spreadsheets to assign IPs. Today, we rely on IP Address Management (IPAM) software, which centralizes the administration of IP space across an organization.
IPAM is essentially an air traffic control tower for your network addressing. Highly efficient IP Address Management solutions integrate DNS and DHCP services into a single management console. Instead of configuring a DHCP scope on one server and manually adding DNS records on another, IPAM synchronizes them.
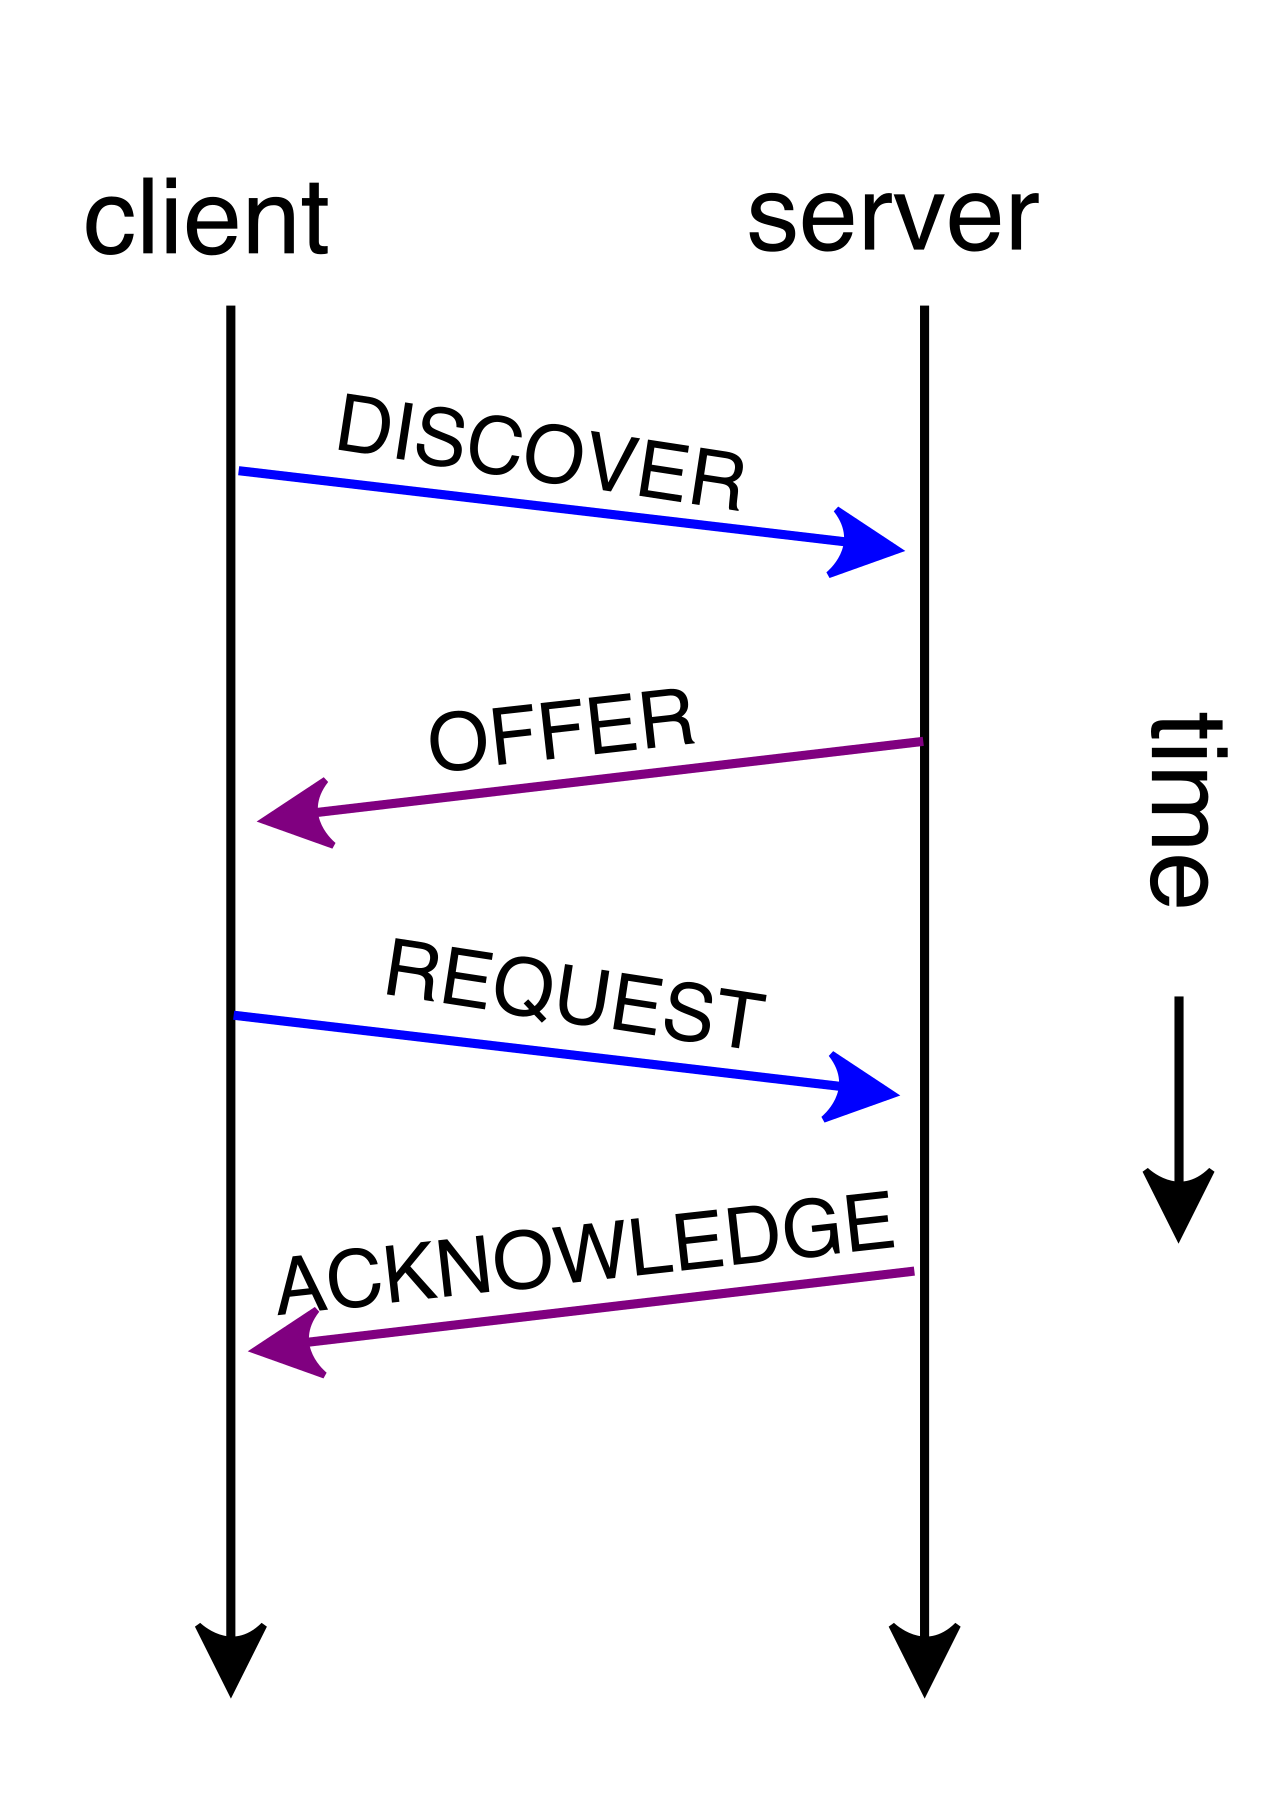
Network administrators use IP Address Management platforms to prevent IP address conflicts—the catastrophic scenario where two vital servers claim the same IP, effectively knocking each other off the network. Furthermore, IPAM tools automatically track the availability and utilization of specific subnets, alerting you before a DHCP pool is entirely exhausted. For security and compliance, IP Address Management systems provide historical data on IP address assignments for auditing purposes, allowing you to trace exactly which device held a specific IP during an intrusion event last month.
Wi-Fi is merely radio frequency (RF) energy, invisible to the human eye but subject to the strict laws of physics. It bounces off metal, is absorbed by water, and degrades over distance. To visualize this invisible terrain, we use a wireless site survey heat map, which visualizes radio frequency signal strength across a physical floor plan.
Network engineers use wireless heat maps to determine the optimal physical placement for wireless access points. By color-coding signal strength—usually with red indicating strong coverage and blue indicating weak coverage—wireless heat maps highlight areas of signal overlap and dead zones within a building.
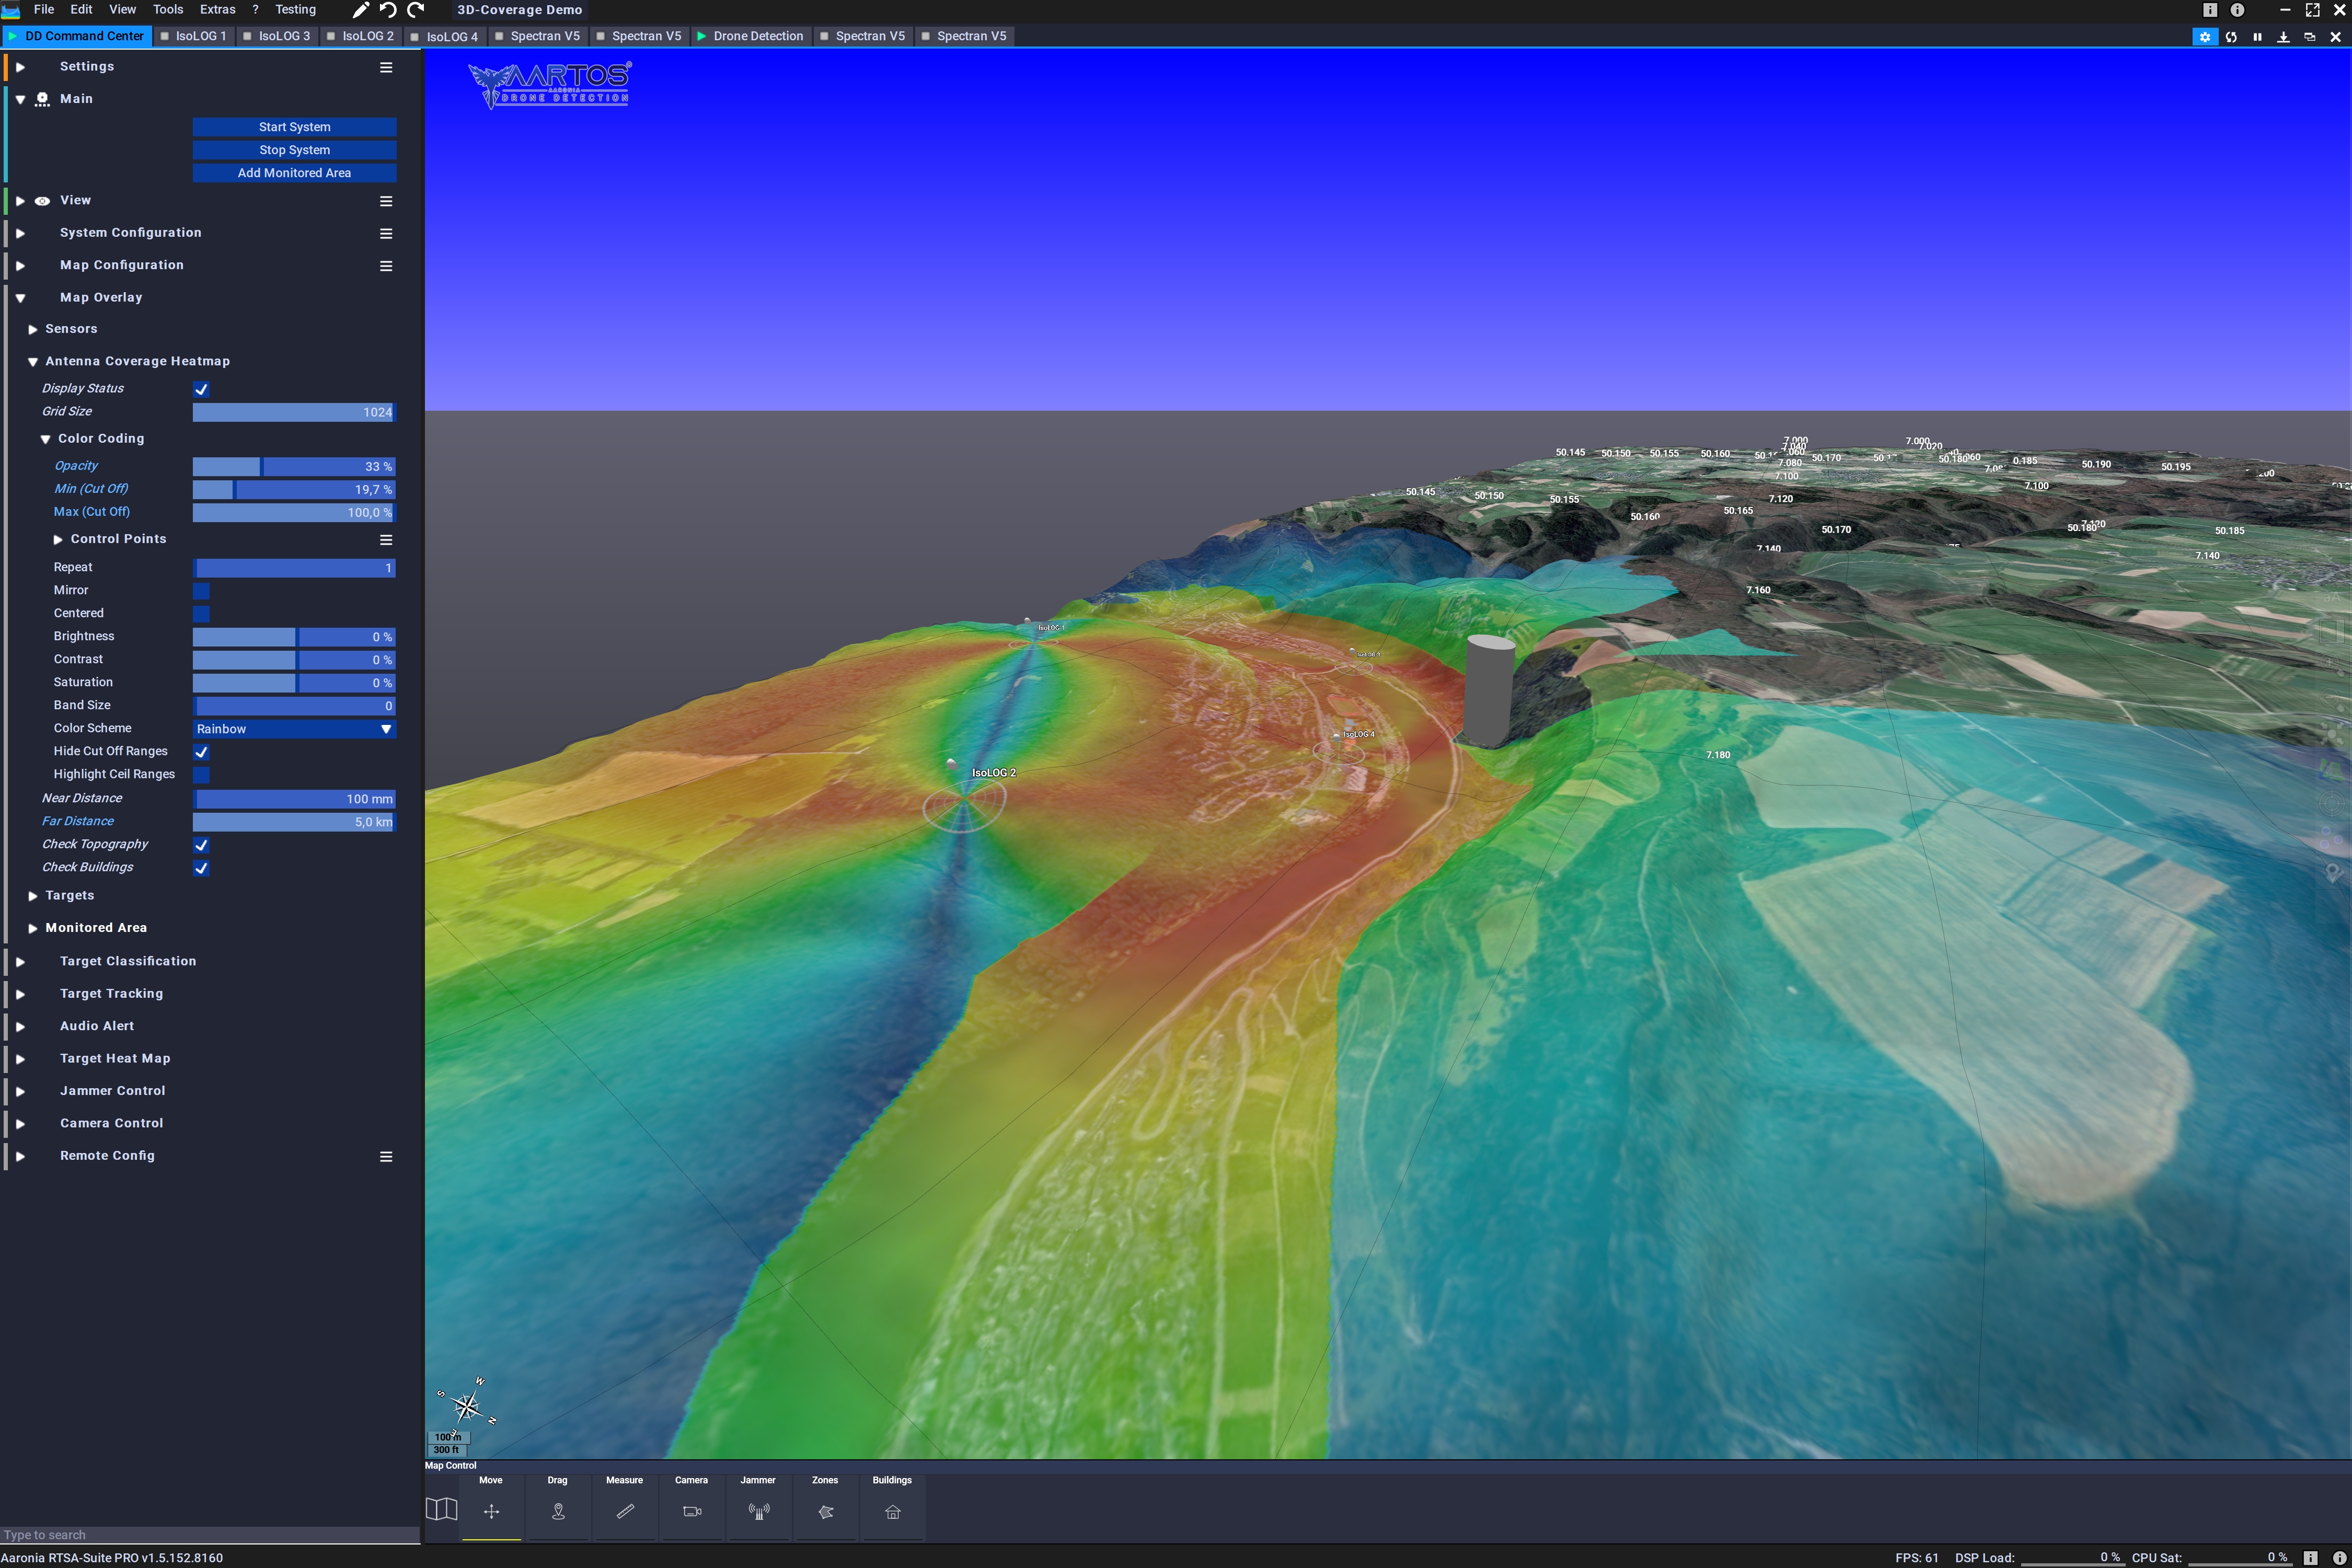
We generate these maps using three distinct survey methods:
- Predictive wireless surveys use software to simulate radio frequency coverage based on floor plans without requiring physical on-site measurements. You input the building materials (e.g., drywall, concrete, glass), and the software mathematically models the expected RF propagation.
- Passive wireless site surveys require walking the physical space with a scanning device to measure environmental radio frequency signal strength without connecting to the wireless network. This "listens" to the airwaves, documenting beacons from all nearby access points and identifying rogue interference.
- Active wireless site surveys go a step further. The surveyor connects to the network and measures actual network traffic metrics like packet loss and ping rates while moving through the facility.
A brilliantly documented physical infrastructure means little if the operations executed upon it are haphazard. We must document how we operate, what is normal, and what we promise to deliver.
Standard Operating Procedures and Baselines
Standard Operating Procedures (SOPs) provide step-by-step instructions for executing routine network operational tasks. Whether you are provisioning a new switch or offboarding an employee, Standard Operating Procedures ensure consistency in network troubleshooting and configuration changes. Without SOPs, ten technicians will solve a problem ten different ways, creating an unmanageable, fragile network.
But how do you know if the network is actually "broken" or just busy? You consult the baseline document, which records the normal performance metrics of a network under typical operational loads. If CPU utilization on the core router hits 75% on a Tuesday morning, is that a malicious DDoS attack or just the accounting department running weekly reports? The baseline provides the answer. Furthermore, network configurations must be documented to provide a baseline for future troubleshooting. If a network engineer tweaks a routing table and connectivity drops, you must have the baseline configuration to roll back to a known-good state.
The Physics of Promises: Service Level Agreements
When networking intersects with business contracts, we rely on a Service Level Agreement (SLA). An SLA is a contractual guarantee of specific network performance metrics between a provider and a customer.
These are not merely polite promises; they are legally binding parameters. Service Level Agreements define minimum acceptable network uptime percentages (like guaranteeing "Five Nines" or 99.999% availability). They also establish maximum allowable response times for network support requests. Because businesses lose money when networks fail, Service Level Agreements often include financial penalties if a service provider fails to meet the specified performance metrics.
To quantify these guarantees, SLAs utilize strict reliability metrics:
Mean Time To Repair (MTTR): A metric commonly defined within a Service Level Agreement to guarantee issue resolution speed. It measures the average time it takes to detect, diagnose, and fully fix a failed component.
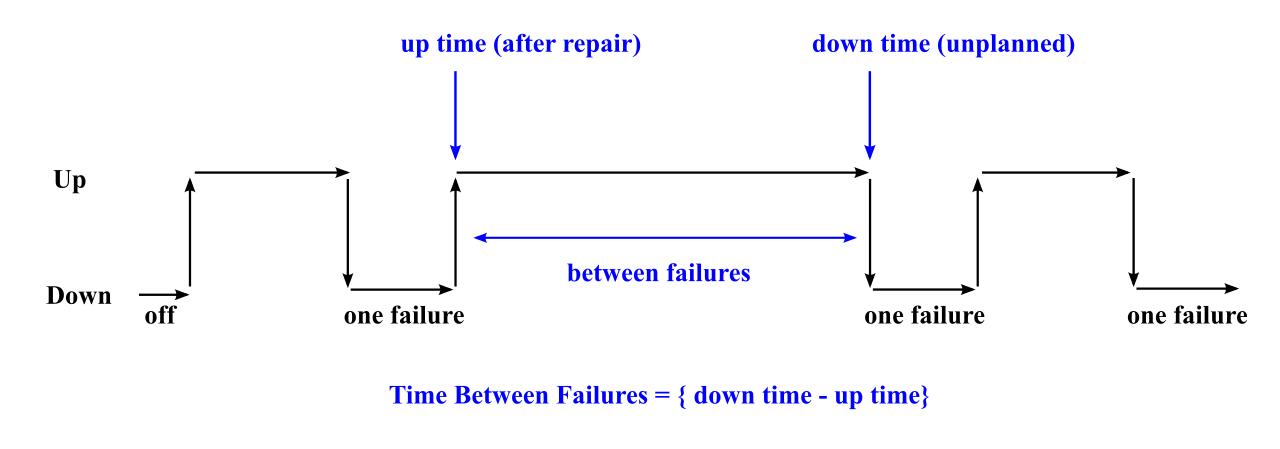
Mean Time Between Failures (MTBF): Measures the predicted elapsed time between inherent failures of a network system during normal operation. It calculates the raw reliability and longevity of the hardware itself.
Ultimately, documentation and inventory are not bureaucratic busywork meant to keep you away from "real" networking. They are the network. They transform an incomprehensible tangle of wires, invisible waves, and complex software into a rational, manageable, and highly resilient system.