Monitoring Solutions and Baseline Metrics
Not sure you’re ready?
Take the ~3-minute readiness diagnostic and see where you stand.
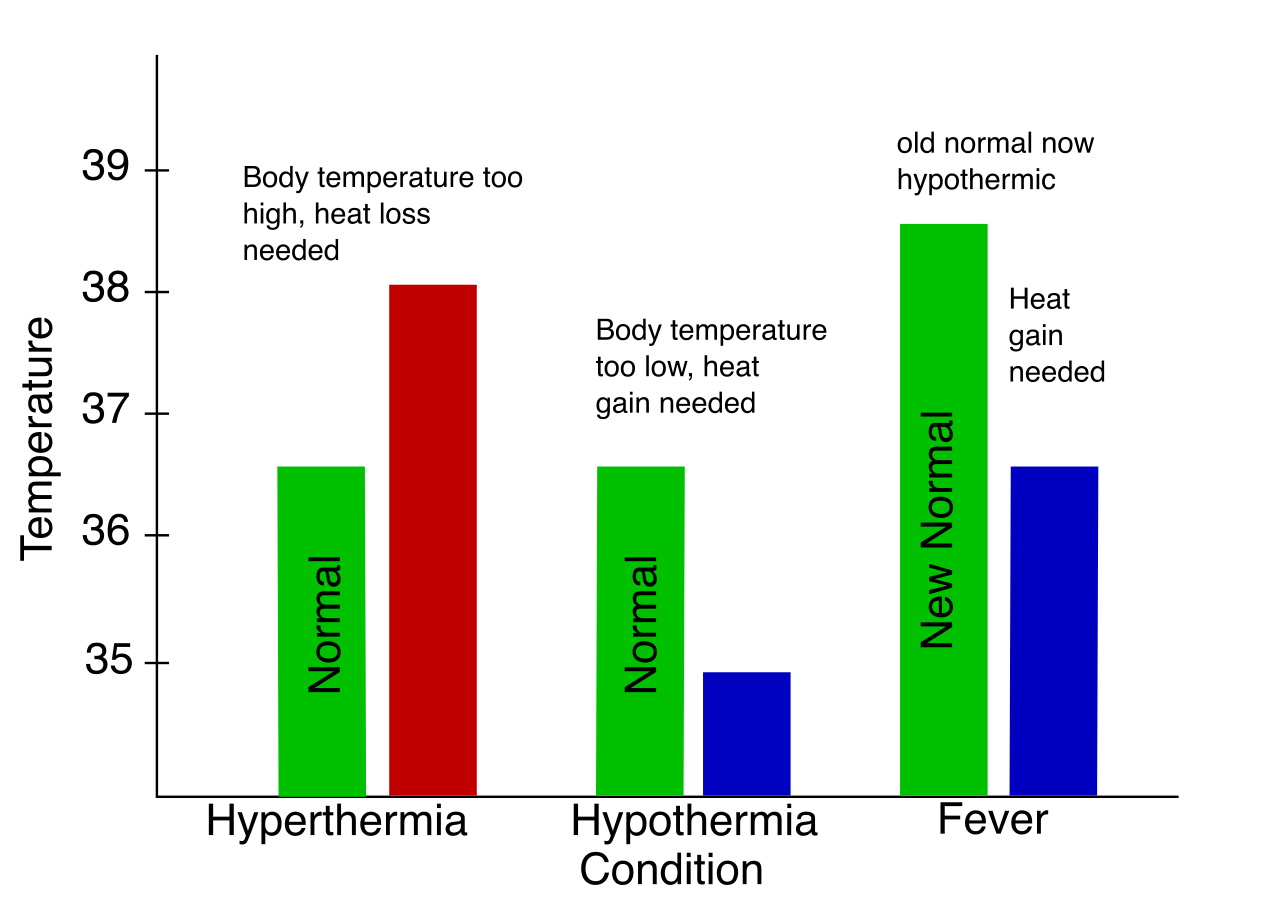
A physician cannot diagnose a fever without first understanding that a healthy, resting human body temperature sits around 98.6 degrees Fahrenheit. If they measure a patient at 102 degrees, it is only the deviation from the norm that provides the diagnosis. A computer network operates under the exact same immutable logic. We cannot troubleshoot a "slow" network if we lack a mathematically precise definition of a "fast" network. For the modern network administrator or support technician, intuition is entirely useless without data. We must map the unseen topology, measure the pulse of traversing data, and establish a firm, empirical understanding of everyday operational reality.
Before we can measure a network, we must first know what exists within it. The modern enterprise network is not static; it breathes, expanding and contracting as servers spin up and mobile clients roam.
To map this environment, we rely on network discovery, which is the automated process of mapping devices, IP addresses, and topology within a computer network. We generally divide this process into two distinct operational modes:
- Active network discovery sends probing packets to network hosts to identify active IP addresses and open service ports. It acts as a sonar ping, forcing devices to respond and reveal themselves.
- Passive network discovery listens to existing network traffic without sending probes to quietly identify communicating devices. This is invaluable when auditing sensitive or legacy environments that might crash if actively interrogated.

The timing of these scans is driven by operational necessity. When you plug a new subnet into the data center, scheduled network discovery scans run at predefined intervals to automatically inventory newly provisioned infrastructure. However, if a security alert triggers because a rogue device is detected in the accounting department, network administrators perform ad hoc network scans to immediately investigate suspected unauthorized devices.
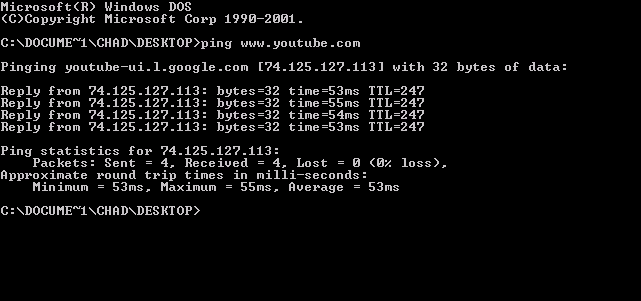
A common technique for an ad hoc active scan is the ping sweep. A ping sweep sends Internet Control Message Protocol (ICMP) Echo Request messages to a range of IP addresses to identify active hosts.
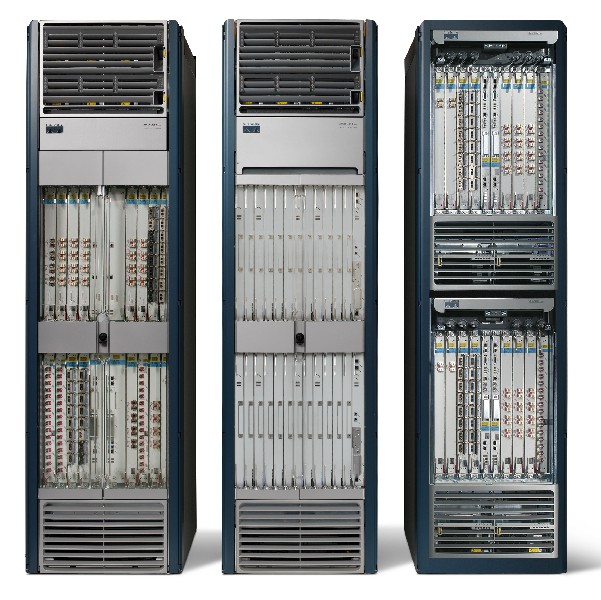
At the switch level, infrastructure devices constantly whisper to one another to understand their immediate surroundings. To facilitate this, they use Layer 2 discovery protocols:
- The Link Layer Discovery Protocol (LLDP) is an IEEE standard used to discover the identities and capabilities of directly connected neighbor devices, allowing disparate hardware from varying vendors to build an accurate local topology map.
- The Cisco Discovery Protocol (CDP) is a proprietary Layer 2 protocol used to share hardware and software information between connected Cisco devices.
Once the map is drawn, we must establish what normal looks like.
A network baseline establishes a benchmark of normal network performance during typical operating conditions.
Why does this matter? Because a CPU running at 80% utilization on a Tuesday afternoon might be a critical emergency on an access switch, but perfectly normal on a core routing engine handling Border Gateway Protocol (BGP) calculations. Network administrators compare current network metrics against a historical baseline to detect performance anomalies.
The baseline is a living document. The infrastructure changes, and so too must our understanding of "normal." Consequently, baseline metrics must be reestablished after significant network upgrades to ensure the comparative data remains accurate. If you replace a 1 Gbps backbone with a 10 Gbps backbone, your historical baseline of link saturation is now irrelevant.
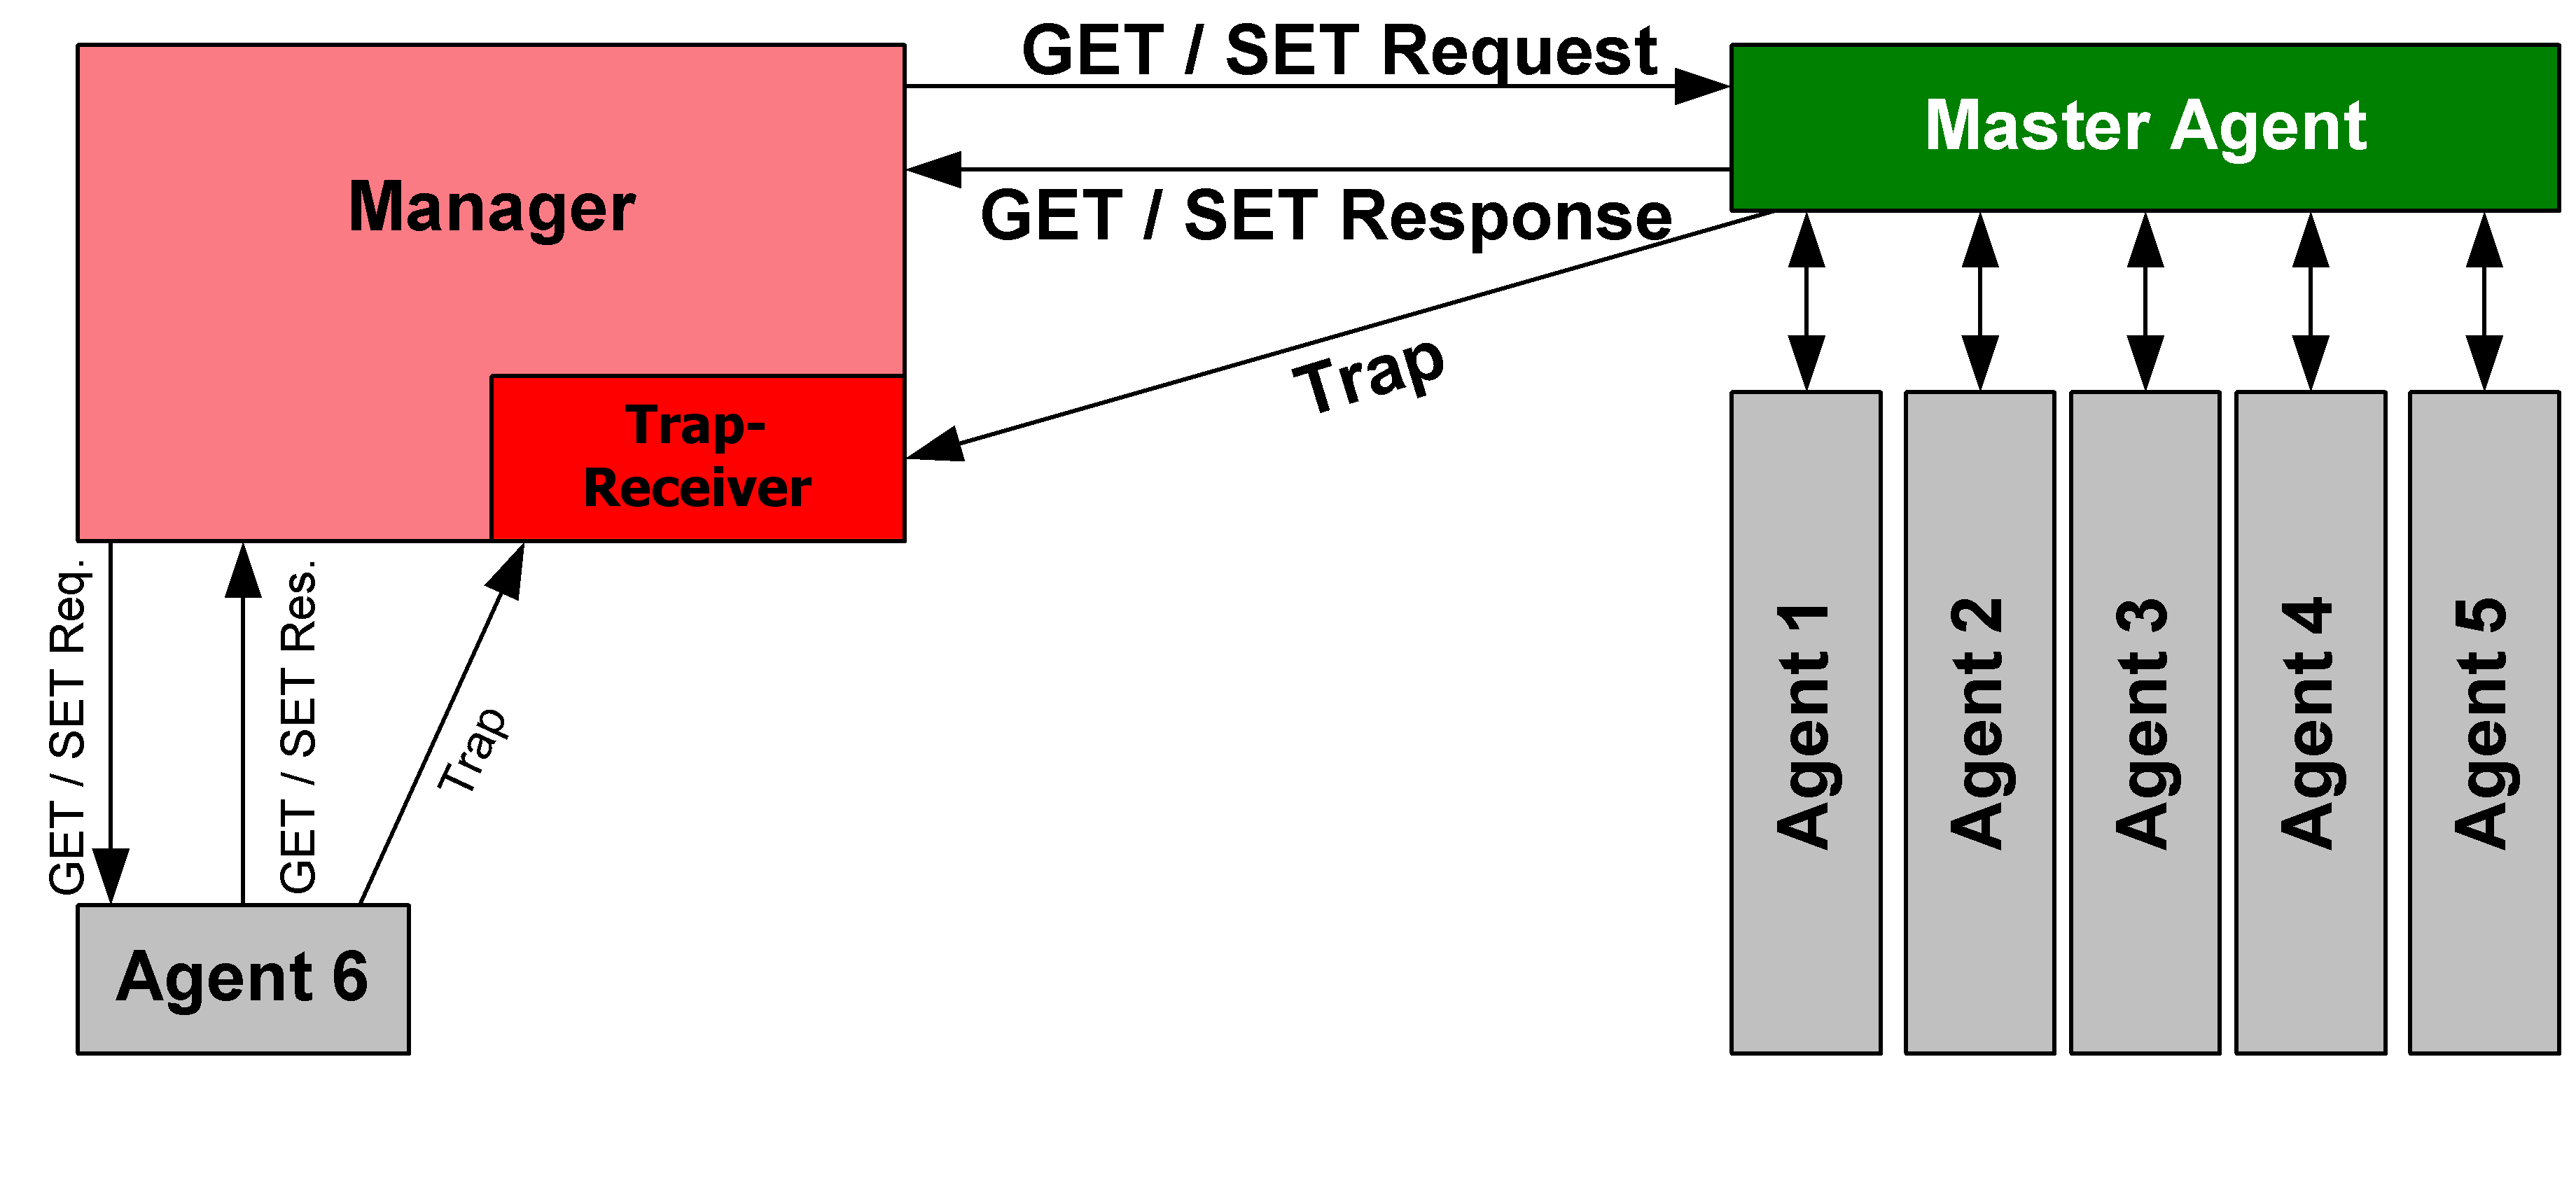
To build these baselines, we need a mechanism to extract data from switches, routers, and servers. We use the Simple Network Management Protocol (SNMP), which is an application-layer protocol used to collect performance data from network devices.
The architecture is built on a simple client-server relationship:
- An SNMP manager polls SNMP agents installed on network devices to collect resource utilization data.
- Occasionally, a device experiences a failure so severe that it cannot wait to be polled. In this case, it generates an SNMP trap, an unsolicited message sent by an SNMP agent to notify the SNMP manager of a critical system event.
When the SNMP manager queries an agent, they must speak a common structured language.
- A Management Information Base (MIB) is a hierarchical database used by SNMP to structure manageable device variables.
- Inside that MIB, Object Identifiers (OIDs) are unique numeric strings used to identify specific hardware or software metrics within an SNMP MIB. An OID is simply a precise address for a specific piece of data—like finding the exact shelf where the CPU temperature is stored.
The Evolution of SNMP Security
For decades, SNMP was notoriously insecure. SNMP version 1 and SNMP version 2c transmit authentication community strings in plaintext. If an attacker performs a basic packet capture on the network, they can read the community string and take administrative control of the device.
To solve this, the industry introduced SNMP version 3, which provides cryptographic security features including message integrity, device authentication, and payload encryption. Always enforce SNMPv3 in production environments.
SNMP tells us the state of the device. But what about the state of the traffic flowing through it? We have two primary lenses through which we can observe data in transit: inspecting the metadata, or reading the exact payload.
Flow-Based Monitoring
Imagine tracking a letter through the postal service. You can record the sender, the recipient, the postage amount, and the delivery time without ever opening the envelope to read the letter.
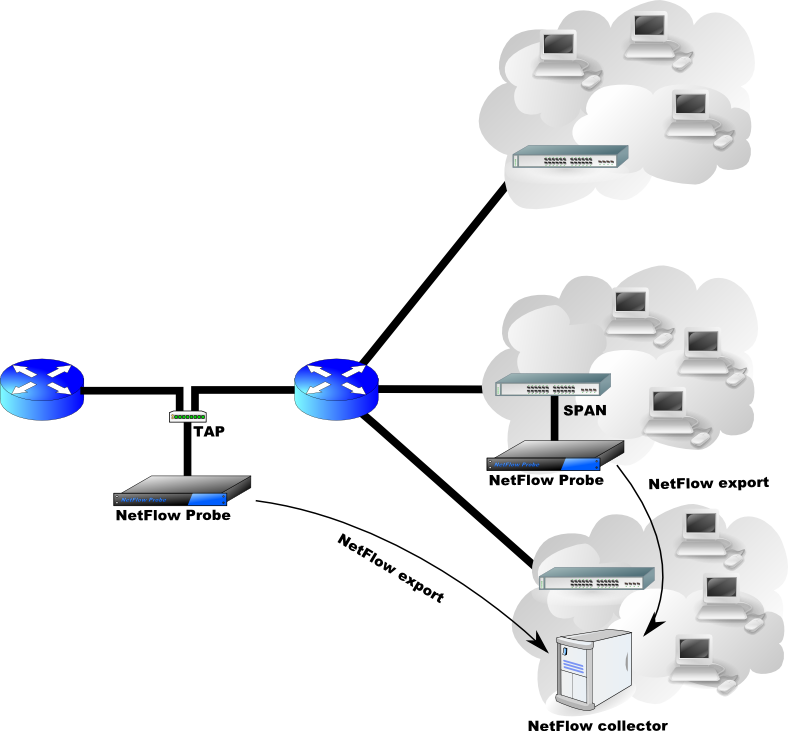
This is exactly how flow-based monitoring works: it collects metadata about network traffic sessions rather than capturing full packet payloads. By analyzing this metadata, administrators can see exactly who is consuming bandwidth without violating payload privacy or exhausting storage arrays.
| Flow Protocol | Technical Description |
|---|---|
| NetFlow | A network protocol originally developed by Cisco for collecting IP traffic flow information and analyzing volume. |
| IPFIX | IP Flow Information Export (IPFIX) is the vendor-neutral IETF standard protocol based on NetFlow Version 9. |
| sFlow | The sFlow protocol uses statistical packet sampling to monitor high-speed network traffic instead of recording every single packet. Rather than tracking an entire session, sFlow inspects, for example, 1 out of every 10,000 packets to generate a statistical model of traffic on massively congested backbones. |
Packet Sniffing
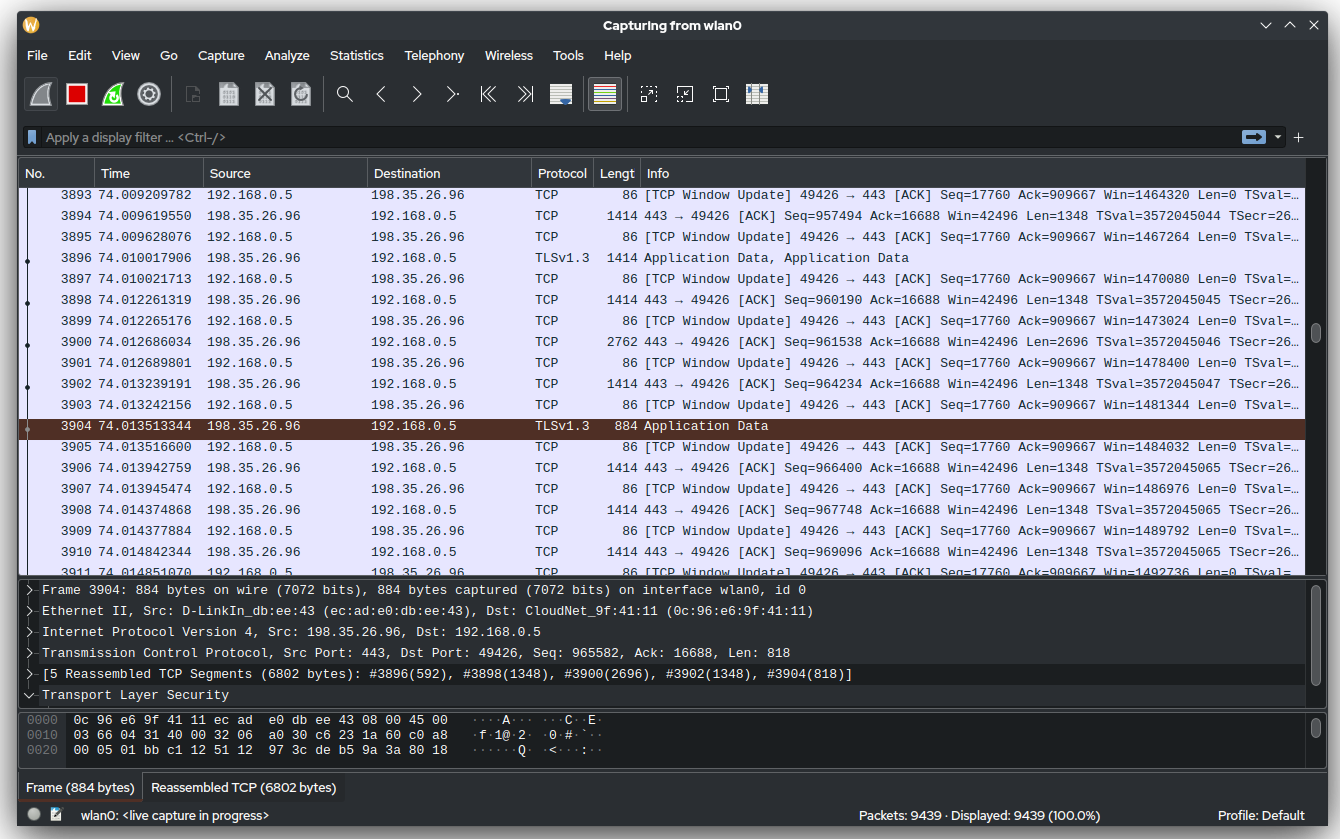
When flow metadata is insufficient—such as when investigating a complex application error or a malicious payload—we must open the envelope. Packet sniffing captures full network frames to allow administrators to perform deep packet inspection and detailed protocol analysis. Because this captures raw payload, it requires immense storage and processing power, making it a targeted troubleshooting tool rather than a continuous monitoring solution.
When we extract telemetry from our network using SNMP or Flow data, we are primarily looking for specific mathematical truths about data delivery.
Bandwidth utilization measures the exact percentage of a network link's total capacity currently being consumed by traffic.
If bandwidth utilization is low, but the network still behaves sluggishly, the issue is likely rooted in timing or physical degradation. We track three primary timing and delivery metrics:
- Latency measures the time delay required for a data packet to travel from a source node to a destination node.
- Jitter is the mathematical variation in the latency of received packets over a network connection. If packet one takes 20ms, packet two takes 80ms, and packet three takes 15ms, the latency is highly variable. High network jitter degrades the quality of real-time applications like Voice over IP (VoIP) and live video conferencing, resulting in robotic-sounding voices and frozen video frames.
- Packet loss occurs when data packets traveling across a computer network fail to reach the intended destination node, requiring the transport layer (if using TCP) to retransmit the missing data, further crippling throughput.
If latency, jitter, and loss are all climbing, the physical cable itself might be failing. To verify this, administrators check interface error metrics, which track malformed packets such as runts (frames smaller than the minimum 64 bytes) and giants (frames exceeding the maximum transmission unit) to help identify physical layer network issues like electromagnetic interference or a failing optic.
The ultimate metric of any infrastructure is whether it is actually available to the users who need it. Uptime represents the continuous duration a network device or service remains operational and accessible to users. In enterprise environments, the gold standard is the 'five nines' availability standard, which corresponds to 99.999 percent uptime (allowing for merely 5.26 minutes of downtime per year).
Achieving five nines is not an accident; it requires rigorous, automated oversight.
- Availability monitoring continuously checks device statuses using automated polling to ensure critical network services remain online.
- To achieve true resilience, we rely on proactive availability monitoring, which alerts administrators to failing hardware components (such as a dying power supply fan) before a complete system outage occurs.
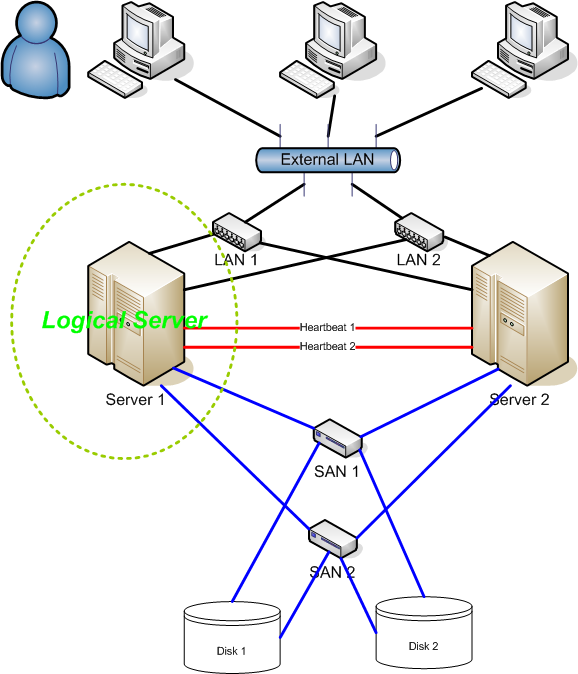
- For redundant architectures, heartbeat monitoring sends periodic signaling messages between systems to verify that a high-availability cluster node is still active. If the primary firewall stops sending its heartbeat, the secondary firewall instantly promotes itself to active duty.
Centralized Logging: Syslog
When anomalies happen, devices generate logs. Leaving these logs scattered across hundreds of isolated switches is a forensic nightmare. Instead, Syslog is a standard logging protocol used to centralize event messages from disparate network devices to a central server.
Syslog messages are categorized by severity levels (0 through 7). You must instantly recognize the extremes:
- Syslog severity level 0 indicates a system emergency where the device is entirely unusable (e.g., a total catastrophic hardware failure).
- Syslog severity level 7 is strictly reserved for detailed debugging messages during troubleshooting, generating massive amounts of noise that should only be enabled when actively hunting a deeply hidden protocol flaw.
Protecting the Configuration State
Finally, a network is only as stable as its configuration. A mistyped subnet mask or an accidentally deleted routing neighbor will take down a network faster than any hardware failure.
To defend against human error, organizations implement configuration tracking, which monitors network devices to detect unauthorized changes made to the running configuration files. When a change triggers an alert, administrators review configuration diffs, which visually highlight the specific lines of syntax that changed between an old device configuration and a new device configuration, allowing them to spot the mistake instantly.
In the event that a device dies completely, or an errant command ruins the entire routing table, network management systems execute automated backups of device configurations to enable rapid restoration after a hardware failure. You rack the new switch, push the automated backup, and the network breathes life once again.
Network monitoring is not a passive exercise. It is the active, empirical pursuit of understanding normal, measuring variance, and enforcing stability. Build your baselines, protect your configurations, and let the data lead you to the solution.