Network Monitoring Technologies
Not sure you’re ready?
Take the ~3-minute readiness diagnostic and see where you stand.
Imagine walking into a sprawling, automated factory operating entirely in pitch darkness. You can hear the hum of engines and feel the vibration of conveyor belts, but without instrumentation, you cannot tell if a machine is running optimally or tearing itself apart. A computer network is precisely this invisible factory. Without deliberately configured monitoring and logging systems, network administrators are essentially blind, reacting to catastrophic failures only after the users begin to complain. To manage, secure, and troubleshoot modern enterprise networks, we must build a comprehensive nervous system that collects operational telemetry, inspects traffic, and correlates seemingly disparate events into a coherent picture of network health.
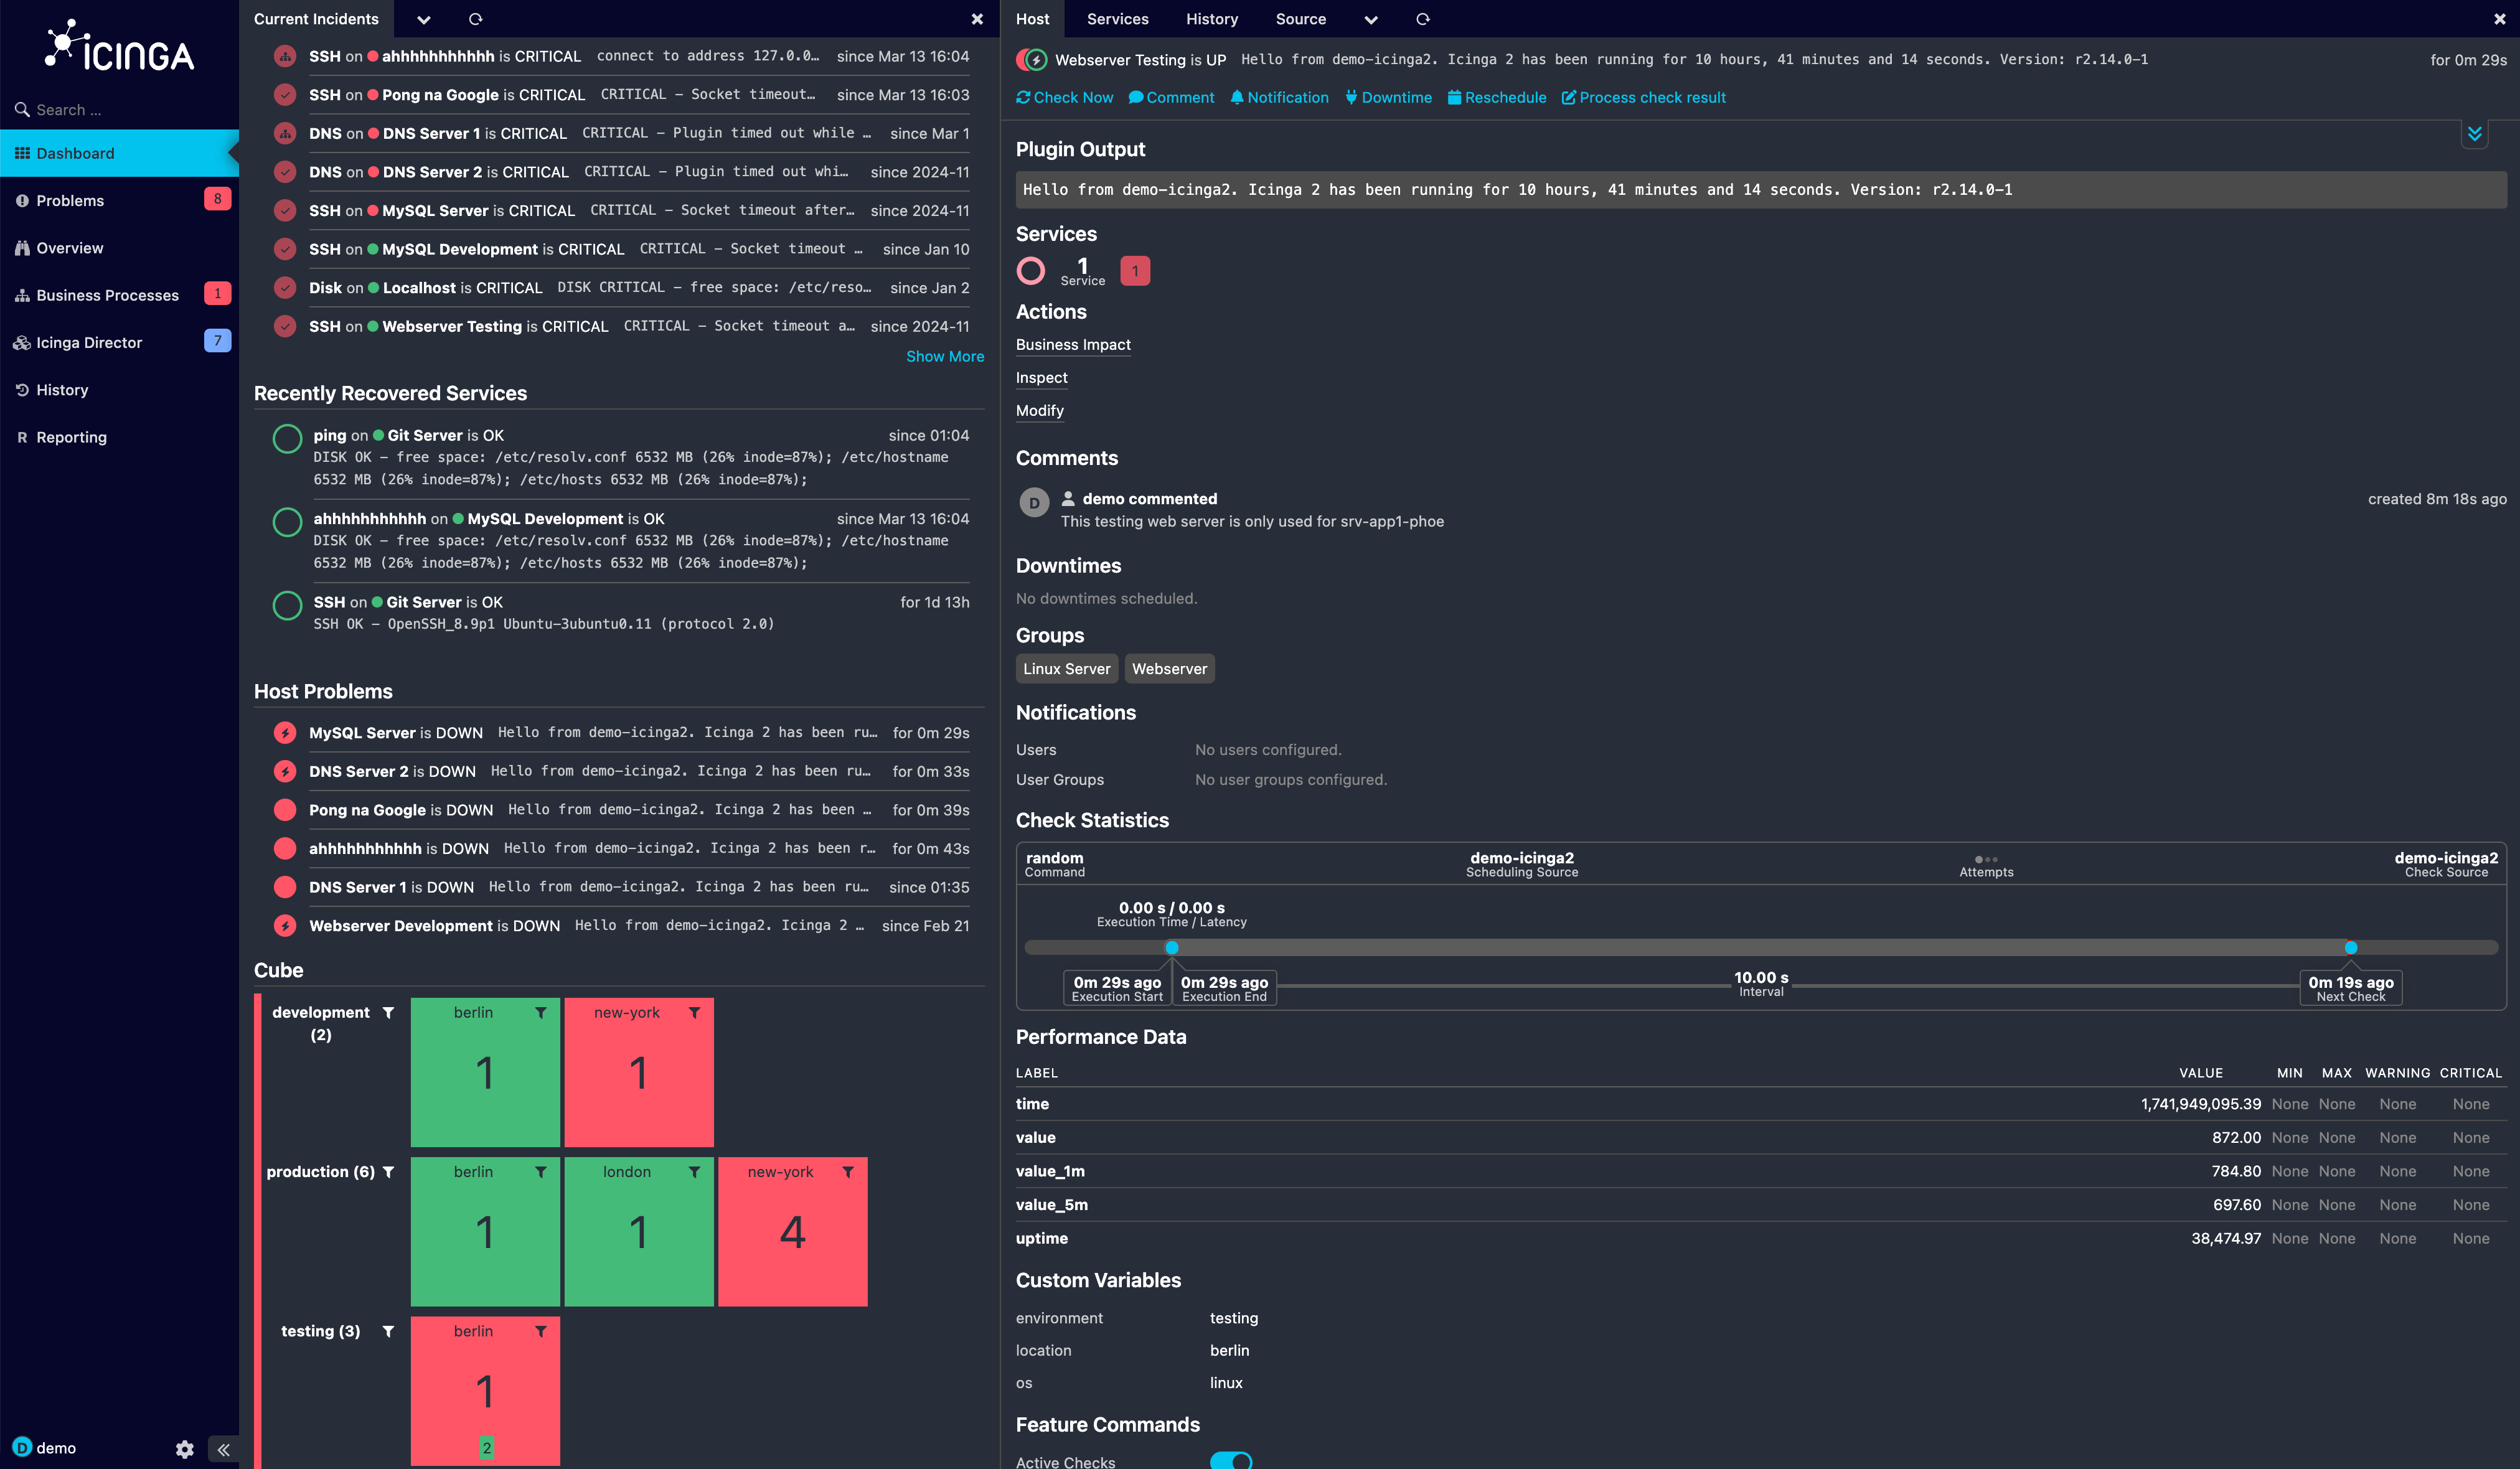
At the heart of network observability is SNMP, which stands for Simple Network Management Protocol. Operating at the Application layer (Layer 7) of the OSI model, SNMP provides a standardized framework to communicate with wildly different network devices—switches, routers, firewalls, and servers—regardless of the manufacturer.
SNMP uses a strict manager-agent architecture to monitor and configure network devices.
- An SNMP manager is a centralized system (often a dedicated server running monitoring software) used to monitor and manage network devices.
- An SNMP agent is a software component running locally on the managed network devices themselves.
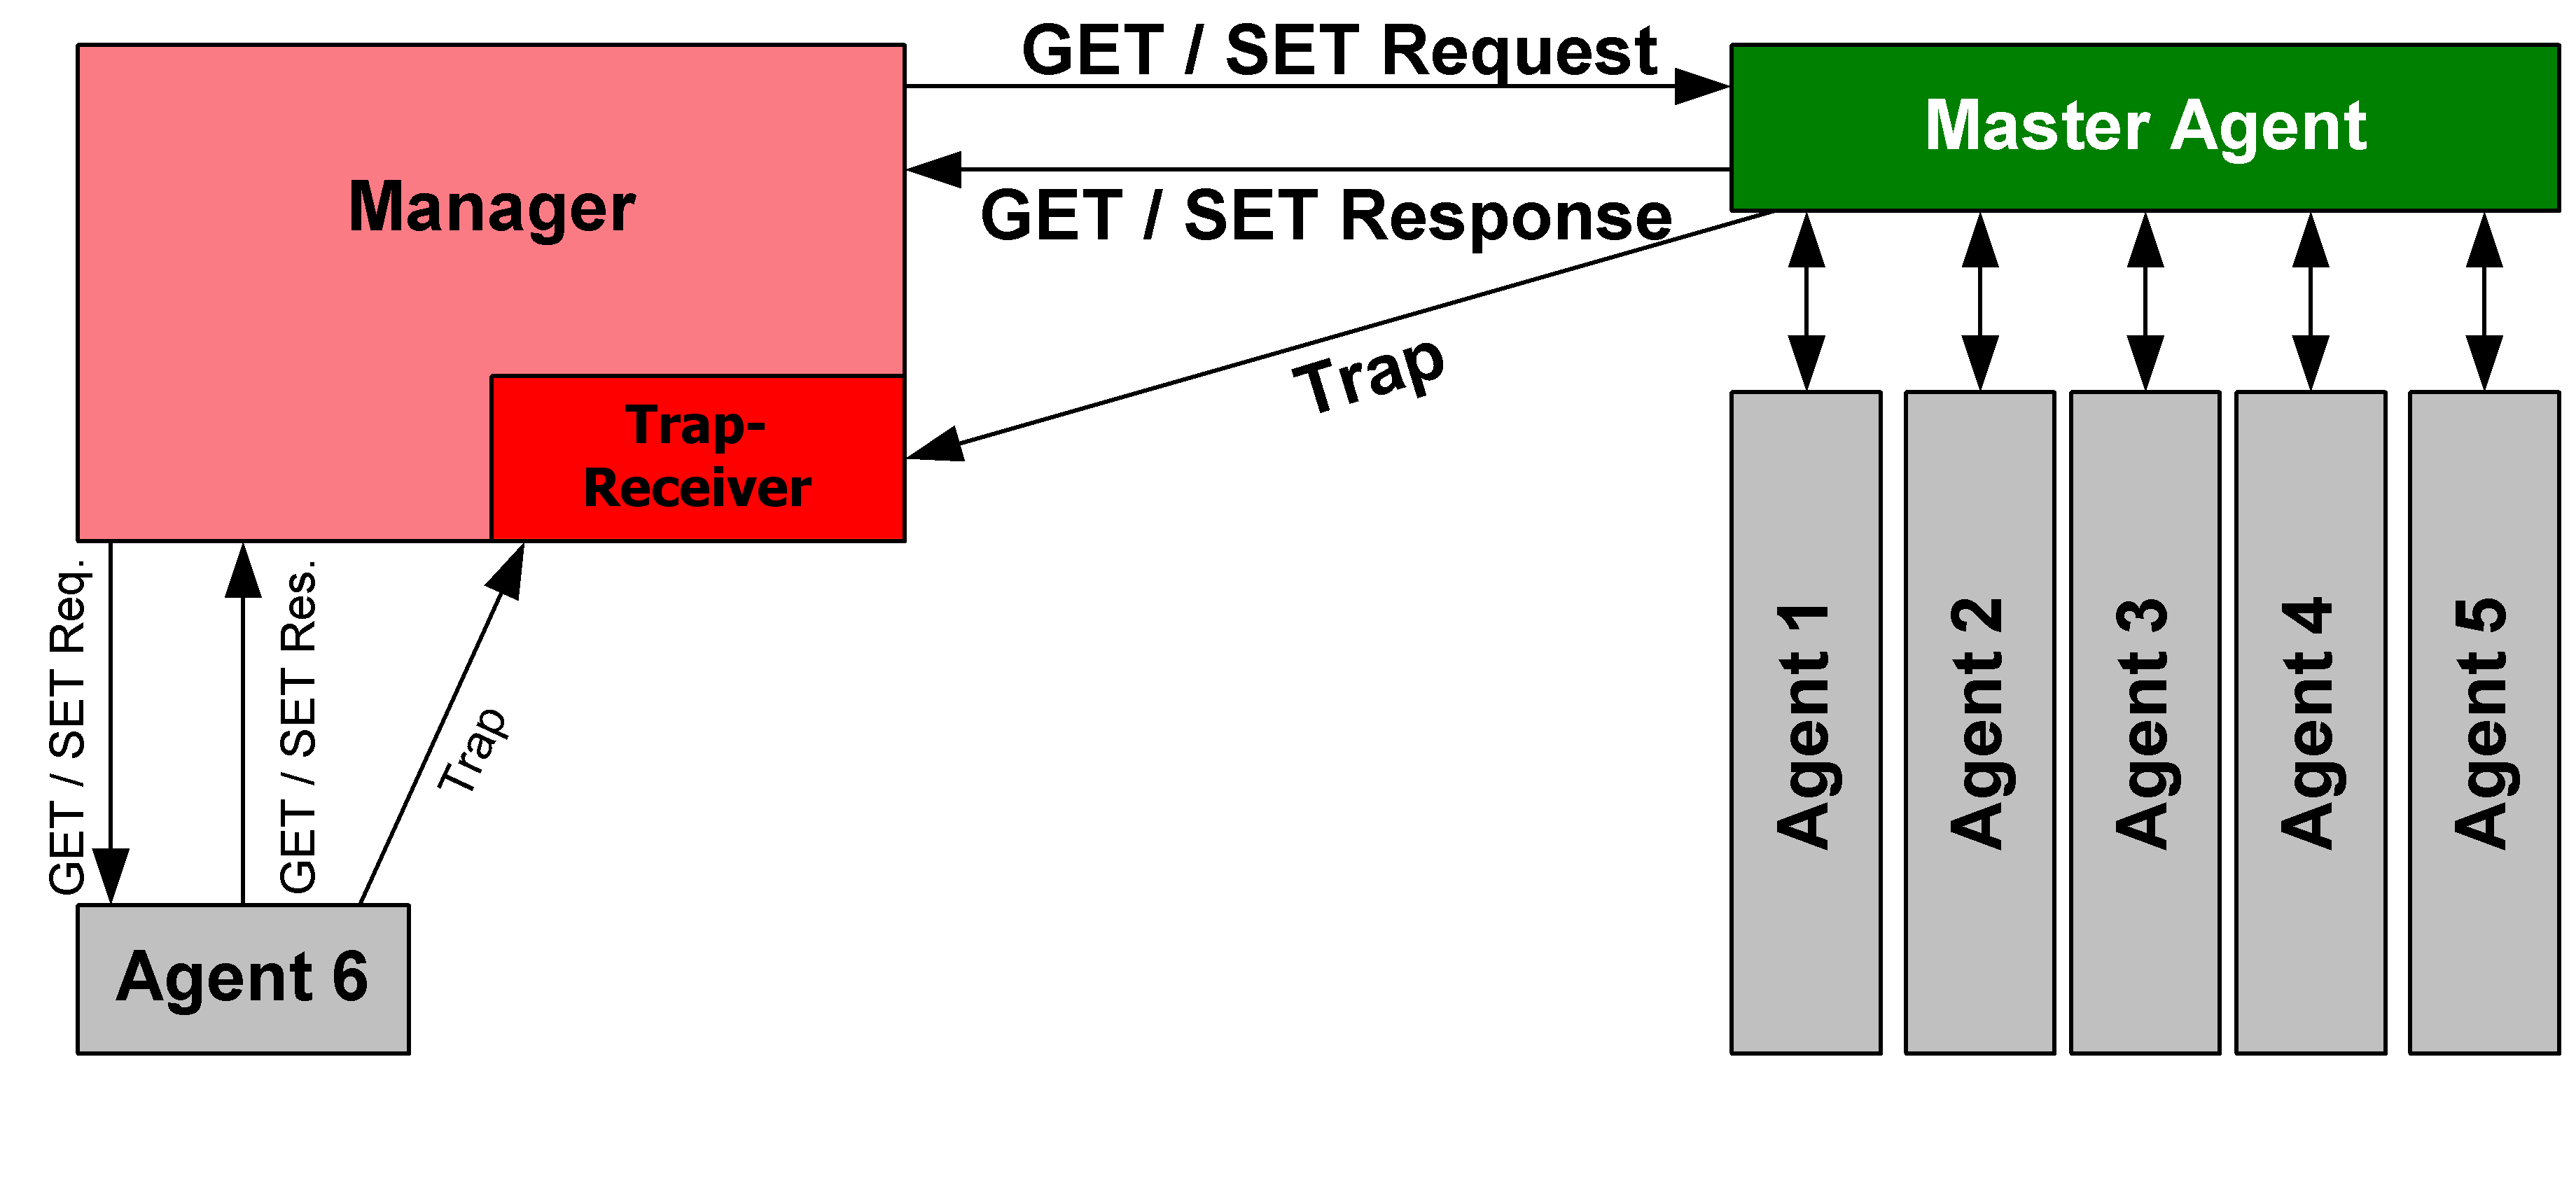
The relationship relies on a pull-and-push dynamic. Most of the time, the manager plays the active role. SNMP managers send polling requests to agents using UDP port 161. It is the network equivalent of a supervisor walking the factory floor every five minutes, asking each machine, "What is your current CPU load? How much traffic just crossed your primary interface?"
However, emergencies cannot wait for the next polling cycle. If a power supply fails, the agent must speak up immediately.
- An SNMP Trap is an unsolicited alert sent by an agent to a manager to report a specific event. SNMP agents send trap messages to the manager using UDP port 162.
- Because Traps are fire-and-forget, there is a risk they get lost in transit. To solve this, we use an SNMP Inform, which is an alert sent by an agent that requires an acknowledgment receipt from the SNMP manager. If the agent does not receive the receipt, it will resend the Inform.
Speaking the Language: MIBs and OIDs
When the SNMP manager asks an agent for its CPU temperature, how does it know precisely what to ask for? It uses a standardized dictionary.
MIB stands for Management Information Base. A MIB is a hierarchical database used by SNMP to define managed objects and variables on a device. Think of the MIB as a massive filing cabinet. Inside this cabinet, every possible metric has a specific, numerical address.
OID stands for Object Identifier. An OID is a unique string of numbers used within a MIB to identify a specific variable or characteristic of a managed device (for example, 1.3.6.1.2.1.2.2.1.10.1 might point directly to the incoming byte count of interface 1). When the manager queries the agent, it asks for the specific OID.
Security and Evolution: SNMP Versions
Because SNMP allows administrators not just to view device health but to alter device configurations, securing this protocol is paramount. Historically, this was a massive vulnerability.
- SNMPv1 is the original version of SNMP and transmits all management data in plaintext. Anyone with a packet sniffer could read the traffic.
- SNMPv2c introduced community string-based authentication. A community string acts like a rudimentary password. However, a fatal flaw remained: SNMPv2c transmits all management data in plaintext, meaning those "passwords" were easily intercepted.
- SNMPv3 solved this crisis by providing robust cryptographic security features for network management. Today, SNMPv3 supports message integrity, authentication, and encryption, rendering it the only version acceptable in modern enterprise environments.
When configuring access—even in v3—administrators assign distinct privilege levels:
- A read-only (RO) SNMP community string allows a manager to view device configuration and telemetry without making changes.
- A read-write (RW) SNMP community string allows a manager to actually modify device configurations remotely. Compromising an RW string gives an attacker full control over the network hardware.
SNMP tells you how the device is doing. It does not tell you exactly what the users are doing. To understand the actual data traversing your cables, we must look at the traffic itself using two distinct paradigms: packet capture and flow data analysis.
Packet Capture and Protocol Analyzers
Packet capture involves intercepting and logging raw network traffic passing over a digital network segment.
This is the equivalent of opening the mail and reading the letters. To do this, administrators use a protocol analyzer, which is a software tool used to perform packet capture and inspect packet payloads.
- Wireshark is a graphical protocol analyzer widely used for packet capture, famous for color-coding traffic and allowing easy visual inspection of TCP handshakes and application data.
- tcpdump is a common command-line packet capture utility, ubiquitous in Linux and UNIX-like environments for quick, lightweight captures directly from a server terminal.
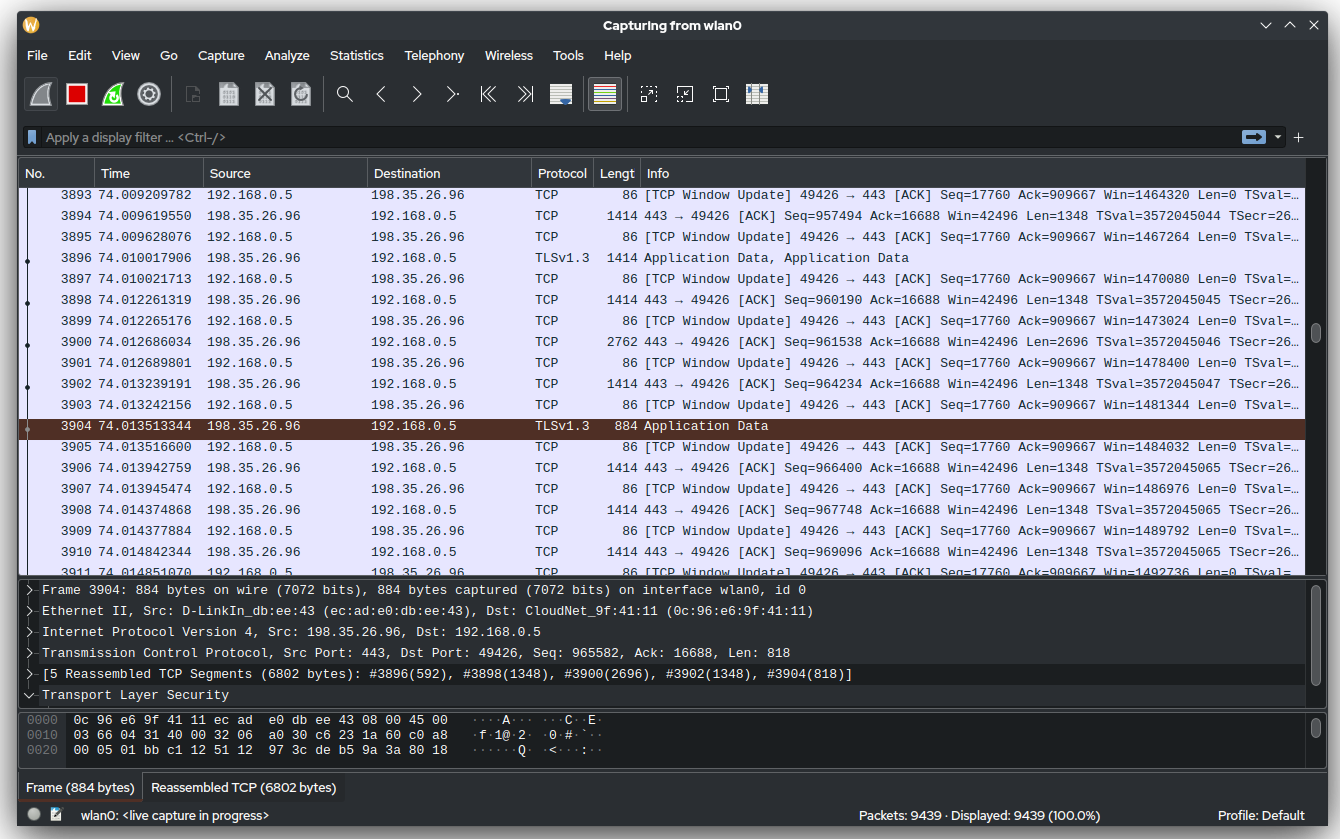
Capturing everything is called full packet capture, and it provides deep payload visibility for troubleshooting complex application errors or investigating malware payloads. However, this level of detail comes at a steep cost: full packet capture requires significant storage capacity and processing power. Recording a 10 Gbps backbone for even a few hours generates terabytes of data.
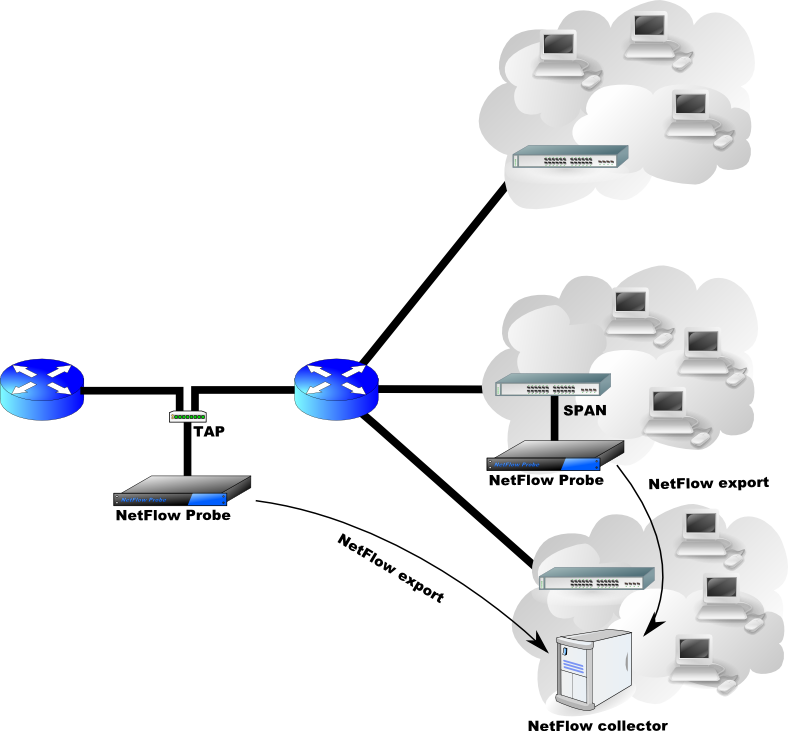
To capture this traffic without interrupting the live network, we use a port mirror, which copies network packets from one switch port to a different switch port connected to a monitoring device. In Cisco environments, this is commonly referred to as SPAN (Switched Port Analyzer), which is Cisco's technology implementation of port mirroring.
Flow Data Analysis
If packet capture is opening the mail, flow data analysis is simply reading the outside of the envelope and recording the postage weight. It records statistical metadata about network communications rather than capturing actual packet payloads. You learn the source IP, destination IP, port numbers, and total bytes transferred, but you do not see the actual data.
Because we are only recording the metadata of the conversation, flow data collection consumes significantly less storage and bandwidth compared to full packet captures. This makes it feasible to monitor traffic across the entire enterprise 24/7.
Several protocols drive flow analysis:
- NetFlow: A network protocol developed by Cisco for collecting IP traffic flow information.
- IPFIX: The IETF open standard protocol based on Cisco NetFlow version 9. (If you are not using Cisco gear, you are likely using IPFIX).
- sFlow: A statistical sampling technology used to capture flow data from network devices. Instead of tracking every single flow, sFlow captures 1 out of every N packets, providing a mathematically accurate picture of high-volume traffic with minimal CPU overhead.
Once you are gathering SNMP metrics and flow data, you will quickly be overwhelmed by the sheer volume of information. A sudden spike in traffic might be a data exfiltration attack, or it might just be the routine Tuesday night backup. How do you know the difference?
You must define "normal."
A network baseline establishes a normal profile of network performance and traffic volume under typical operational conditions. By letting your monitoring tools observe the network for several weeks, they learn the natural rhythms of the business—the morning logon rush, the midday lull, the weekend quiet.
Once a baseline is established, you can implement baseline anomaly alerting. This mechanism triggers notifications when network behavior deviates significantly from established historical norms. Instead of setting a rigid, arbitrary threshold (e.g., "Alert me if bandwidth exceeds 500 Mbps"), the system intelligently flags an event if a user who normally downloads 50 MB a day suddenly attempts to download 50 GB at 3:00 AM.
Every device on your network—servers, routers, switches, firewalls—generates its own internal diary of events. If a troubleshooting scenario requires you to log into ten different devices individually to read their text files, the trail will go cold before you find the problem.
Log aggregation solves this by consolidating event logs from multiple network devices into a single central repository.
The undisputed champion of this process is Syslog, a standard protocol used for sending system log and event messages to a dedicated server. The Syslog protocol typically operates on UDP port 514. Devices stream their logs over the network to a syslog collector, which is a centralized server designed specifically to receive, store, and organize syslog messages.
The Anatomy of a Syslog Message
A syslog message is highly structured so the collector can categorize it. Two vital pieces of metadata accompany every syslog entry:
- Facility code: A number indicating the software type or system component that generated the message (e.g., the kernel, the mail system, or an authorization process).
- Severity level: A number indicating the importance or urgency of the event.
Syslog severity levels range numerically from 0 to 7. Lower numbers indicate higher severity. A competent network professional must memorize this scale, but pay special attention to the extremes:
| Level | Name | Description |
|---|---|---|
| 0 | Emergency | The most critical level. Represents an Emergency where the system is completely unusable (e.g., a catastrophic hardware failure or total network collapse). |
| 1 | Alert | Represents a condition requiring immediate administrative action to prevent system loss. |
| ... | ... | Levels 2 through 6 cover Critical, Error, Warning, Notice, and Informational events. |
| 7 | Debug | The lowest priority. Represents a Debug message utilized solely for detailed troubleshooting, usually turned off during normal operations to save storage. |
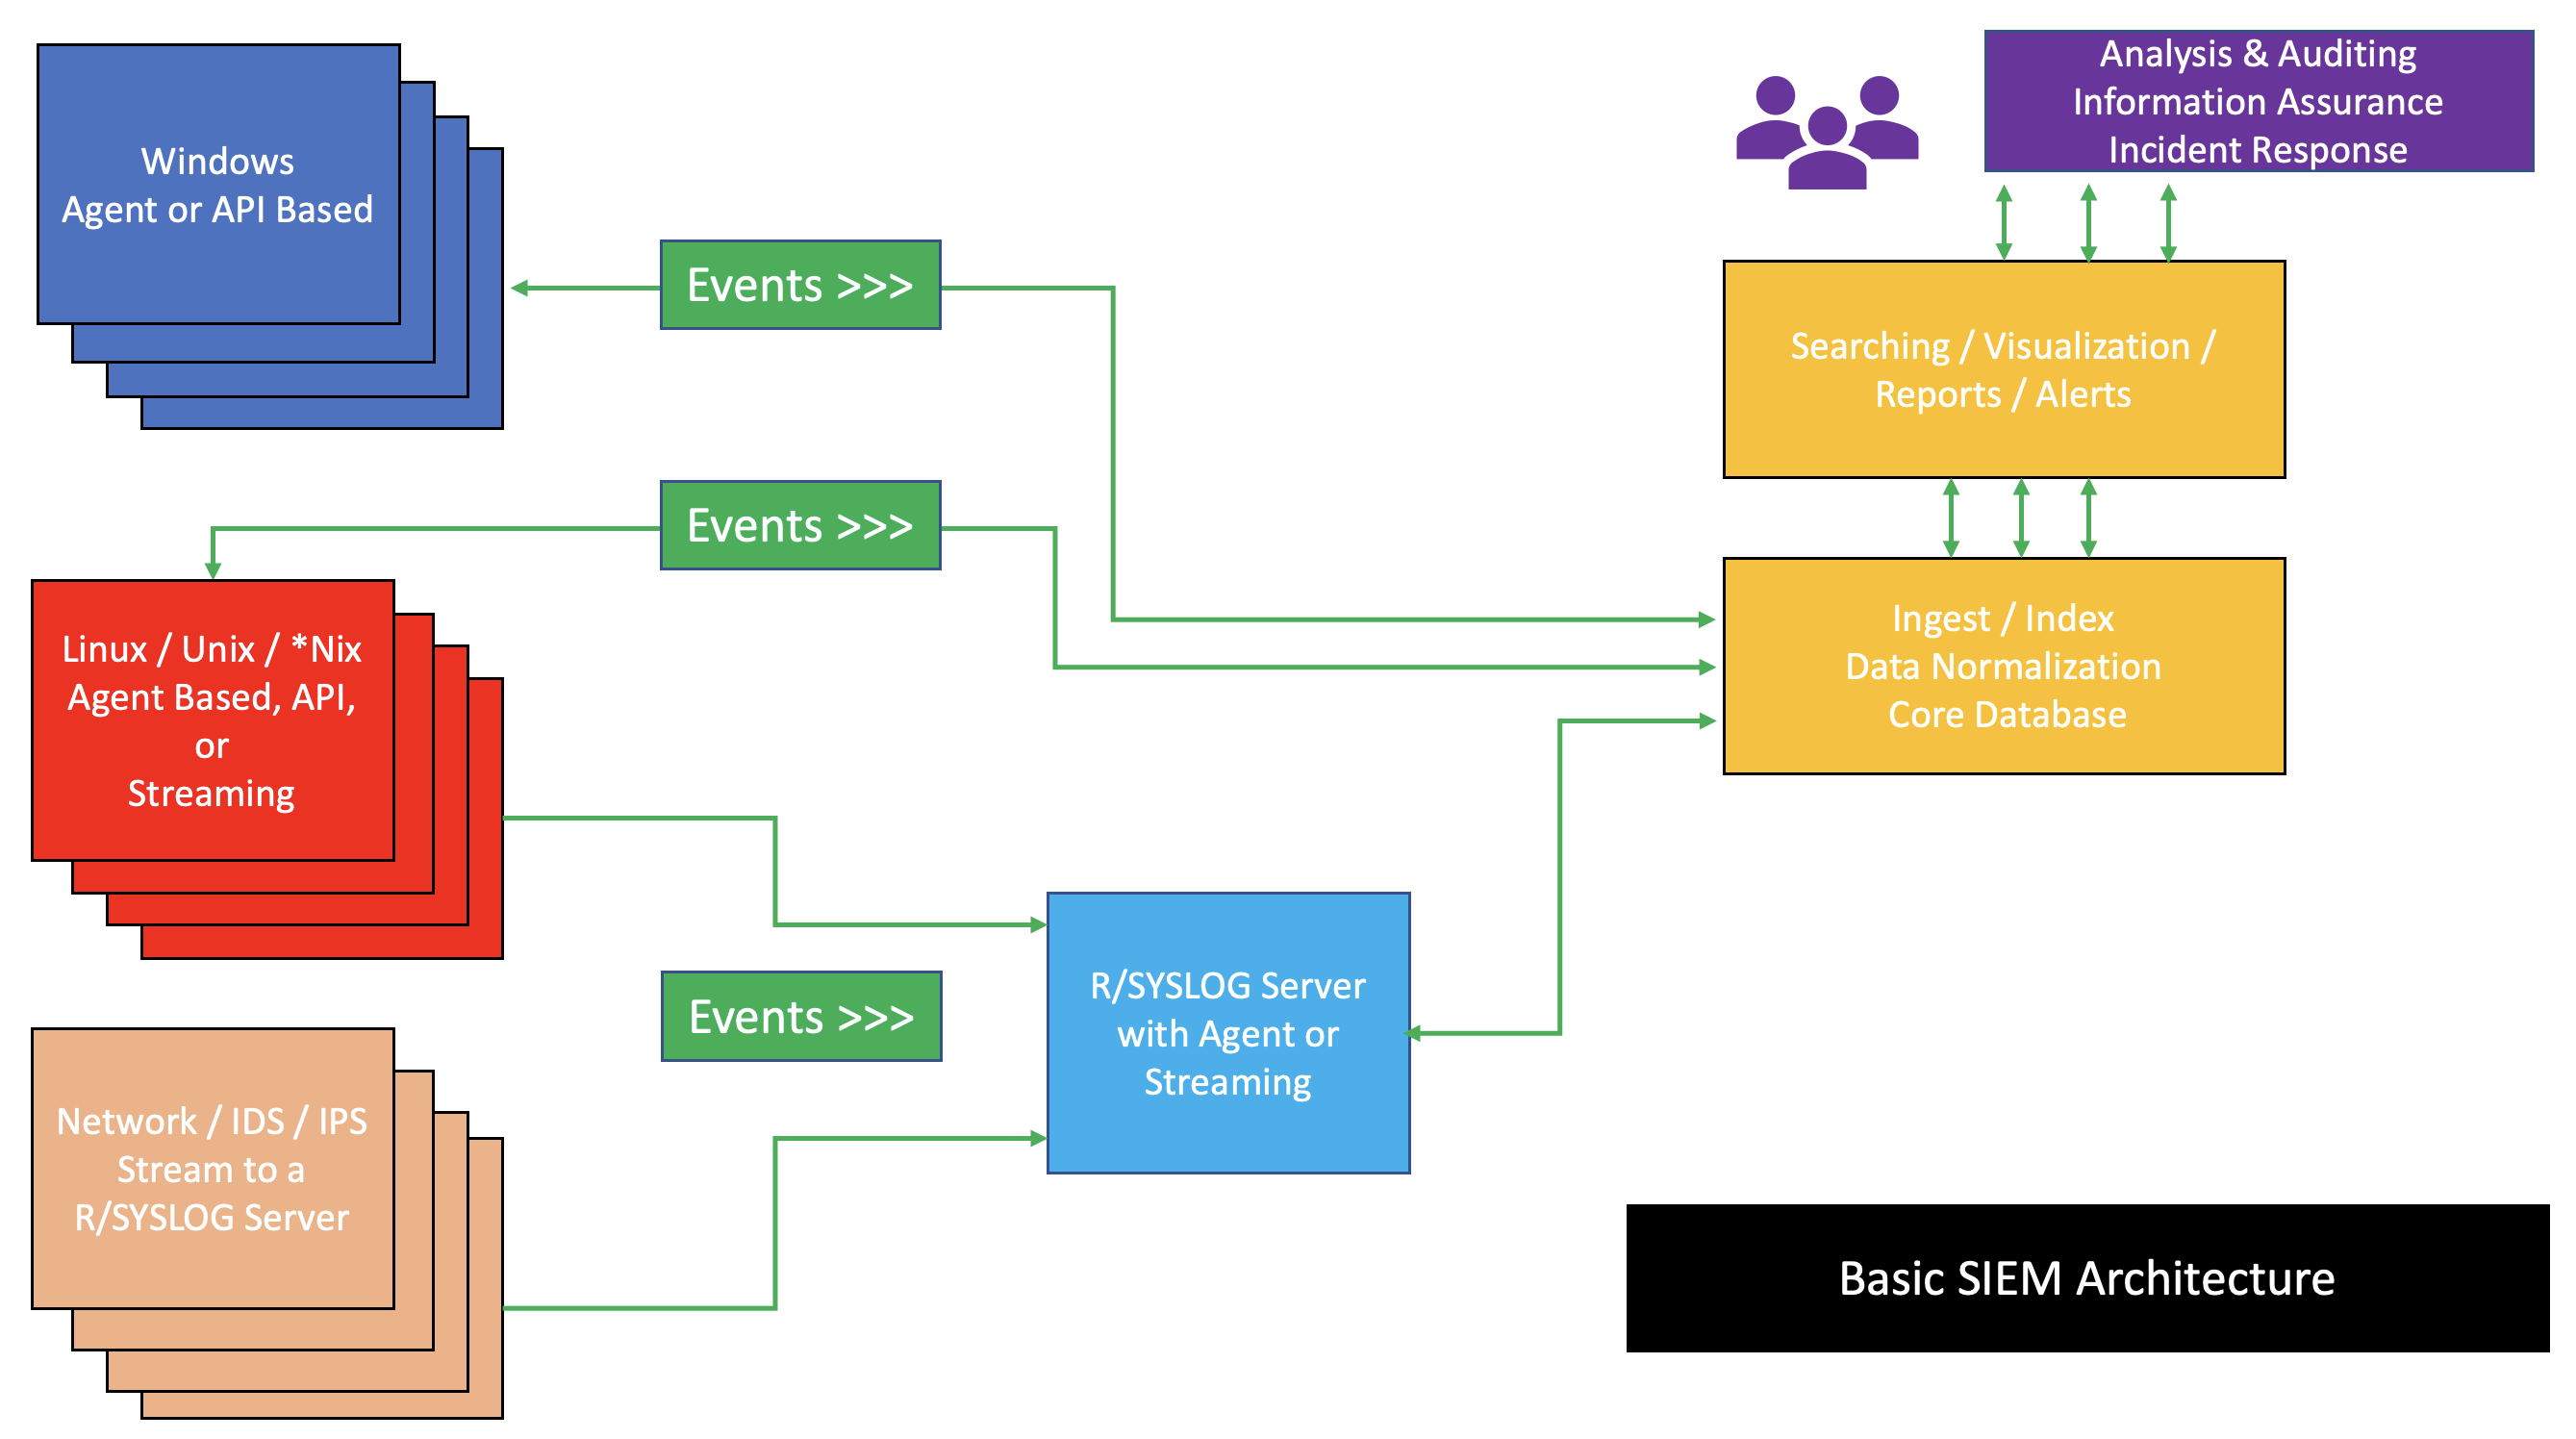
Aggregating logs into a syslog collector is a massive step forward, but logs are essentially raw text. To actively defend the network, we need an analytical engine capable of reading those logs, cross-referencing them with flow data, and spotting attacks.
SIEM stands for Security Information and Event Management. A SIEM platform collects, aggregates, and analyzes log data from across the enterprise network to identify security threats.
The true power of a SIEM lies in SIEM correlation, which involves linking multiple related events from different network sources to detect complex attack patterns. For example, if a firewall logs a blocked port scan from an external IP, and a minute later an internal server logs a successful login from that same external IP, the SIEM correlates those two distinct events into a critical security alert: a perimeter breach.
The Critical Dependency: Time Synchronization
For SIEM correlation to work, the timeline of events must be perfectly sequenced. If your firewall's internal clock is five minutes faster than your domain controller's clock, the SIEM might think an internal server was accessed before the firewall was breached, completely breaking the correlation logic.
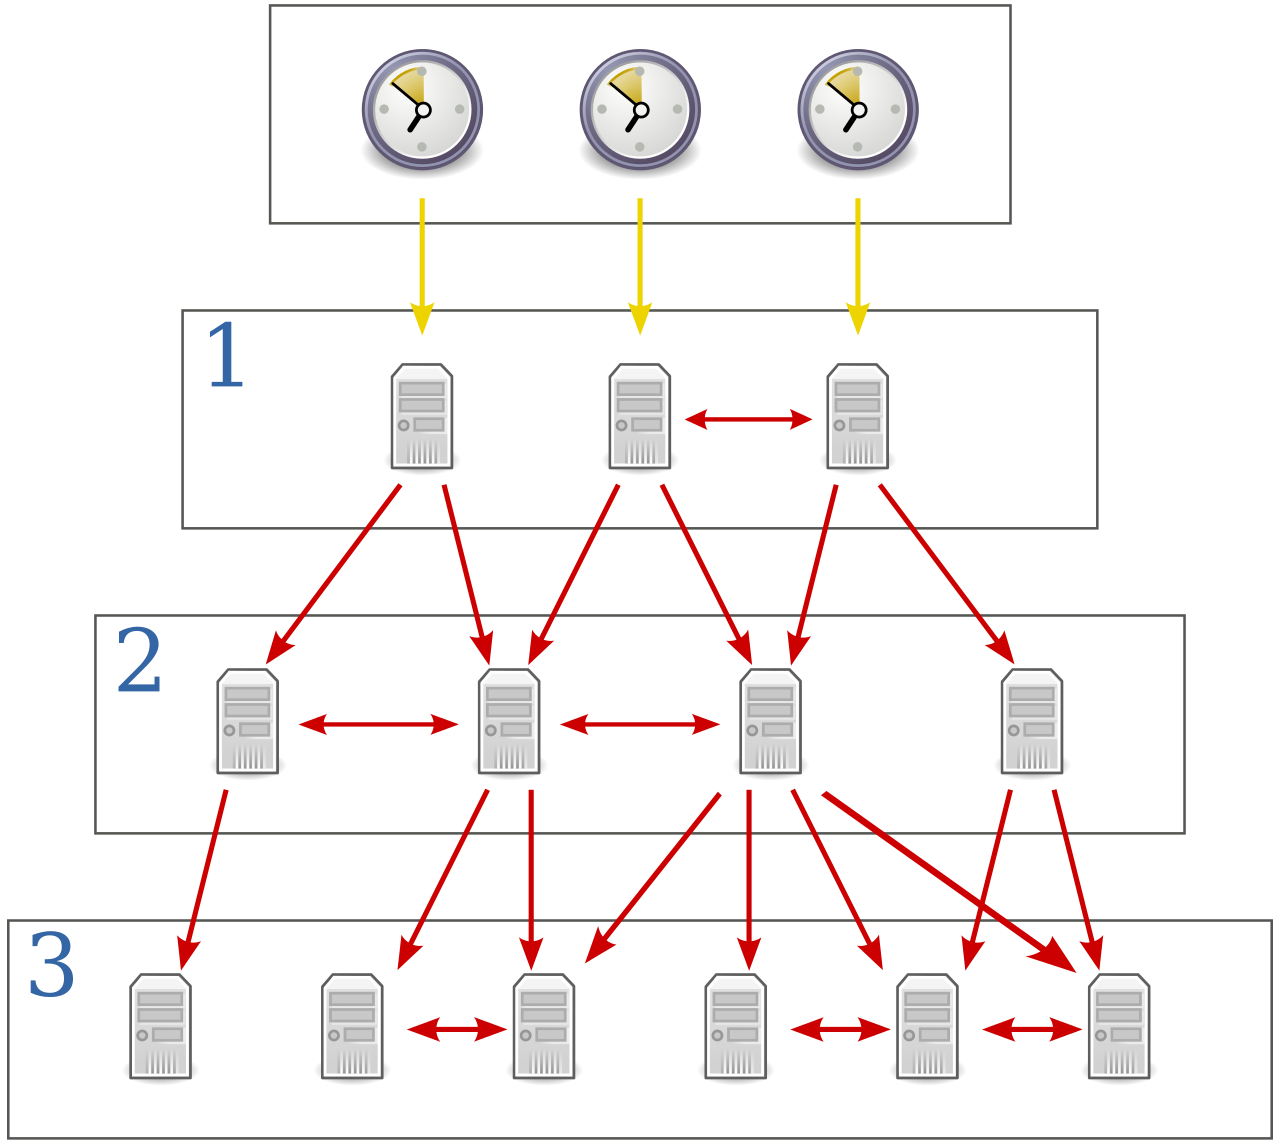
Accurate time synchronization is critical for proper log aggregation and SIEM event correlation.
To achieve this, Network Time Protocol (NTP) is utilized to ensure system clocks are strictly synchronized across all network devices down to the millisecond. By pointing every router, switch, server, and SIEM appliance to the same highly accurate NTP server, you guarantee that when an anomaly occurs, the digital forensics tell a clear, indisputable story.
When SNMP telemetry, flow data, baseline anomaly alerts, and centralized SIEM logs all share the exact same temporal heartbeat, the invisible factory of your network is finally brought out of the darkness and into the light.