Interpreting Graphs and Statistics
Not sure you’re ready?
Take the ~3-minute readiness diagnostic and see where you stand.
A patient's electronic health record is not merely a digital filing cabinet; it is a dense landscape of raw numerical data. Over a single 12-hour shift, a nurse logs dozens of fluctuating vital signs, categorizes fluid outputs, and tracks medication dosages against time. Interpreting this data quickly and accurately is what separates adequate care from exceptional intervention. The ATI TEAS 7 tests your ability to navigate this mathematical landscape by analyzing visual data displays and computing descriptive statistics. These fundamental tools allow us to tame chaotic numbers, revealing the underlying physiological realities of the patients in our care.
Before we can interpret clinical data, we must understand the framework upon which it is built. A standard graph provides a spatial map of relationships.
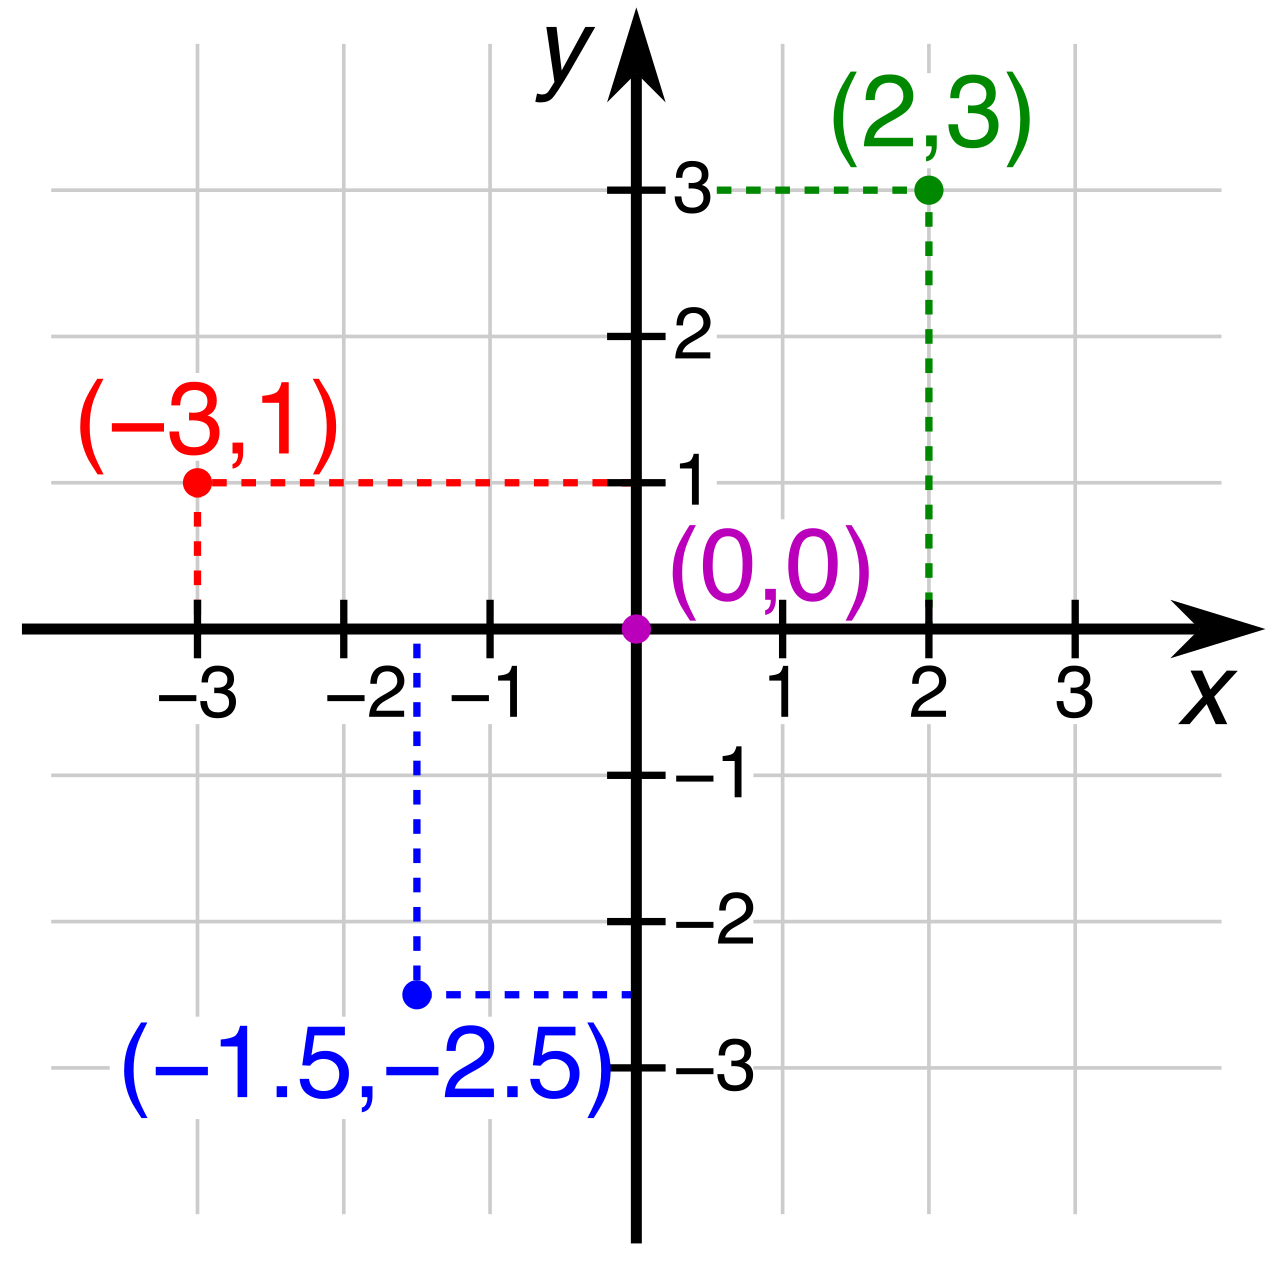
The horizontal x-axis of a standard graph typically represents the independent variable. In the medical sciences, this is often time or a controlled dosage—the variable that marches forward regardless of other conditions. Conversely, the vertical y-axis of a standard graph typically represents the dependent variable, such as a patient's core temperature or blood pressure, which changes in response to the independent variable.
Because clinical data is rarely limited to a single metric, graphs frequently employ distinct shapes, dashed lines, or varied shading. A graph legend explains the specific visual symbols and colors used within a data display, acting as the vital translation key for the reader.
Data comes in different forms—some categorical, some continuous. The type of data you collect dictates the type of graph you must use to display it.
Categorical Data: Bar and Circle Graphs
Imagine you are tallying the number of patients admitted to different hospital wards: Cardiology, Oncology, and Neurology. These are distinct categories, not a continuous sequence.
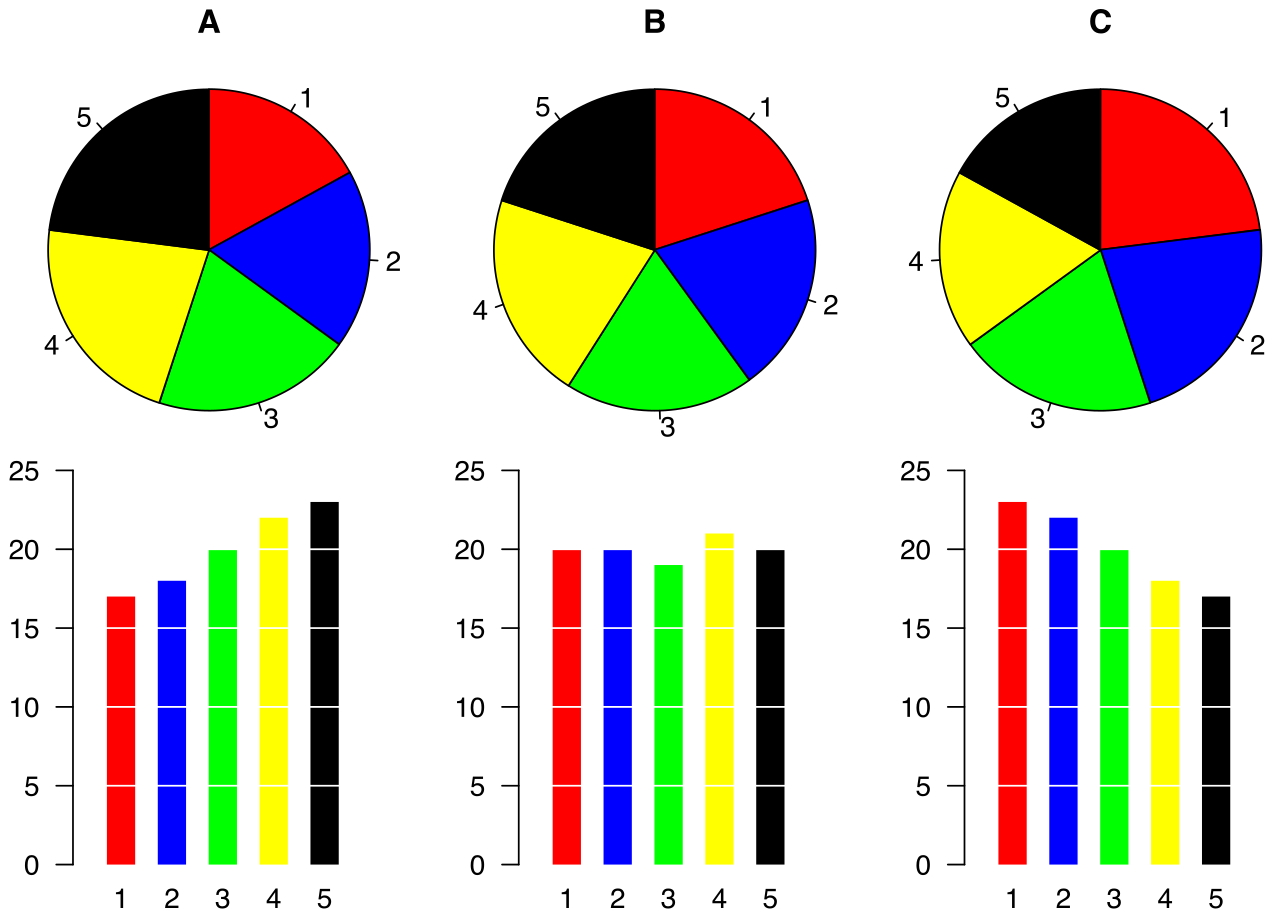
To visualize this, we use a bar graph. A bar graph uses rectangular bars to represent categorical data. The visual rule governing it is elegantly simple: the length of a bar in a bar graph is directly proportional to the represented value. A bar twice as long simply means twice as many patients.
If, instead, you want to show what proportion of the total daily hospital admissions went to each ward, you would use a circle graph (pie chart). A circle graph displays distinct data categories as proportional slices of a whole. Because it represents an unbroken whole, two mathematical constraints rigidly govern it:
- The combined percentages of all categories in a circle graph must always equal 100 percent.
- Geometrically, a complete circle graph encompasses exactly 360 degrees.
Continuous Data: Line Graphs and Histograms
When data flows continuously, our graphs must reflect that unbroken movement.
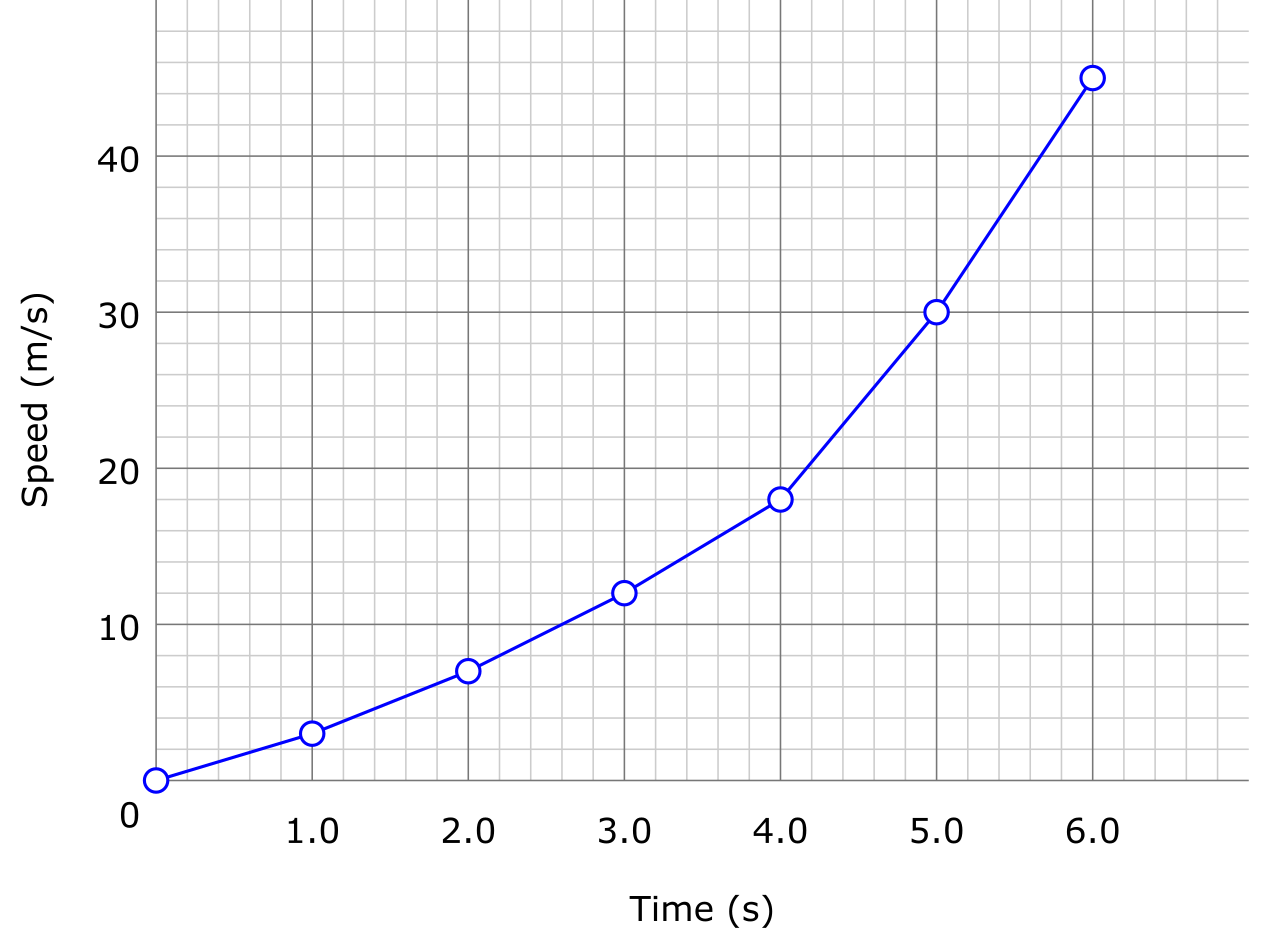
A line graph displays numerical data that changes continuously over a period of time. When you chart a patient's fluctuating fever over a 48-hour period, the line graph visually connects the dots, allowing you to instantly recognize the trajectory of the illness.
Now, suppose you are analyzing the ages of 500 patients in a clinic, grouping them into age brackets (0-9, 10-19, 20-29). Here, you use a histogram. A histogram displays the frequency of numerical data organized into continuous sequential intervals. Unlike the separated bars of a standard bar graph, the rectangular bars in a histogram touch each other to denote continuous numerical data intervals. The lack of gaps signifies that the underlying variable (age) flows without interruption.
Finding Relationships: Scatter Plots
Sometimes, we want to know if two different variables interact. Does a higher dosage of a specific painkiller correlate with a lower reported pain score?
To answer this, we utilize a scatter plot. A scatter plot graphs paired numerical values of two variables on a Cartesian coordinate plane. By plotting each patient as a single dot representing both their dosage (x-axis) and their pain score (y-axis), a scatter plot reveals the specific type of correlation existing between two quantitative variables.
- A positive correlation indicates that both graphed variables increase simultaneously. (e.g., as caloric intake increases, body weight increases).
- A negative correlation indicates that one graphed variable increases while the second variable decreases. (e.g., as cardiovascular fitness increases, resting heart rate decreases).
Because scatter plots often look like a chaotic cloud of dots, statisticians use a mathematical overlay to find the signal in the noise: a trend line on a scatter plot indicates the general mathematical direction of the graphed data points.
Once we have our data, we often need a single summary number to represent the "typical" patient. This is called the measure of central tendency. There are three primary ways to calculate it.
1. The Mean (The Average)
The mean is computed by adding all values in a dataset and dividing the sum by the total number of values. It utilizes every single piece of data available. Because of this mathematical inclusivity, the mean serves as the most precise measure of central tendency for perfectly symmetrical datasets lacking outliers.
2. The Median (The Middle)
The median is the exact middle numerical value of a dataset arranged in strict numerical order. It simply lines the data up from smallest to largest and points to the center.
If you have an even number of data points, there is no single middle number. In that case, the median of an even number of values is computed by averaging the two middlemost numbers.
3. The Mode (The Most Frequent)
The mode is the specific individual data value appearing most frequently within a single dataset. Unlike the mean or median, the mode has some unique behaviors:
- A dataset can contain multiple distinct modes simultaneously (if two different values tie for the highest frequency, the dataset is "bimodal").
- Conversely, a dataset containing strictly uniformly occurring values possesses no mathematical mode.
Crucially, the mode serves as the sole applicable measure of central tendency for nominal categorical data. If you are looking at blood types (A, B, AB, O), you cannot mathematically calculate a "mean" or "median" blood type. You can only identify the mode—the blood type that occurs most often.
Knowing the center of your data is only half the battle; you must also know how widely scattered your data is. Are all your patients around age 40, or do they range from newborns to nonagenarians?
To determine this, we calculate the range. The range quantifies the total numerical spread or width of a statistical dataset. Mathematically, the range is computed by subtracting the minimum dataset value from the maximum dataset value.
Here is where clinical statistics requires critical thinking. Datasets are rarely perfect. Occasionally, you encounter an anomaly.
An outlier is a data point abnormally distant from the central cluster of overall dataset values. Imagine five patients in a waiting room with resting heart rates of 70, 72, 74, 75, and 190 bpm. That 190 bpm is a massive outlier.
Outliers cause chaos in basic calculations:
- The calculated range of a dataset exhibits high statistical sensitivity to the presence of outliers. (In our example, the range jumps from 5 to 120 solely because of one patient).
- An outlier mathematically skews the mean of a dataset significantly toward the outlier value. The mean heart rate of that waiting room becomes 96.2 bpm—a number that represents none of the patients accurately.
Because the mean is so easily hijacked by anomalies, we must rely on a different metric. The median of a dataset strongly resists the mathematical pull of extreme numerical outliers. Even with the 190 bpm patient, the median heart rate of our group remains a stable 74 bpm. Therefore, the median serves as the most accurate measure of central tendency for datasets containing extreme outliers.
Understanding Skewed Distributions
When a dataset has outliers or a heavy concentration of values on one side, it loses its bell-curve shape. A statistically skewed dataset mathematically lacks symmetry around the central measure of tendency.
Understanding how skew affects the relationship between the Mean and the Median is a heavily tested concept on the TEAS 7. Think of the "tail" of the graph as a heavy chain pulling the mean away from the median.
Right-Skewed Data: A right-skewed dataset features a long tail of data points extending toward the higher positive values. Because the extreme high values pull the mean upward like a magnet, the mathematical mean is strictly greater than the median in a right-skewed numerical dataset.
Left-Skewed Data: A left-skewed dataset features a long tail of data points extending toward the lower negative values. Because the extreme low values drag the average down, the mathematical mean is strictly less than the median in a left-skewed numerical dataset.
By mastering these rules, you will never be fooled by a deceptive average. You will know exactly when to look at a chart, identify the skew, and demand to see the median instead. In healthcare, as in statistics, context is everything.