Fundamental Analysis
Imagine evaluating the health of a complex commercial airline fleet solely by watching the planes take off and land. You might see an aircraft soaring beautifully at thirty thousand feet, but without inspecting the engine maintenance logs, the fuel reserves, and the debt owed on the airframe, you have no real idea if that plane is equipped to survive a transcontinental flight. In the securities industry, watching a stock's daily ticker tape is akin to watching the planes from the ground. To understand whether a corporation is built to weather an economic storm or destined to crash under its own weight, we must open the hood and examine its financial engine. Fundamental analysis is a method of evaluating a security to measure the intrinsic value of the underlying company. Rather than merely tracking price momentum or market sentiment, fundamental analysis dissects the foundational mechanics of a business—its revenues, debts, and cash flows—to determine what it is inherently worth.

As a registered representative, your clients will constantly ask you to separate great companies from fleeting market trends. To do this, you must master the language of business: financial statements.
To grasp a company's financial health, you must look through two different lenses. One captures a single moment frozen in time; the other captures the flow of activity over an entire season.
| Feature | The Balance Sheet | The Income Statement |
|---|---|---|
| Alternative Name | Statement of Financial Position | Profit and Loss (P&L) Statement |
| Time Measurement | A snapshot at a single specific point in time | Performance over a specific period of time |
| What it Answers | "What does the company own and owe right now?" | "How much money did the company make this quarter?" |
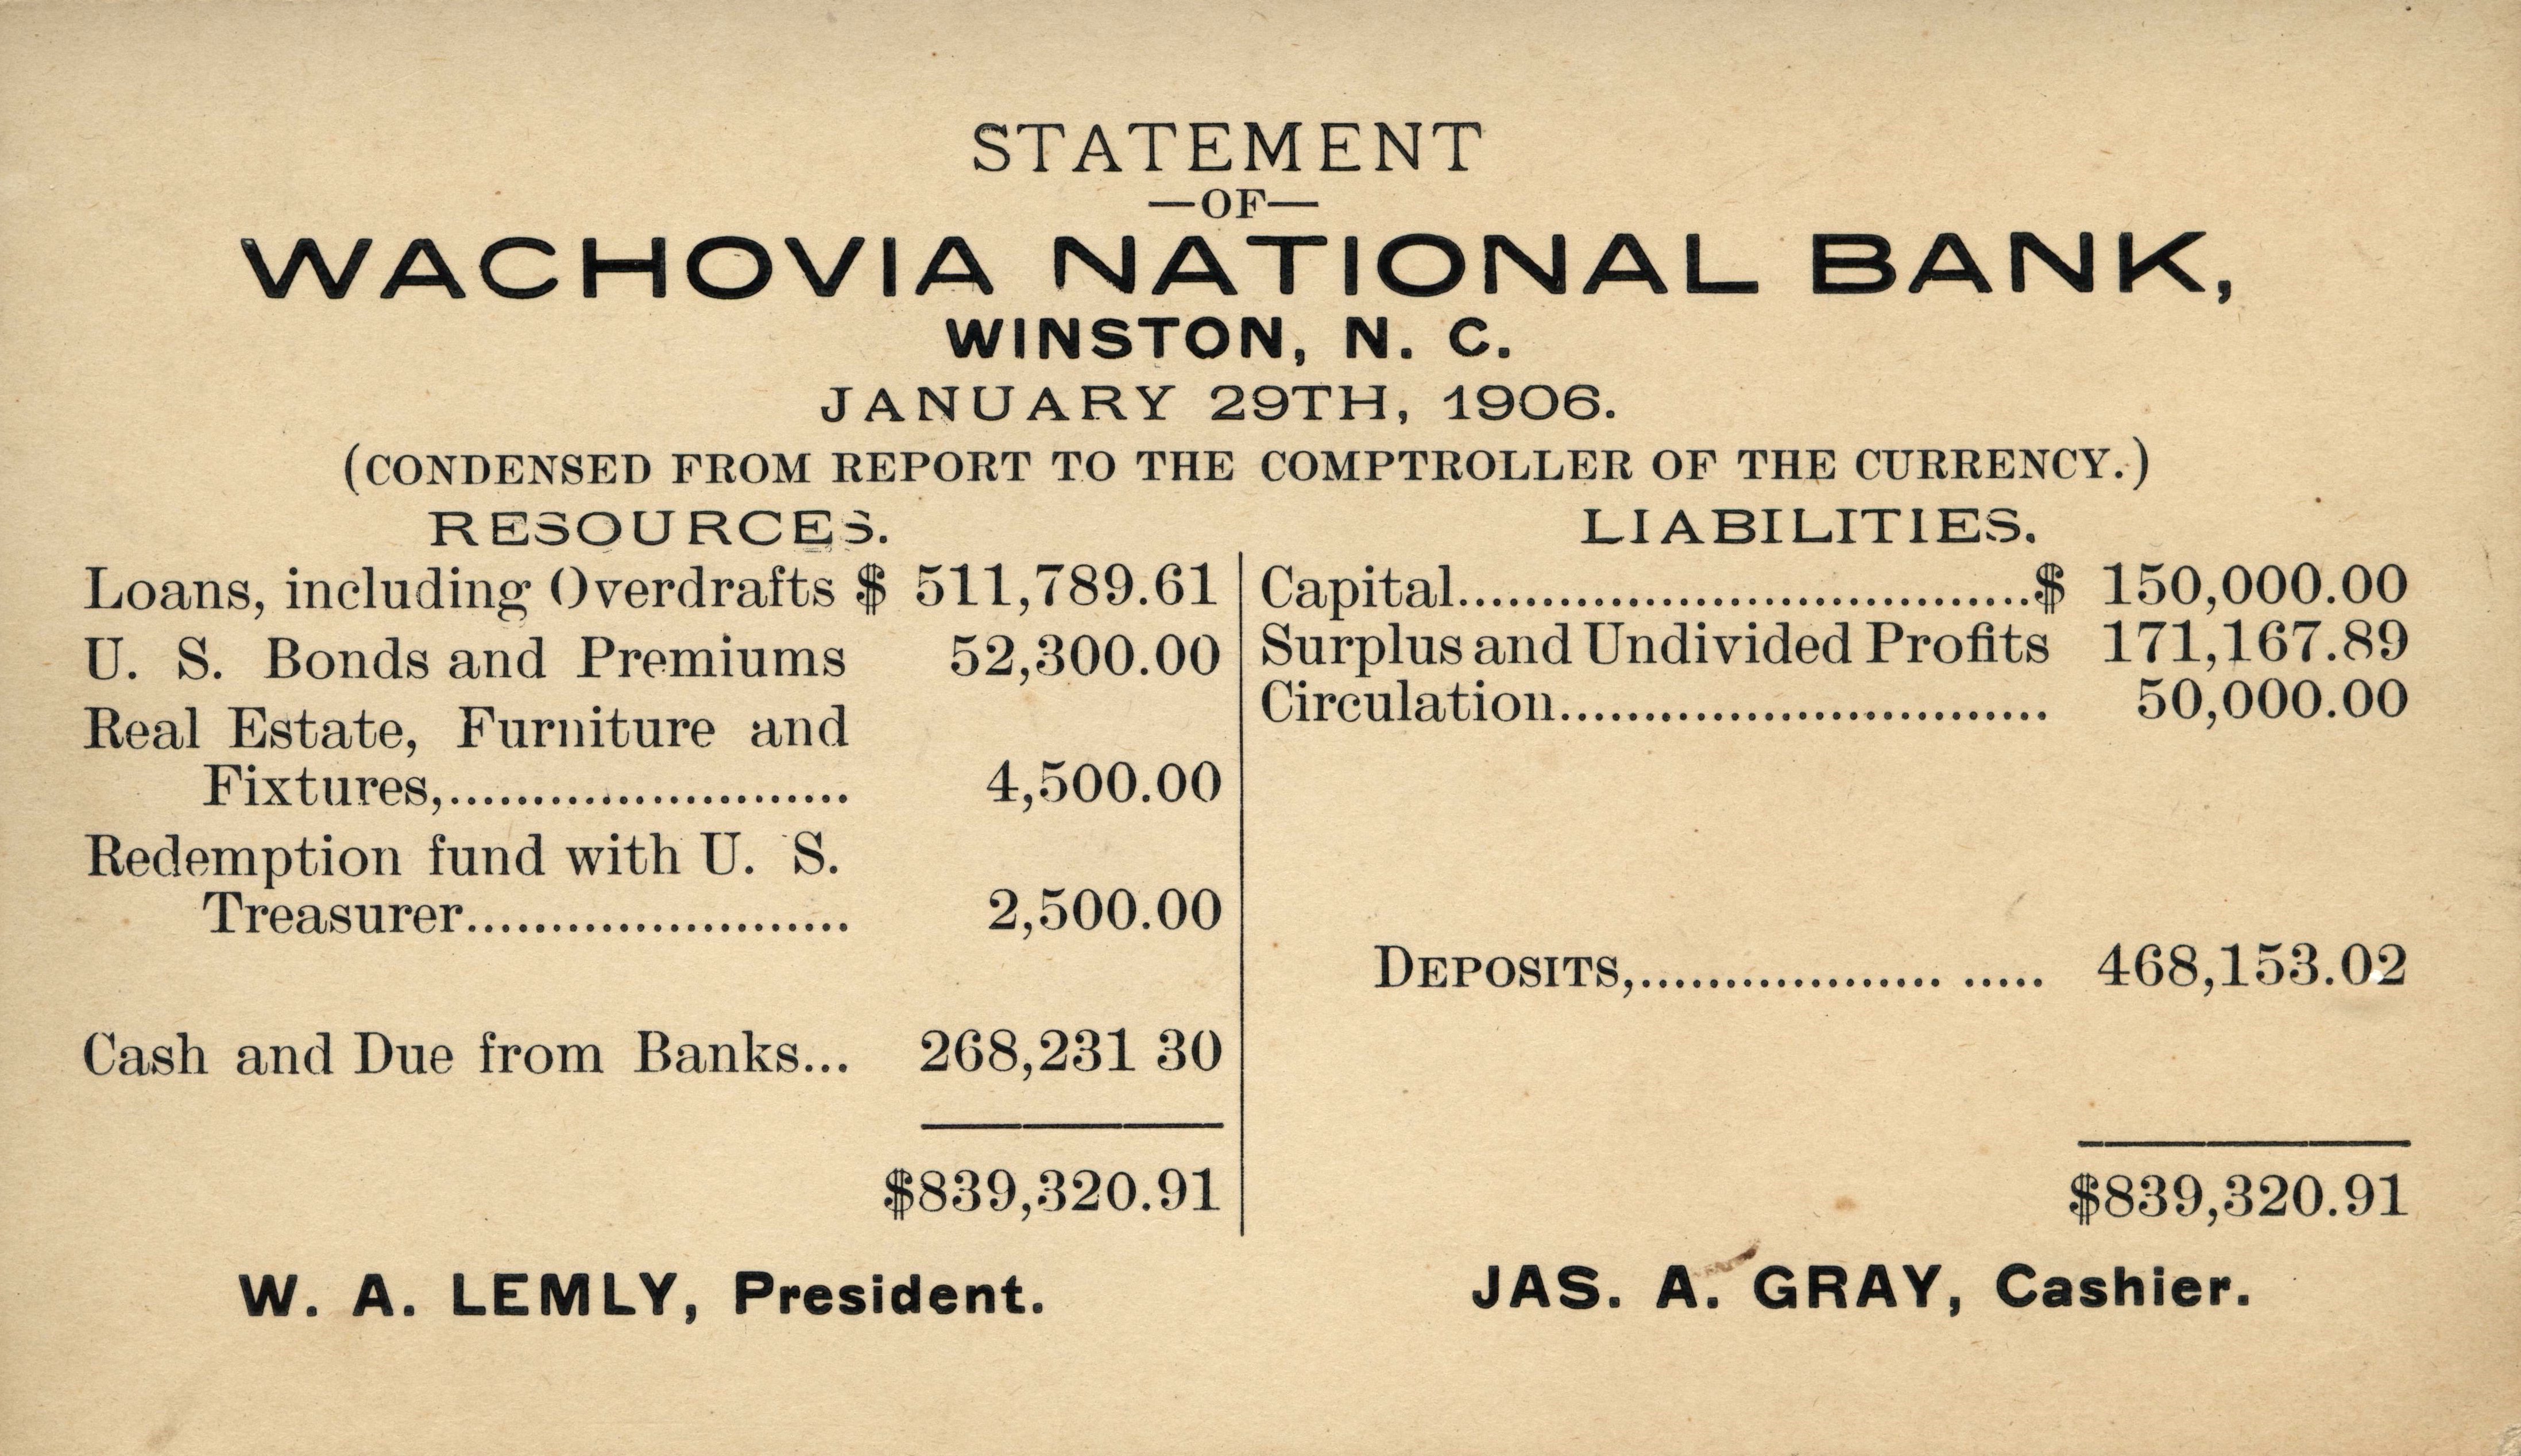
The Balance Sheet: The Anatomy of Worth
A balance sheet provides a snapshot of a company's financial position at a single specific point in time. It is also known as the statement of financial position.
Why is it called a "balance" sheet? Because of a rigid, fundamental law of double-entry accounting. The balance sheet equation dictates that total assets must exactly equal total liabilities plus shareholders' equity.
To understand this equation intuitively, imagine you buy a $500,000 house using a $400,000 mortgage and $100,000 of your own cash. The house is your asset. The mortgage is your liability. The cash you put in is your equity. The corporate balance sheet operates on the exact same logic.
- Balance sheet assets represent quantifiable resources owned by a company (factories, cash, patents, inventory).
- Balance sheet liabilities represent financial obligations owed by a company to outside parties (bank loans, accounts payable, bonds issued).
- Shareholders' equity represents the residual interest in the assets of a company after deducting all liabilities. It is the net worth that actually belongs to the owners.
When evaluating how a company funds its long-term existence, we look at its permanent capital foundation. Total capitalization consists of long-term debt plus total stockholders' equity. This represents the total pool of long-term funding the company uses to run its business.
Book Value Per Share What would happen if a company abruptly shut its doors today, sold off everything it owned, paid off all its debts, and handed the remaining cash to the stockholders? We measure this using book value per share, which represents the theoretical accounting value of a single share of common stock upon corporate liquidation.
Formula:
(Tangible Assets - Liabilities - Preferred Stock) / Outstanding Common Shares
The Income Statement: The Engine of Profitability
While the balance sheet is a photograph, the income statement is a video recording. An income statement details a company's financial performance over a specific period of time (such as a quarter or a fiscal year). Because it tracks money coming in versus money going out, the income statement is alternatively known as the profit and loss statement.
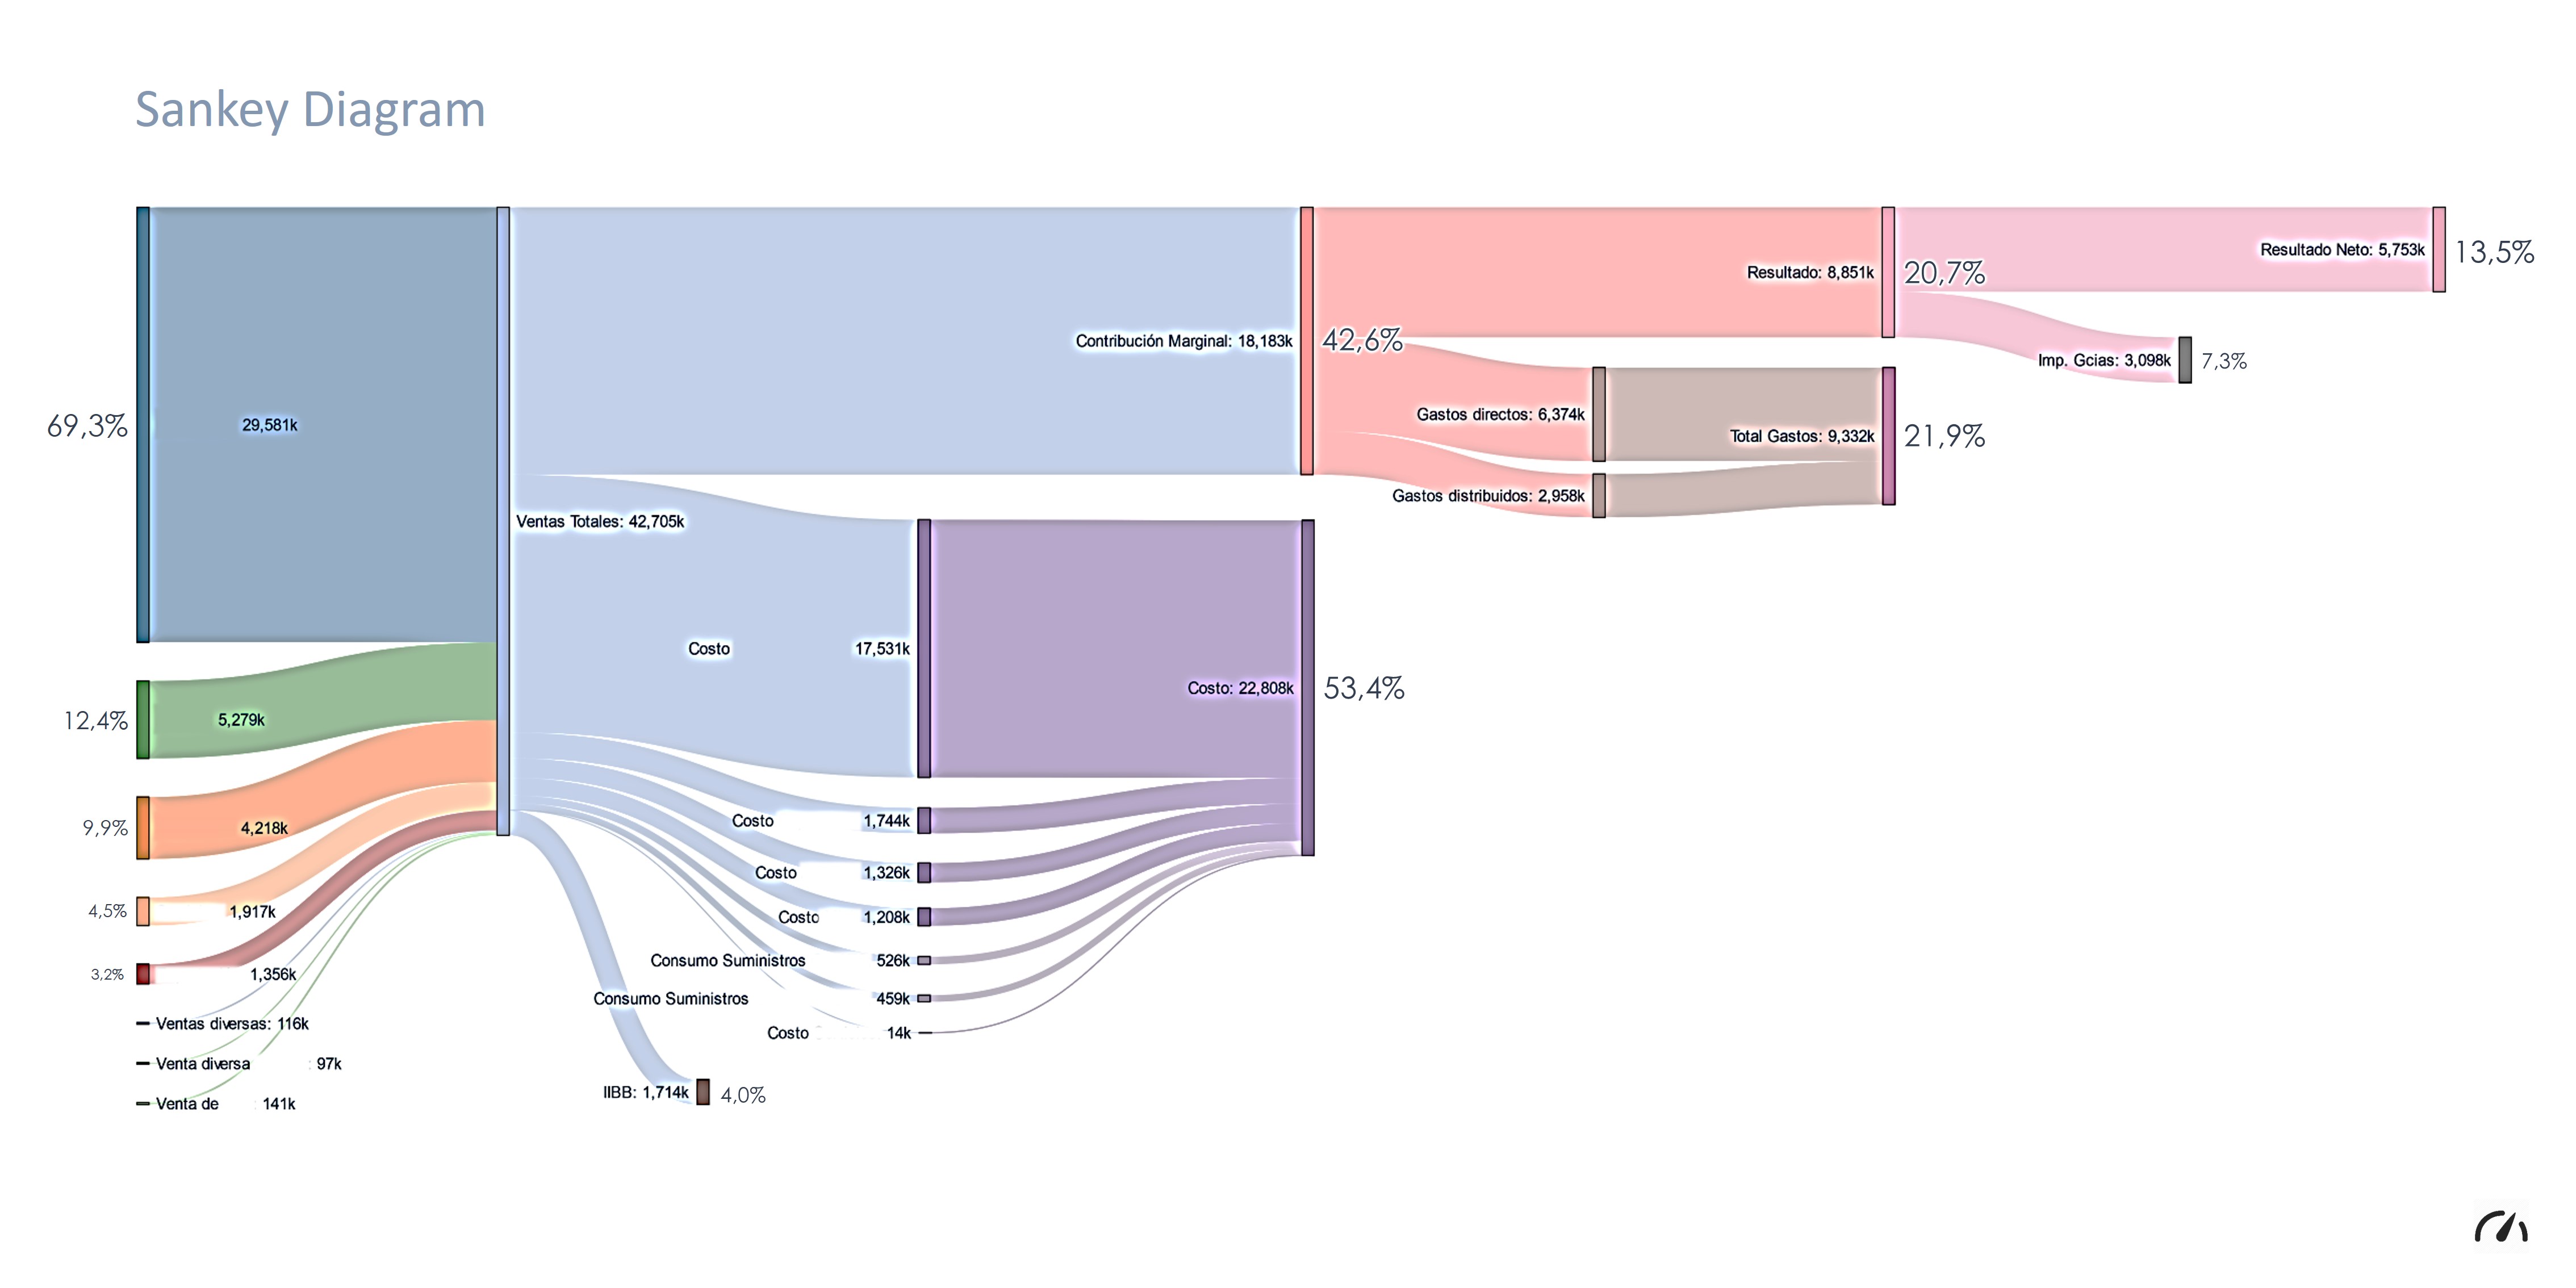
The flow of the income statement tells a story of attrition. You start at the top with total revenues (all the money brought in from sales). Then, you begin paying the bills.
- First, you deduct the direct costs of creating your product to find Gross Profit.
- Next, you deduct the day-to-day costs of running the business (like rent and salaries). Operating income equals gross profit minus operating expenses on the corporate income statement.
- Finally, after paying interest on debt and taxes to the government, you arrive at the bottom line. The income statement calculates net income by subtracting total expenses from total revenues.
What happens to that net income? The company has a choice. It can distribute the money to its shareholders as dividends, or it can keep it in the corporate vault. Retained earnings represent accumulated net income that has not been paid out to shareholders as dividends, historically reinvested back into the business.
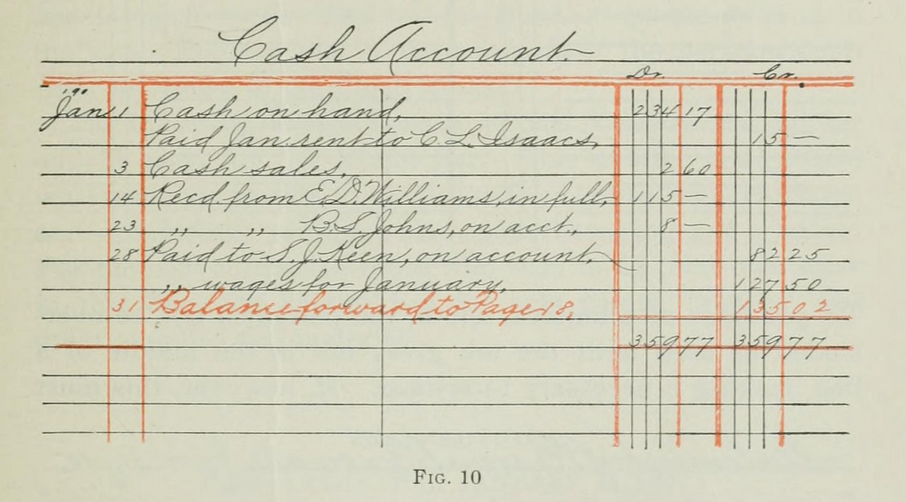
A highly profitable company can still go bankrupt if it runs out of cash on a Tuesday. In fundamental analysis, corporate liquidity refers to a company's ability to meet short-term debt obligations without raising external capital.
To measure this, we look at working capital, which measures a company's short-term financial health and operational efficiency.
Working Capital Formula:
Current Assets - Current Liabilities
To calculate this, we must define our terms strictly by their time horizons:
- Current assets include cash and other assets expected to be converted to cash within one year.
- Current liabilities are financial obligations a company expects to pay off within one year.
The Current Ratio vs. The Quick Ratio
Dollar amounts of working capital are helpful, but ratios allow us to compare a giant corporation to a small mid-cap stock on equal footing.
The current ratio is a primary liquidity metric measuring a company's ability to pay short-term obligations.
Current Ratio Formula:
Total Current Assets / Total Current Liabilities
If a company has $2 million in current assets and $1 million in current liabilities, its current ratio is 2.0. It has two dollars of short-term assets for every one dollar of short-term debt. However, a current ratio below one indicates that a company has more short-term liabilities than short-term assets, flashing a massive warning sign to investors about potential insolvency.
But let's think critically like a forensic accountant. Are all "current assets" truly liquid? If a hardware store is facing a cash crunch, it can easily tap its bank accounts. But can it instantly pay the electric bill with a warehouse full of unsold lawnmowers? No. The Series 7 exam classifies inventory as the least liquid current asset on a corporate balance sheet.

To get a stricter view of liquidity, we strip out the inventory to find our quick assets, which represent highly liquid current assets that can be rapidly converted to cash.
Quick Assets Formula:
Total Current Assets - Inventory
This leads us to the quick ratio, which measures a company's ability to meet short-term obligations using only highly liquid assets.
Quick Ratio Formula:
Quick Assets / Total Current Liabilities
Because this is the ultimate, non-forgiving test of corporate survival, the quick ratio is widely known in the securities industry as the acid-test ratio.
If liquidity is about surviving the next twelve months, solvency is about surviving the next twelve years. How heavily is the company relying on borrowed money?
The debt-to-equity ratio evaluates a company's financial leverage and capital structure.
Debt-to-Equity Ratio Formula:
Total Liabilities / Total Shareholders' Equity
Leverage acts as an amplifier. When business is booming, borrowed money allows a company to expand rapidly without diluting the owners' shares. But leverage is a double-edged sword. A high debt-to-equity ratio indicates a company heavily relies on borrowed funds to finance corporate growth. During an economic downturn, revenues may plummet, but the fixed interest payments on that debt do not budge. Consequently, a high debt-to-equity ratio correlates directly with an increased risk of corporate bankruptcy.
How do we connect the massive numbers on a corporate financial statement to the $50 or $100 share price your client is looking at on their screen? We must break the company's performance down to a per-share basis.
Earnings Per Share (EPS)
Earnings Per Share measures the portion of a company's profit allocated to each outstanding share of common stock. However, before the common stockholders get their slice of the pie, the preferred stockholders must be fed. Preferred dividends are paid from net income before Earnings Per Share for common stock can be calculated.
EPS Formula:
(Net Income - Preferred Dividends) / Number of Common Shares Outstanding
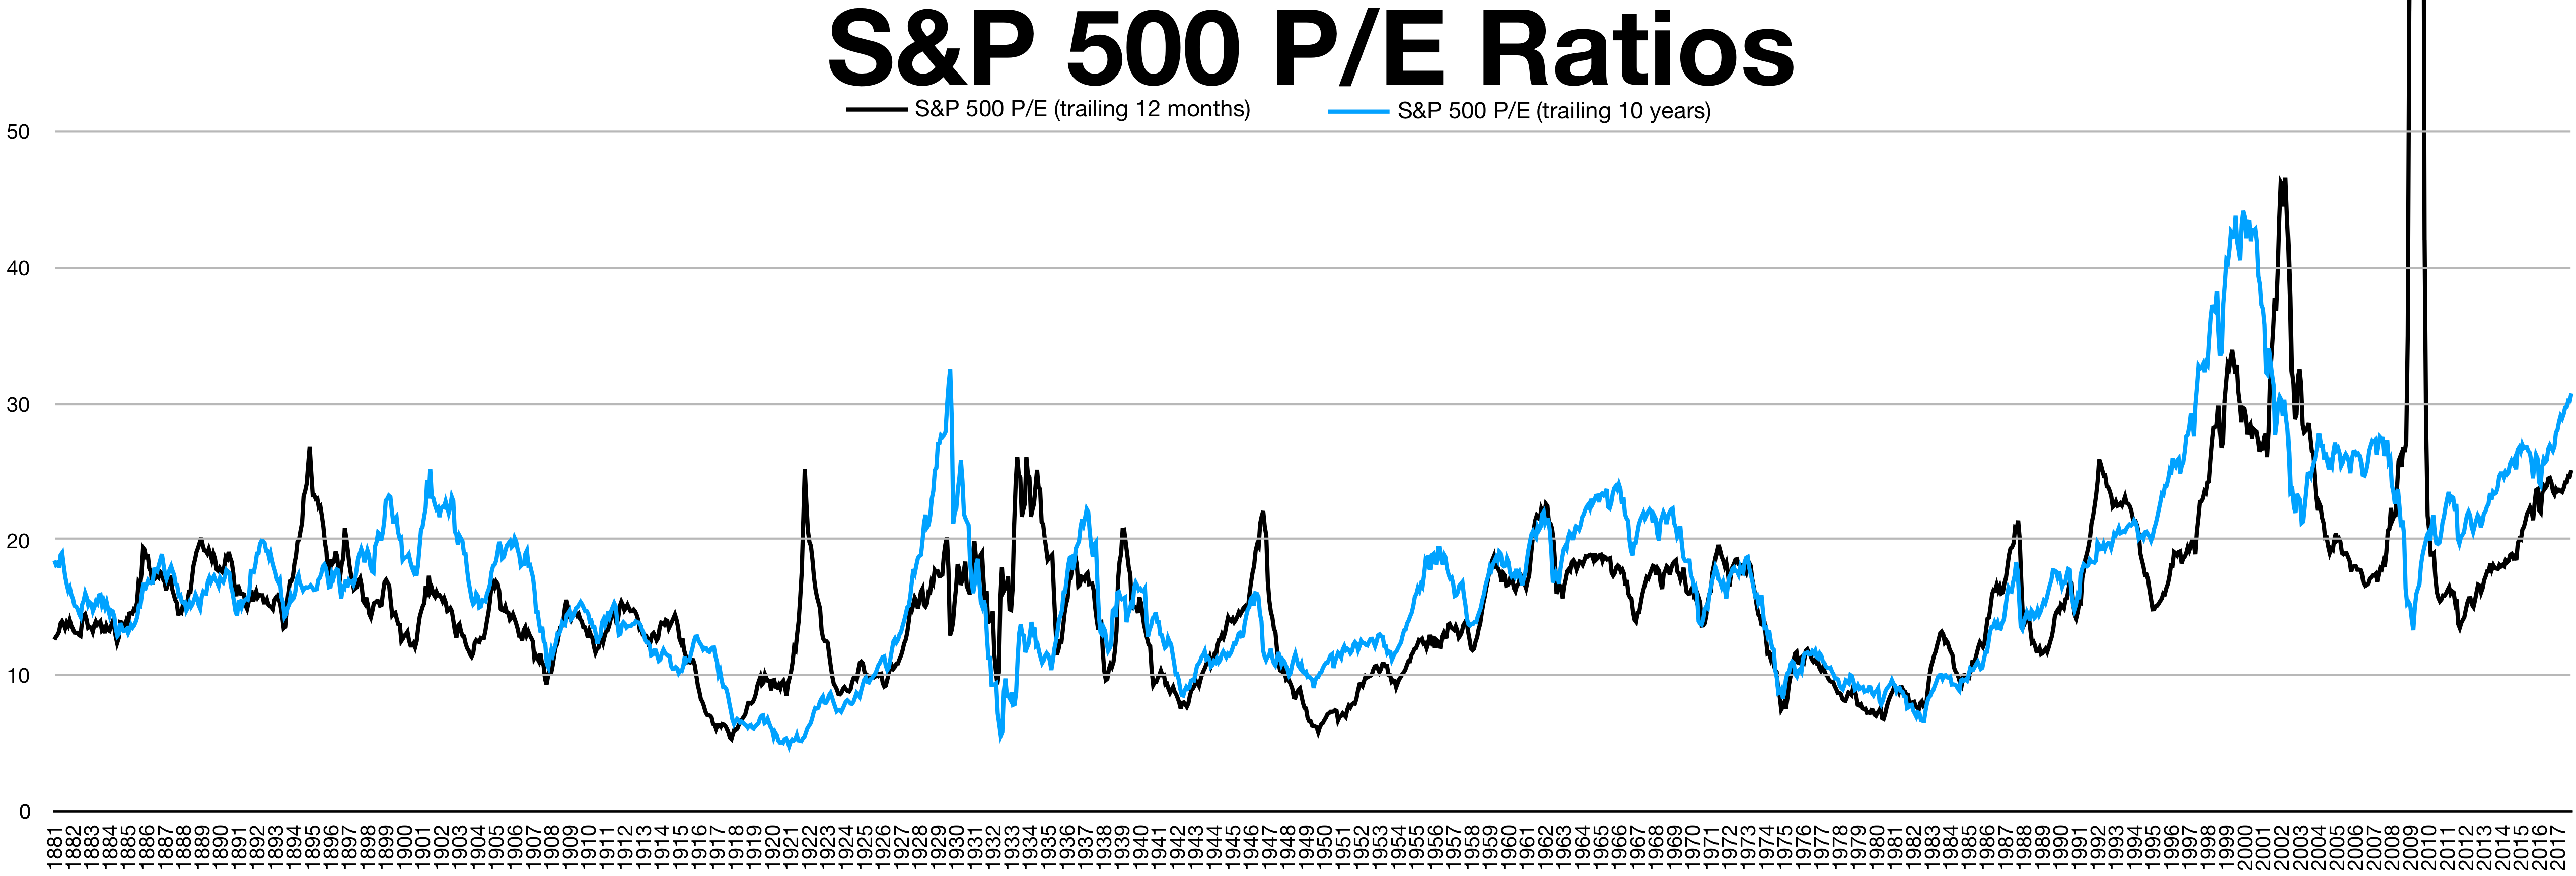
The Price-to-Earnings (P/E) Ratio
If two companies both earn $2 per share, but Company A's stock costs $20 and Company B's stock costs $60, why the difference? Enter the P/E ratio.
The Price-to-Earnings ratio compares a company's current share price to the per-share earnings of the company.
P/E Ratio Formula:
Current Market Price per Share / Earnings Per Share
The P/E ratio is the price tag of earnings. If a stock trades at a P/E of 15, you are paying $15 for every $1 of current corporate earnings. A high Price-to-Earnings ratio suggests investors expect higher future earnings growth compared to companies with a lower ratio. They are willing to pay a premium today because they believe those earnings will skyrocket tomorrow.
Because of this dynamic, value stocks generally trade at a lower Price-to-Earnings ratio compared to growth stocks. Value investors look for mispriced bargains (low P/E), while growth investors look for rapid expansion (high P/E).
When a company turns a profit, management must decide how much cash to hand back to the shareholders. We measure this intent using the dividend payout ratio, which indicates the percentage of a company's earnings distributed to shareholders as dividends.
Dividend Payout Ratio Formula:
Annual Dividends per Share / Earnings Per Share
The payout ratio tells you exactly what kind of corporate lifecycle you are looking at:
- Growth companies typically maintain a low dividend payout ratio to reinvest profits into expansion. They need every spare dollar for research, development, and capturing market share.
- Mature utility companies typically maintain a high dividend payout ratio. Because they operate in heavily regulated, steady-state environments with predictable cash flows and less need for aggressive expansion, they return the bulk of their earnings directly to their shareholders.
Finally, how does that dividend compare to what it costs to buy the stock today? Current yield for a stock measures the annual income generated by the investment relative to the current market price.
Current Yield Formula:
Annual Dividend per Share / Current Market Price per Share
If a client pays $100 for a share of stock that pays an annual dividend of $4, the current yield is 4%. It provides a real-time snapshot of the cash-flow return an investor is receiving on their deployed capital.
Fundamental analysis transforms you from a spectator watching moving numbers into a mechanic who understands the machine. By mastering the balance sheet, the income statement, and the vital ratios that bridge them, you will be uniquely positioned to guide your clients away from fragile, over-leveraged illusions and toward enduring financial value.