Portfolio Theory and Analysis
Imagine you are handed the life savings of a client—a surgeon, a teacher, or perhaps a fellow market professional—and tasked with making it grow without letting it be obliterated by the inherent chaos of the global economy. You are not simply picking a handful of stocks and hoping for the best; you are acting as an architect designing a suspension bridge. This structure must reliably bear the daily weight of financial traffic, withstand the sudden, violent shocks of economic earthquakes, and resist the quiet, corrosive rust of inflation over decades.

To achieve this, you must understand the physics of finance. We have tools to measure volatility, laws that govern how asset prices interact, and strict mathematical boundaries that determine what is possible to achieve. As a securities representative, your mastery of portfolio theory, asset allocation, and tax regulation separates deliberate, engineered financial success from sheer gambling.
Before we can build a resilient portfolio, we must understand the forces trying to tear it down. In finance, risk is not a monolith; it fractures into distinct types that require completely different defensive engineering.
Systematic Risk: The Unavoidable Weather
Systematic risk is the inherent risk of the overall market. Think of this as the macroeconomic weather: a hurricane affects every house on the coastline, regardless of how well an individual house is built. Because it is tied to broad economic forces, systematic risk cannot be eliminated through portfolio diversification.
The three primary forms of systematic risk you must monitor for your clients are:
- Market risk: The reality that the entire stock market can decline, dragging most individual equities down with it.
- Interest rate risk: The inverse relationship between prevailing interest rates and bond prices. When the Federal Reserve raises rates, existing bond prices broadly fall.
- Purchasing power risk: The danger that the returns generated by an investment will fail to outpace the rising cost of living. Keep in mind that purchasing power risk is synonymous with inflation risk.

Unsystematic Risk: The Single Point of Failure
Conversely, unsystematic risk is the financial risk specific to a single company or localized sector. If the CEO of a particular technology firm is indicted for fraud, that firm's stock will plummet, but the broader S&P 500 will barely register a tremor.
Common types include:
- Business risk: The risk that a company’s operating model fails, its products lose market share, or its management makes poor decisions.
- Regulatory risk: The risk that new legislation—like a ban on a specific chemical—devastates a particular industry.
Unlike systematic risk, unsystematic risk can be heavily mitigated through proper portfolio diversification. However, if a client insists on placing all their capital into their employer's stock, they suffer from portfolio concentration. Portfolio concentration occurs when a significant portion of wealth is tied to a single security, and as you would expect, portfolio concentration significantly increases unsystematic risk.
Finally, a risk that sits outside the pure market/company dichotomy is liquidity risk: the risk that an asset cannot be sold quickly without a significant price concession. Real estate and thinly traded micro-cap stocks have high liquidity risk, whereas US Treasury bills are highly liquid.
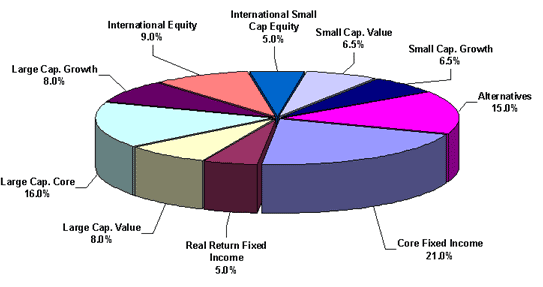
How do we build a structure to survive these forces? We begin with asset allocation, which is the process of distributing an investment portfolio across various distinct asset classes, such as equities, fixed-income debt, cash equivalents, and real estate.
Strategic vs. Tactical Allocation
The foundation of a client's wealth is their strategic asset allocation. This establishes a long-term target portfolio composition based on the risk tolerance of the investor (e.g., 60% equities, 40% bonds). Because it relies on setting a baseline and sticking to it over decades, strategic asset allocation is generally associated with a passive investment management style.
However, markets are not static. A portfolio manager might employ tactical asset allocation, which involves actively adjusting a portfolio's asset mix to take advantage of short-term market opportunities. Because the manager is making predictive moves—perhaps overweighting energy stocks before a perceived supply shortage—tactical asset allocation is a form of active portfolio management.
Maintaining the Architecture: Rebalancing
Over time, market movements will warp a portfolio's original ratios. If a client's stocks double in value while their bonds stagnate, their risk profile has suddenly become far more aggressive. Portfolio rebalancing is the process of buying or selling assets to restore a portfolio to its original target allocation.
Managers utilize distinct mathematical plans to govern this flow of capital:
- A constant dollar plan maintains a fixed dollar amount in a specific asset class. If the target is $50,000 in equities and the market pushes the value to $60,000, the manager liquidates $10,000 to return to the baseline.
- A constant ratio plan maintains a fixed percentage allocation between different asset classes, rebalancing whenever the ratio (say, 70/30) drifts beyond acceptable parameters.
Diversification and Correlation
We know that diversification reduces unsystematic risk by spreading investments across various unrelated assets. But how do we define "unrelated"? We use a statistical concept called correlation, which measures the degree to which two different investments move in relation to each other.
- A correlation coefficient of positive one (+1.0) indicates that two assets move in identical directions. Owning two perfectly positively correlated assets offers almost no diversification benefit.
- A correlation coefficient of zero (0.0) indicates that there is no linear relationship between the price movements of two assets. They act completely independently.
- A correlation coefficient of negative one (-1.0) indicates that two assets move in completely opposite directions.

For the portfolio engineer, finding assets that zig when others zag is the ultimate goal. A portfolio utilizing perfectly negatively correlated assets minimizes overall portfolio risk.
In the 1950s, economist Harry Markowitz revolutionized finance by proving that risk and return should not be viewed by looking at individual stocks, but by how stocks interact in a basket. Modern Portfolio Theory (MPT) seeks to maximize expected return for a given level of risk.
At the heart of MPT is a fundamental assumption about human psychology: Modern Portfolio Theory assumes that investors are inherently risk-averse. If a client is offered two portfolios with a 10% expected return, they will naturally choose the one with less volatility.
The Efficient Frontier
If you map out every possible combination of risky assets on a graph—with risk on the X-axis and expected return on the Y-axis—a distinct hyperbola emerges. The upper edge of this curve is known as the efficient frontier, a graphical representation of optimal portfolios.
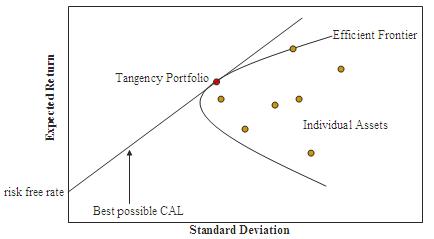
The Mathematical Boundary of Investing
- Portfolios resting exactly on the efficient frontier offer the highest expected return for a defined level of risk.
- Portfolios that fall below the efficient frontier are considered mathematically sub-optimal; the investor is taking on excessive risk for an inadequate reward.
Measuring Total Risk vs. Systematic Risk
To plot these points, we need hard mathematical measurements for risk.
Standard deviation serves as an absolute measure of total portfolio risk. The standard deviation of a portfolio measures the dispersion of returns around the historical average return. If an asset returns an average of 8% a year, but swings wildly between +30% and -20%, it has a high standard deviation.

However, standard deviation measures total risk (both systematic and unsystematic). When we want to measure strictly systematic risk, we use Beta.
- Beta is a statistical measure of the volatility of an individual security relative to the overall market.
- By definition, the overall stock market has a beta of exactly 1.0.
- A security with a beta greater than 1.0 is more volatile than the overall market. (e.g., A beta of 1.5 means the stock moves 15% when the market moves 10%).
- A security with a beta less than 1.0 is less volatile than the overall market.
Once we know an asset's beta, we can determine exactly how much an investor should be compensated for holding it. The Capital Asset Pricing Model (CAPM) relates the expected return of an asset to its systematic risk.
The CAPM Formula
The Capital Asset Pricing Model formula adds the risk-free rate to the product of beta and the market risk premium.
Expected Return=Risk-Free Rate+[Beta×(Market Risk Premium)]
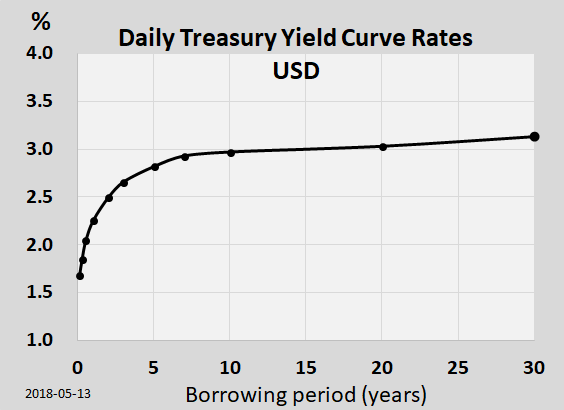
- The Risk-Free Rate: The yield on a 90-day US Treasury bill is typically used as the risk-free rate in the Capital Asset Pricing Model, as it is considered free of default risk.
- The Market Risk Premium: This is the difference between the expected return of the broader market and the risk-free rate. It represents the extra compensation investors demand for leaving the safety of Treasuries.

Alpha: The Value of the Manager
CAPM gives us a prediction. If the model says a stock with a beta of 1.2 should return 9%, but the stock actually returns 12% over the year, where did that extra 3% come from? That is Alpha.
Alpha measures the excess return of an investment relative to the return predicted by the Capital Asset Pricing Model.
- A positive alpha indicates that an investment has outperformed its risk-adjusted benchmark. The manager actually generated real value.
- A negative alpha indicates that an investment has underperformed its risk-adjusted benchmark.
The Sharpe Ratio
Clients often look only at raw returns, but you must look at the cost of those returns. The Sharpe ratio measures the risk-adjusted return of an investment portfolio.
- The numerator of the Sharpe ratio is the portfolio return minus the risk-free rate. (This isolate the "excess return" generated by taking risk).
- The denominator of the Sharpe ratio is the standard deviation of the portfolio.
By dividing the excess return by the total risk taken to get it, we derive a single efficiency score. Ultimately, a higher Sharpe ratio indicates a superior risk-adjusted performance.
With the mathematical framework built, how do we select specific assets?
Equity Investment Styles
- Value investing involves purchasing securities that are currently trading below their perceived intrinsic value. Value investors are bargain hunters, looking for fundamentally sound companies temporarily discarded by the market.
- Growth investing focuses on purchasing stock in companies expected to grow sales and earnings faster than the overall market average. These stocks often trade at high price-to-earnings ratios but offer immense capital appreciation potential.
Fixed-Income Engineering
When structuring a bond portfolio to combat interest rate risk, managers deploy geometric strategies across the yield curve:
- A laddered bond strategy purchases bonds with steadily staggering maturities (e.g., bonds maturing in 1, 2, 3, 4, and 5 years) to actively manage interest rate risk. As short-term bonds mature, the principal is reinvested at the longer end of the ladder, ensuring a constant flow of liquidity and blended interest rates.
- A barbell bond strategy concentrates fixed-income investments at both the short-term and long-term ends of the maturity spectrum. A barbell bond strategy actively avoids intermediate-term bond maturities, providing both liquidity (short end) and higher yield (long end).
- A bullet bond strategy purchases bonds at different intervals that all mature at the same target future date. This is ideal for a client with a specific future liability, like paying for a child's college education starting in exactly ten years.
In academia, gross returns are all that matter. In the real world, the Internal Revenue Service (IRS) demands a share of the architecture. A brilliantly allocated portfolio means nothing if the profits are unnecessarily devoured by taxes.
Capital Gains
When a capital asset is sold for a profit, the duration it was held dictates its tax treatment:
- Short-term capital gains apply to capital assets held for exactly one year or less. Short-term capital gains are taxed at the investor's ordinary income tax rate, which is heavily punitive for high earners.
- Long-term capital gains apply to capital assets held for more than one full year. Long-term capital gains are taxed at a specifically preferential rate compared to ordinary income (typically 15% or 20%), making holding periods a critical consideration.
Mutual Fund Taxation
If a client holds a mutual fund, they will encounter unique tax mechanisms. Reinvested capital gains distributions in a mutual fund are fully taxable in the specific year they are distributed, even if the investor never took possession of the cash. Because those distributions are reinvested to buy more shares, reinvested mutual fund dividends increase the investor's overall cost basis in the fund, preventing double taxation when the shares are eventually sold.
Tax-Loss Harvesting and the Wash Sale Rule
A powerful tool in a manager's arsenal is tax-loss harvesting, which involves selling depreciated securities to offset realized capital gains liability. If you have $50,000 in gains elsewhere, you can sell a loser to claim a $50,000 loss, netting your gains to zero.
Furthermore, if your losses exceed your gains, a maximum of $3,000 in net capital losses can be used to offset ordinary income in a single tax year. (Note: The maximum capital loss deduction against ordinary income for a married individual filing separately is $1,500 per year). Any capital losses exceeding the annual deduction limit can be carried forward indefinitely to future tax years.
However, the IRS knows that investors might try to sell a stock for a loss and immediately buy it right back just to claim the tax deduction while keeping their position. To stop this, they instituted the wash sale rule, which prevents an investor from immediately claiming a tax deduction on a capital loss.
The Parameters of a Wash Sale A wash sale occurs if a substantially identical security is purchased within 30 days prior to a loss-generating sale, OR if a substantially identical security is purchased within 30 days after a loss-generating sale. Including the day of the trade itself, the complete wash sale period encompasses a total window of 61 days.
The definition of "substantially identical" is strict. Call options on a sold stock are considered substantially identical securities under the wash sale rule. Furthermore, convertible bonds are considered substantially identical securities to the underlying common stock, and warrants are considered substantially identical securities to the underlying common stock under the wash sale rule.
Cost Basis Methodologies and Wealth Transfers
When a client goes to sell a portion of their holdings—say, 100 shares of Apple out of 1,000 they've accumulated over the years—how do they determine their tax liability?
- Identifying specific shares to sell allows an investor to dictate the exact capital gains tax liability of a transaction. The investor can deliberately choose to sell the specific lots that yield the best tax outcome.
- However, the Internal Revenue Service assumes the first-in-first-out (FIFO) accounting method for stock sales if the investor fails to specify a tax lot.
Finally, we must understand how the cost basis—the original value used for tax purposes—shifts during the transfer of wealth:
- Gifts: The cost basis of a gifted security is the lower of the donor's original cost basis or the fair market value at the time of the gift.
- Inheritance: The tax code is far more generous in death. Inherited securities receive a step-up in cost basis to the fair market value on the date of the original owner's death. Furthermore, the sale of inherited securities is automatically treated as a long-term capital gain or loss. Therefore, the actual holding period of inherited securities is irrelevant for capital gains tax purposes.
As you step into the role of a trusted financial representative, remember that your job is not merely to execute trades. You are an engineer of wealth. By marrying the profound mathematics of Modern Portfolio Theory with the rigorous mechanics of tax law, you construct financial architectures capable of enduring whatever the markets—and reality—throw at them.