Probability of Events
Not sure you’re ready?
Take the ~3-minute readiness diagnostic and see where you stand.
When we toss a coin into the air, the physical laws governing its chaotic tumble are so exquisitely complex that its precise resting state is utterly unpredictable to the human eye. Yet, if we step back and observe the system as a whole, out of this momentary chaos emerges a profound mathematical predictability. Probability is a measure of the likelihood that a specific event will occur. It provides a structured way to quantify uncertainty, transforming our hazy intuition about chance into rigorous, actionable mathematics.

Nature does not operate solely in the rigid absolutes of "will happen" and "won't happen." Most phenomena exist in the rich gradations between these two extremes. To capture this mathematically, the probability of an event is always a numerical value between 0 and 1 inclusive.
This creates a definitive scale of certainty:
- A probability of 0 indicates that a specific event is entirely impossible. If you hold a standard rock over a pond and let go, the probability that it will fall upwards into the clouds is 0.
- A probability of 1 indicates that a specific event is absolutely certain to happen. The probability that the aforementioned rock will fall downward due to gravity is 1.
- A probability of 0.5 indicates that an event is equally likely to occur or not occur. It balances perfectly on the knife-edge of chance.
As we move along this spectrum, the logic remains highly intuitive: an event with a probability closer to 1 is more likely to occur than an event with a probability closer to 0. A weather forecast predicting an 0.9 probability of rain means you should certainly carry an umbrella, whereas an 0.1 probability suggests a largely clear day.
Because probability is a proportional relationship, it is highly flexible in its notation. Probabilities can be expressed using mathematical fractions (like 3/4), decimal numbers (like 0.75), or percentages (like 75%). These are merely three different dialects of the exact same mathematical language.
To calculate these values, we must first map the boundaries of our mathematical universe. In probability, we use specific terminology to dissect a scenario:
- An outcome is a single possible result of a probability experiment.
- The sample space is the complete set of all possible outcomes for a given probability experiment.
- An event is a specific set of outcomes within a larger sample space.
Imagine rolling a die. The roll itself is the experiment. Landing on a "4" is an outcome. Landing on an "even number" is an event (because it includes the outcomes 2, 4, and 6).
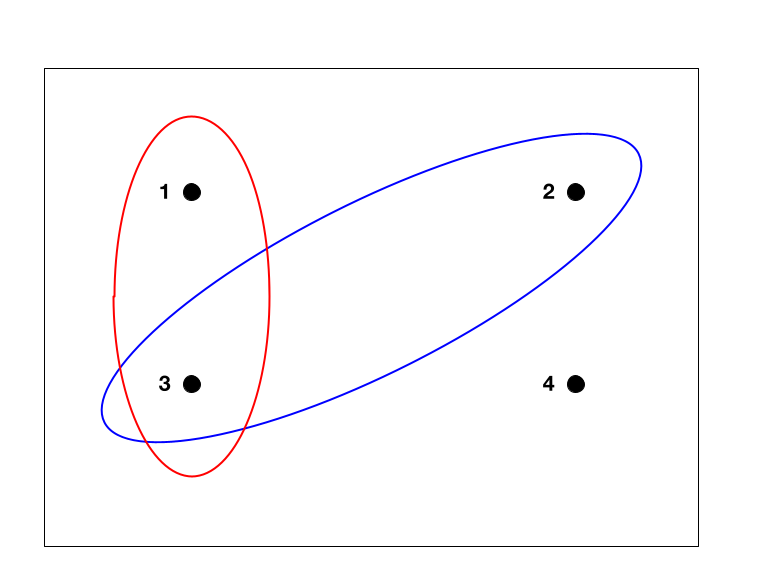
Because something must necessarily happen when you run an experiment, the sum of the probabilities of all distinct possible outcomes in a complete sample space is exactly 1.
The Beauty of Complements
Sometimes, it is mathematically easier to calculate the probability of what won't happen rather than what will.
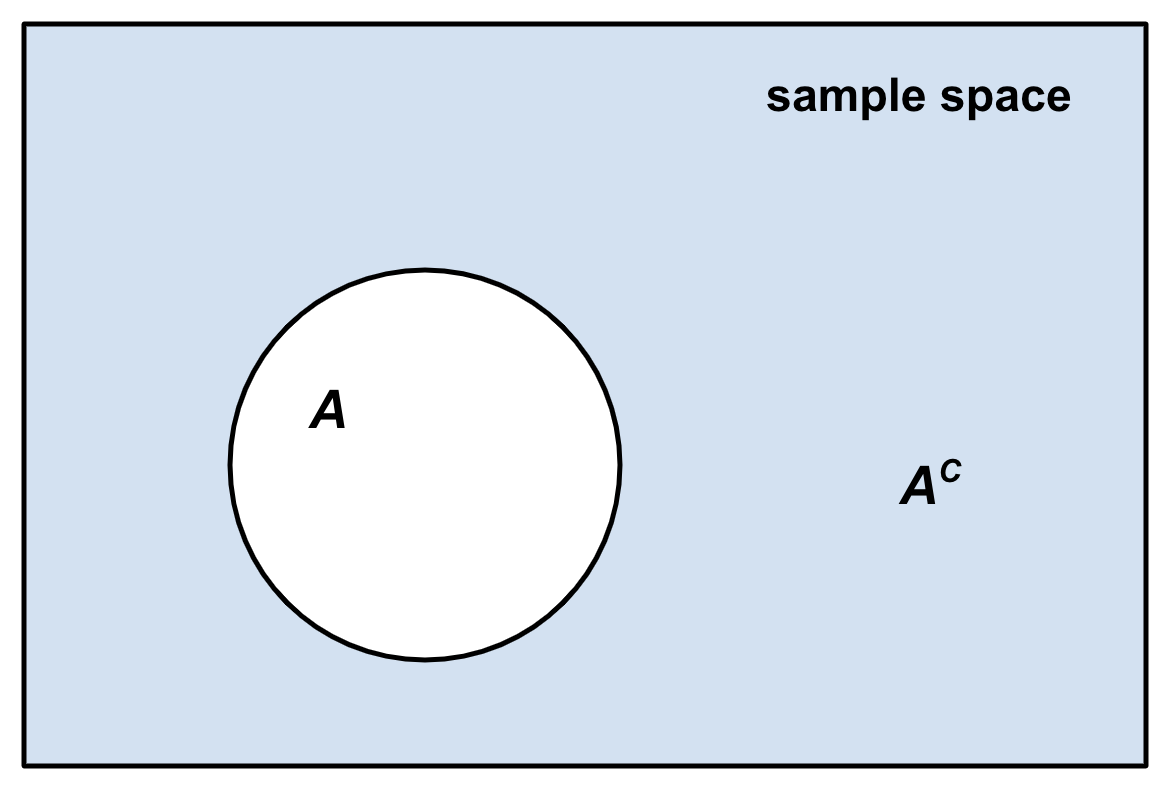
The complement of an event consists of all outcomes in the sample space that are not part of the designated event.
If our event is rolling a 5 or a 6, the complement is rolling a 1, 2, 3, or 4. Because the event and its complement together form the entire sample space, their probabilities must sum to 1. Therefore, the probability of the complement of an event is calculated by subtracting the probability of the event from 1.
Before we ever toss a coin or draw a card, mathematics allows us to deduce what should happen. Theoretical probability predicts expected outcomes in a probability experiment under ideal conditions.
Formula: Theoretical probability is calculated by dividing the number of favorable outcomes by the total number of possible outcomes.
P(Event)=Total Number of Possible OutcomesNumber of Favorable Outcomes
Let us apply this elegant logic to the classic tools of probability:
The Coin Toss
A standard coin toss is the purest distillation of chance. A standard coin toss has a sample space of exactly two possible outcomes. Those two possible outcomes of a standard coin toss are heads and tails.
- Because there is one favorable outcome (heads) and two possible outcomes total, the theoretical probability of a fair coin landing on heads is exactly one divided by two (1/2 or 0.5).
- By the exact same logic, the theoretical probability of a fair coin landing on tails is exactly one divided by two (1/2 or 0.5).

The Six-Sided Die
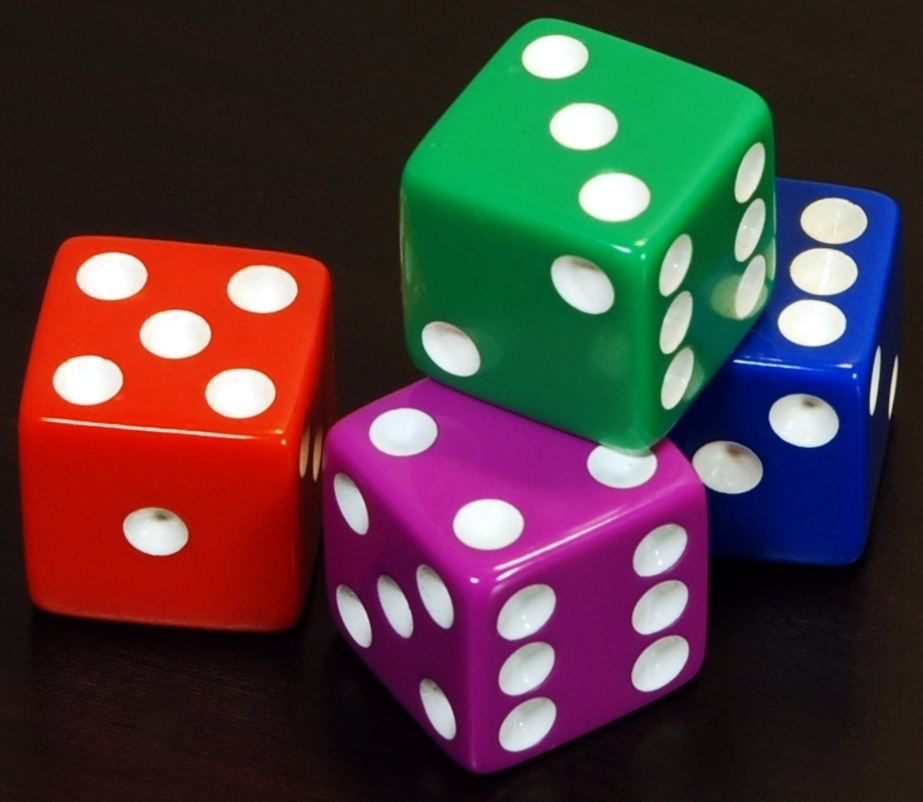
When we move from coins to dice, our sample space expands. A standard fair six-sided die has a sample space consisting of the numbers 1, 2, 3, 4, 5, and 6.
- If we want to roll a 4, there is only one "4" painted on the die, but there are six distinct faces. Thus, the theoretical probability of rolling any single specific number on a fair six-sided die is exactly one divided by six (1/6).
The Deck of Cards
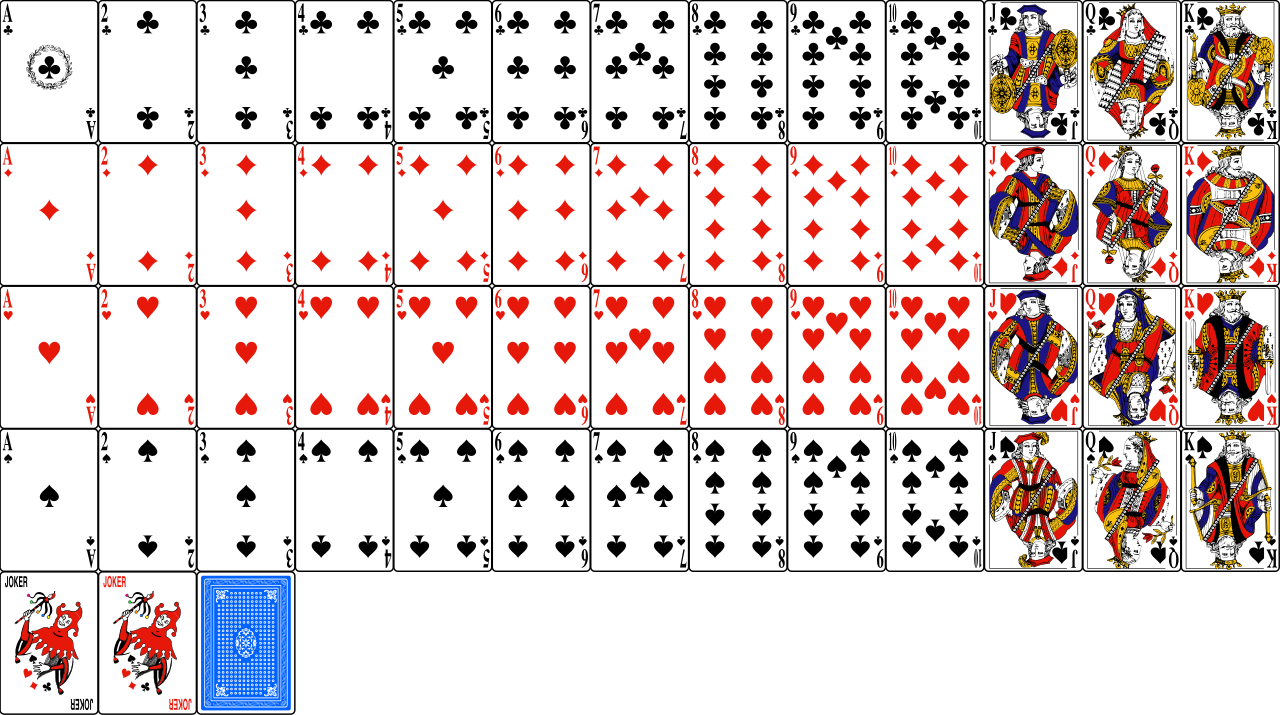
Playing cards offer a wonderfully structured universe for probability. A standard deck of playing cards contains exactly 52 cards. This elegant system is categorized geometrically and numerically: a standard deck of playing cards contains exactly four suits. Those four suits in a standard deck of playing cards are hearts, diamonds, clubs, and spades.
- If you wish to calculate the theoretical probability of drawing a heart, you divide the number of favorable outcomes (13 hearts) by the total possible outcomes (52 cards), resulting in 13/52, which simplifies beautifully to 1/4.
Theoretical probability tells us what should happen in a perfect world. But the physical universe is full of friction, microscopic imbalances, and the simple stubbornness of chance. To measure reality, we must conduct the experiment.
Experimental probability describes the actual measured results that occurred during a physical probability experiment.
Formula: Experimental probability is calculated by dividing the number of times an event actually occurred by the total number of trials conducted.
P(Experimental)=Total Number of TrialsNumber of Times Event Occurred
| Type | Defines | Calculated By |
|---|---|---|
| Theoretical | What should happen (ideal expectations). | Favorable Outcomes ÷ Total Possible Outcomes |
| Experimental | What actually happened (measured reality). | Times Event Occurred ÷ Total Trials Conducted |
If you flip a fair coin ten times, theoretical probability suggests you should get 5 heads. However, your physical experiment might result in 7 heads and 3 tails. In this specific trial run, your experimental probability of heads is 7/10 (0.7), which differs significantly from the theoretical probability of 0.5.
Does this mean the mathematics are broken? Not at all. It simply means our sample size is too small. This brings us to one of the most magnificent concepts in mathematics: the Law of Large Numbers.
Increasing the number of trials in a probability experiment causes the experimental probability to move closer to the theoretical probability.
If you flip that same coin ten thousand times, the microscopic fluctuations of chance wash out. You will not get exactly 5,000 heads, but the experimental probability will aggressively converge upon the theoretical 0.5. The noise of the physical world fades, revealing the pure, undeniable mathematical truth beneath.