Interpreting Assessment Results
Not sure you’re ready?
Take the ~3-minute readiness diagnostic and see where you stand.
A standardized test protocol sitting on an educator’s desk is, fundamentally, just a record of a student’s behavior in a highly manufactured environment. To transform a tally of pencil marks into a precise, targeted blueprint for academic intervention, we must translate isolated numerical values into a cohesive psychological and educational profile. This translation is the core of special education assessment. The data extracted from psychoeducational batteries, behavioral rating scales, and daily instructional probes dictates not just legal eligibility under the Individuals with Disabilities Education Act, but the exact architectural reality of a student’s Individualized Education Program. Understanding the statistical mechanisms beneath these scores separates rote compliance from transformative teaching.

When you sit down to administer an assessment, your first task is to find the boundaries of the student's knowledge. We do not test a fifth-grader on basic phonics if they are already reading chapter books, nor do we force a frustrated student through calculus if they are struggling with fractions. We rely on built-in boundaries.
Basal levels represent the starting point of an assessment where the student answers all consecutive questions correctly. Think of the basal as the bedrock; we assume mastery of all content below this point. Conversely, ceiling levels represent the ending point of an assessment where the student incorrectly answers a specified number of consecutive questions. Once a student hits the ceiling, the assessment stops. We have found the upper limit of their current capability.
Between the basal and the ceiling, you accumulate the raw data. Raw scores indicate the total number of correct responses on an assessment. However, a number like "42" tells you nothing on its own. Was the test 50 questions or 500? Were the questions meant for a first-grader or a high school senior? Consequently, raw scores have little interpretive value without conversion to standardized metrics.
To give raw scores meaning, we map them onto a normal distribution—the "bell curve." Norm-referenced tests compare a student's performance to a representative sample of peers. Instead of just asking, "How many did they get right?", we ask, "How did they perform relative to everyone else their age?"
Once converted, a standard score indicates how far a student's performance deviates from the mean score of the normative sample.
To interpret these scores, you must understand standard deviation. Conceptually, standard deviation measures the amount of variation or dispersion in a set of test scores. It tells us how "wide" or "spread out" the bell curve is. If the standard deviation is small, most students scored very close to the average. If it is large, the scores are spread out over a wide range.
For most major intelligence and achievement tests (like the WISC or the WJ-IV), the scale is strictly defined:
- The mean of a standard score distribution is typically 100.
- The standard deviation of a standard score distribution is typically 15.
Because most human traits cluster around the middle, a standard score between 85 and 115 is generally considered within the average range. This covers roughly 68% of the population. If a student scores an 85, that is mathematically significant: a standard score of 85 falls one standard deviation below the mean.
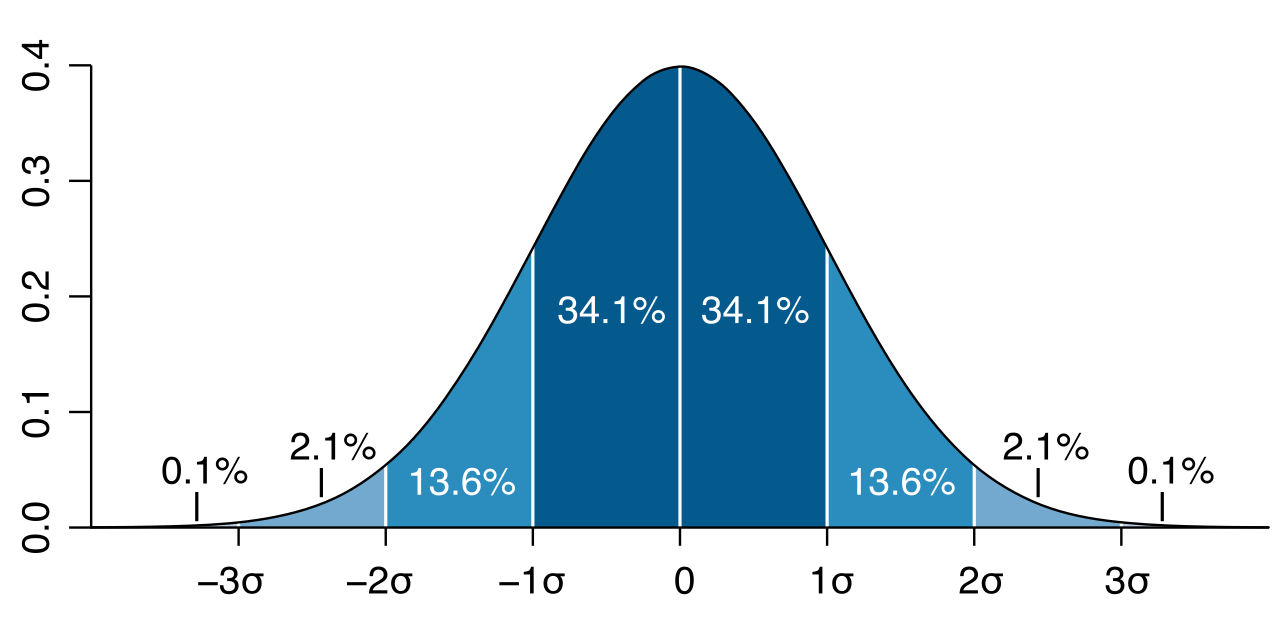
Other Common Standardized Metrics
Standard scores of 100 are not the only way to measure deviation. Psychometricians use a variety of scales depending on the tool:
| Metric | Mean | Standard Deviation | Description / Notable Facts |
|---|---|---|---|
| Z-Scores | 0 | 1 | Z-scores represent the number of standard deviations a raw score is from the mean. A Z-score of -1.0 is exactly the same as a standard score of 85. |
| T-Scores | 50 | 10 | Often used in behavioral rating scales. T-scores are standardized scores with a mean of 50 and a standard deviation of 10. A T-score of 60 is one SD above the mean. |
| Stanines | 5 | ~2 | Stanine scores divide a normal distribution into nine equally spaced intervals. By definition, the mean of a stanine distribution is exactly 5. Furthermore, a stanine score of 1, 2, or 3 represents below-average performance. |
We also heavily rely on percentiles to explain data to parents. Percentile ranks indicate the percentage of students in the normative group who scored at or below a specific score. If a student is in the 75th percentile, they scored as well as or better than 75% of their peers. Naturally, a percentile rank of 50 represents strictly average performance compared to the normative group.
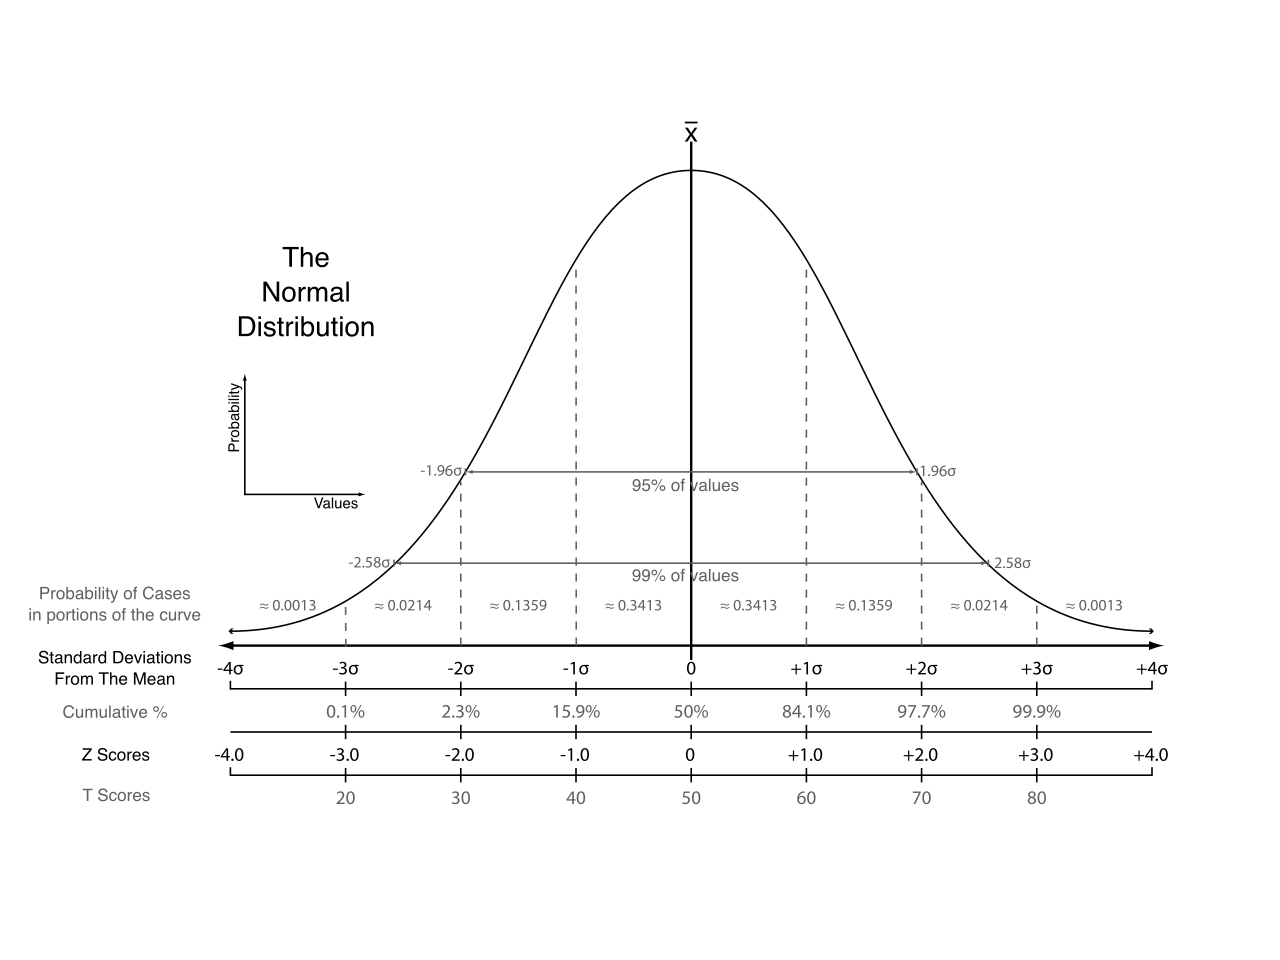
No test is a perfect measure of human intellect. A student might be tired, anxious, or distracted by a flickering fluorescent light. Because of this, the standard error of measurement estimates the amount of error inherent in a given test score.
We never assume a single score is absolute truth. Instead, we use confidence intervals.
Confidence Intervals: Confidence intervals represent a range of scores within which a student's true score is likely to fall. Because confidence intervals account for the standard error of measurement in standardized testing, we might say, "We are 95% confident the student's true reading score lies between 86 and 94."
Perhaps the most universally misunderstood metric in special education is the grade-equivalent score. Grade-equivalent scores represent the grade level at which the median student achieved a particular raw score.
If your third-grade student receives a grade-equivalent score of 7.2 in mathematics, parents will often assume the child is ready for seventh-grade math. This is a dangerous fallacy. Grade-equivalent scores do not indicate that a student has mastered the curriculum of that specific grade level. It simply means the third grader achieved the same raw score on the third-grade test that an average seventh grader would have achieved if they had taken the exact same third-grade test.
When we actually need to measure mastery of specific content, we abandon norm-referenced tests entirely.
- Criterion-referenced tests measure a student's performance against a predetermined set of skills or standards.
- Unlike norm-referenced tests that compare students to each other, criterion-referenced tests determine mastery of specific instructional objectives. (e.g., "Can the student multiply double-digit numbers with 90% accuracy?")
A psychoeducational evaluation gives us a static snapshot—a photograph of the student's mind on a given Tuesday in October. But teaching requires motion tracking. We need video, not just photographs.
Before we implement a new teaching strategy, we collect baseline data [which] establishes a student's starting point of performance prior to implementing an intervention.
Once instruction begins, we utilize two broad categories of assessment:
- Formative assessments provide ongoing data to adjust instruction during the learning process. (Think of this as tasting the soup while you are cooking it).
- Summative assessments evaluate student learning at the conclusion of an instructional period. (Think of this as serving the soup to a food critic).
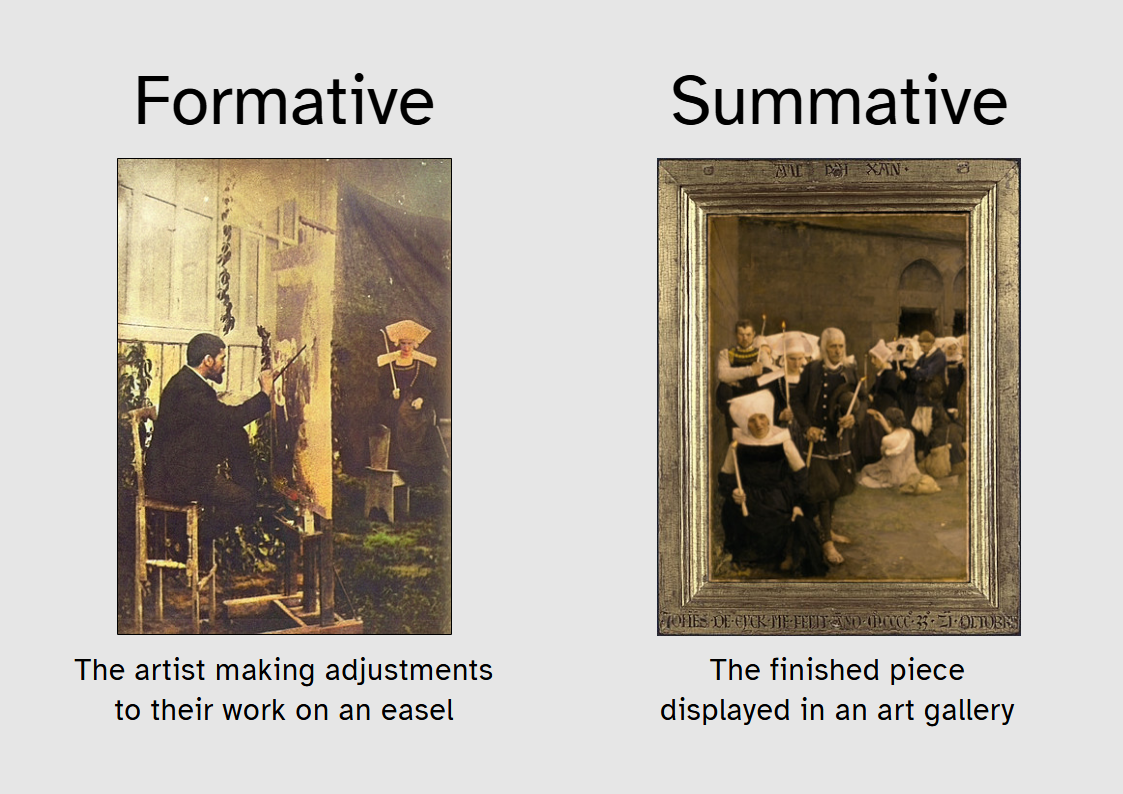
In special education, the gold standard for formative assessment is Curriculum-based measurement (CBM) [which] involves frequent assessment of a student's academic progress in the local curriculum.
Because we take these probes weekly or even daily, curriculum-based measurement data is plotted on graphs to visually interpret academic growth over time.
When you look at a CBM graph, you are evaluating two distinct lines:
- An aimline on a curriculum-based measurement graph represents the expected trajectory of student progress. (The goal).
- Trendlines on curriculum-based measurement graphs indicate the actual rate of a student's progress. (The reality).
The interaction of these two lines drives instruction. Comparing a student's trendline to the aimline dictates whether instructional interventions need adjustment. If the trendline falls flatter than the aimline, your current intervention is failing, and you must pivot.
Sometimes, rather than comparing a student to an external standard, we look purely at personal growth. An ipsative assessment compares a student's current performance directly to their own past performance. If a student with severe cognitive delays goes from identifying 2 sight words to 10, that ipsative growth is a monumental success, regardless of where those 10 words put them on a standardized normal distribution.
A student is not a brain in a jar; they exist in complex social ecosystems. Assessing them solely in a quiet, 1-on-1 testing room will yield incomplete data. Therefore, ecological assessments evaluate a student's functioning within their natural environments, such as the noisy cafeteria, the playground, or the general education classroom.
To measure behavior systematically, we use specific tools. Rating scales quantify behavioral observations by assigning numerical values to the frequency of specific behaviors (e.g., "0 = Never, 1 = Sometimes, 2 = Often").
We give these scales to both teachers and parents. Often, the scores will not match. This is not a failure of the test; it is valuable data. Discrepancies between parent and teacher rating scales indicate situation-specific behavioral variations. A child might be highly oppositional at home but perfectly compliant at school, pointing to environmental triggers rather than an internalized behavioral disorder.
Recognizing the parent's unique perspective is mandated by law: Evaluation reports must include information provided by parents regarding the student's strengths and weaknesses.
Federal law recognizes that a single test score is inadequate to define a child's educational future. The Individuals with Disabilities Education Act requires the use of multiple evaluation tools to determine special education eligibility. We practice triangulation [which] involves using multiple data sources to confirm assessment findings. If a low reading score on a standardized test is corroborated by poor CBM trendlines and teacher observations, we can confidently confirm a deficit.
The ultimate culmination of this data collection is the psychological report. A psychoeducational evaluation report synthesizes cognitive processing and academic achievement test results.
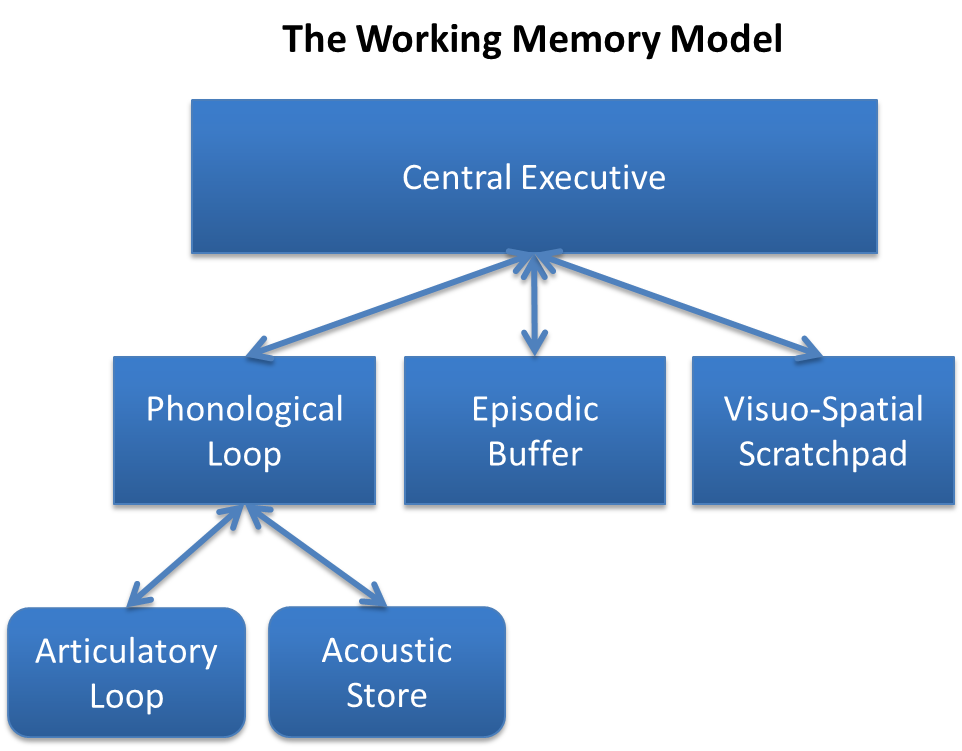
When interpreting this report, special educators look for patterns. We look at subtest scatter [which] refers to significant variations between individual subtest scores on a single standardized assessment. If a student has an average overall IQ, but their Working Memory subtest is far lower than their Verbal Comprehension, analyzing subtest scatter helps identify specific cognitive or academic processing deficits.
Historically, to identify a Specific Learning Disability (SLD), we used discrepancy analysis [which] compares a student's cognitive ability to their actual academic achievement. (e.g., "The student is highly intelligent but failing to read"). Today, modern practice dictates that Response to Intervention (RTI) data can replace or supplement discrepancy analysis for specific learning disability identification, ensuring we don't wait for a student to fail dramatically before offering help.
Finally, all of this data is poured into the Individualized Education Program (IEP). The very first step is drafting the PLAAFP. Present Levels of Academic Achievement and Functional Performance statements must be based on objective assessment data. You cannot write, "Jimmy struggles with math." You must write, "Based on curriculum-based measurements, Jimmy computes single-digit addition at a rate of 12 correct digits per minute, compared to a peer aimline of 30."
Crucially, our data analysis is not just about hunting for deficits. Identifying student strengths is essential for designing compensatory strategies in an Individualized Education Program. If your data triangulation reveals a student has a severe deficit in auditory processing but incredible visual-spatial strengths, you have just discovered your intervention strategy. You bypass the broken auditory pathway and teach through their visual strengths. That is the true power of interpreting assessment results—not merely labeling what is broken, but discovering the exact tools required to build a bridge over it.