Mathematics for the ATI TEAS 7: What's Tested and How to Study It
In short
Mathematics is 23% of the [ATI TEAS 7](/exams/nursing/ati-teas-7), tested across 10 topic areas in a 57-minute block. It covers arithmetic and pre-algebra — fractions, percentages, proportions, one-variable equations, and reading data off a graph. An on-screen four-function calculator is provided, so the test rewards setting a problem up correctly over grinding arithmetic by hand.
The big ideas
Almost every math question traces back to one skill: turning a word problem into a setup you can solve. The calculator handles the numbers. Your job is knowing which operation the situation calls for. The 10 topics cluster into a few themes.
Numbers in three forms
Fractions, decimals, and percentages are the same value written three ways, and you'll convert between them constantly. 3/4 = 0.75 = 75%. Solidify fractions, decimals, and percentages and operations with rational numbers first — nearly everything else builds on them.
Order and operations
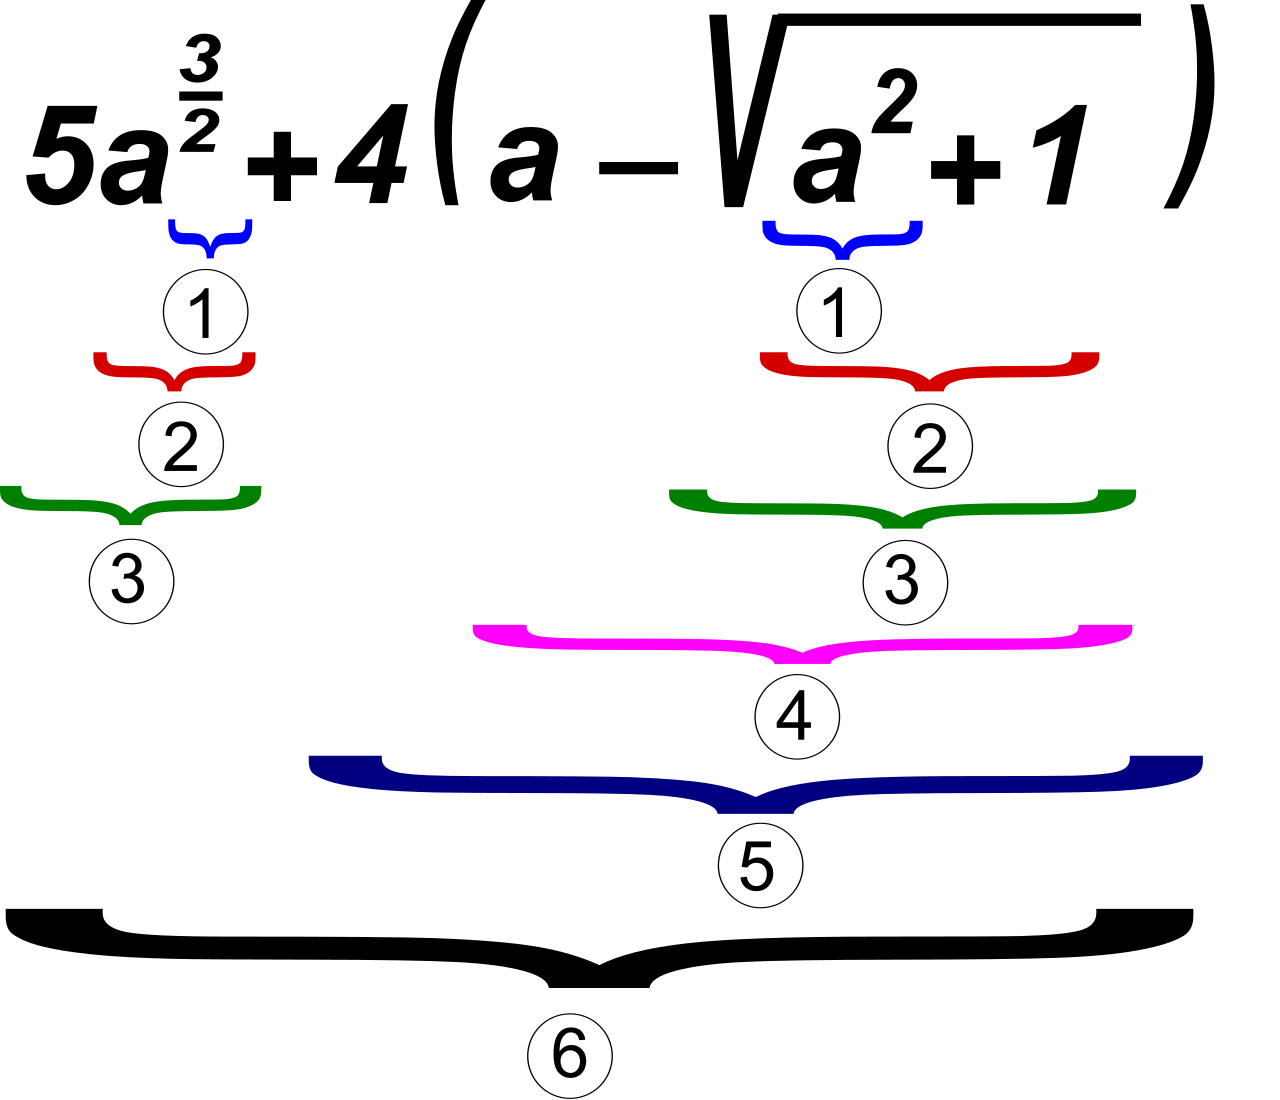
Comparing, ordering, and order of operations is where PEMDAS lives. Feed the calculator the steps in the wrong order and you'll get a clean, confident wrong answer, so the skill being tested is the sequence.
Algebra you can use
Equations and inequalities means solving for one variable — isolate x, keep both sides balanced. Pair it with relationships between variables, where you read how one quantity changes with another. It stays at the level of clean, one-variable algebra: no proofs, no factoring quadratics.
Proportional reasoning
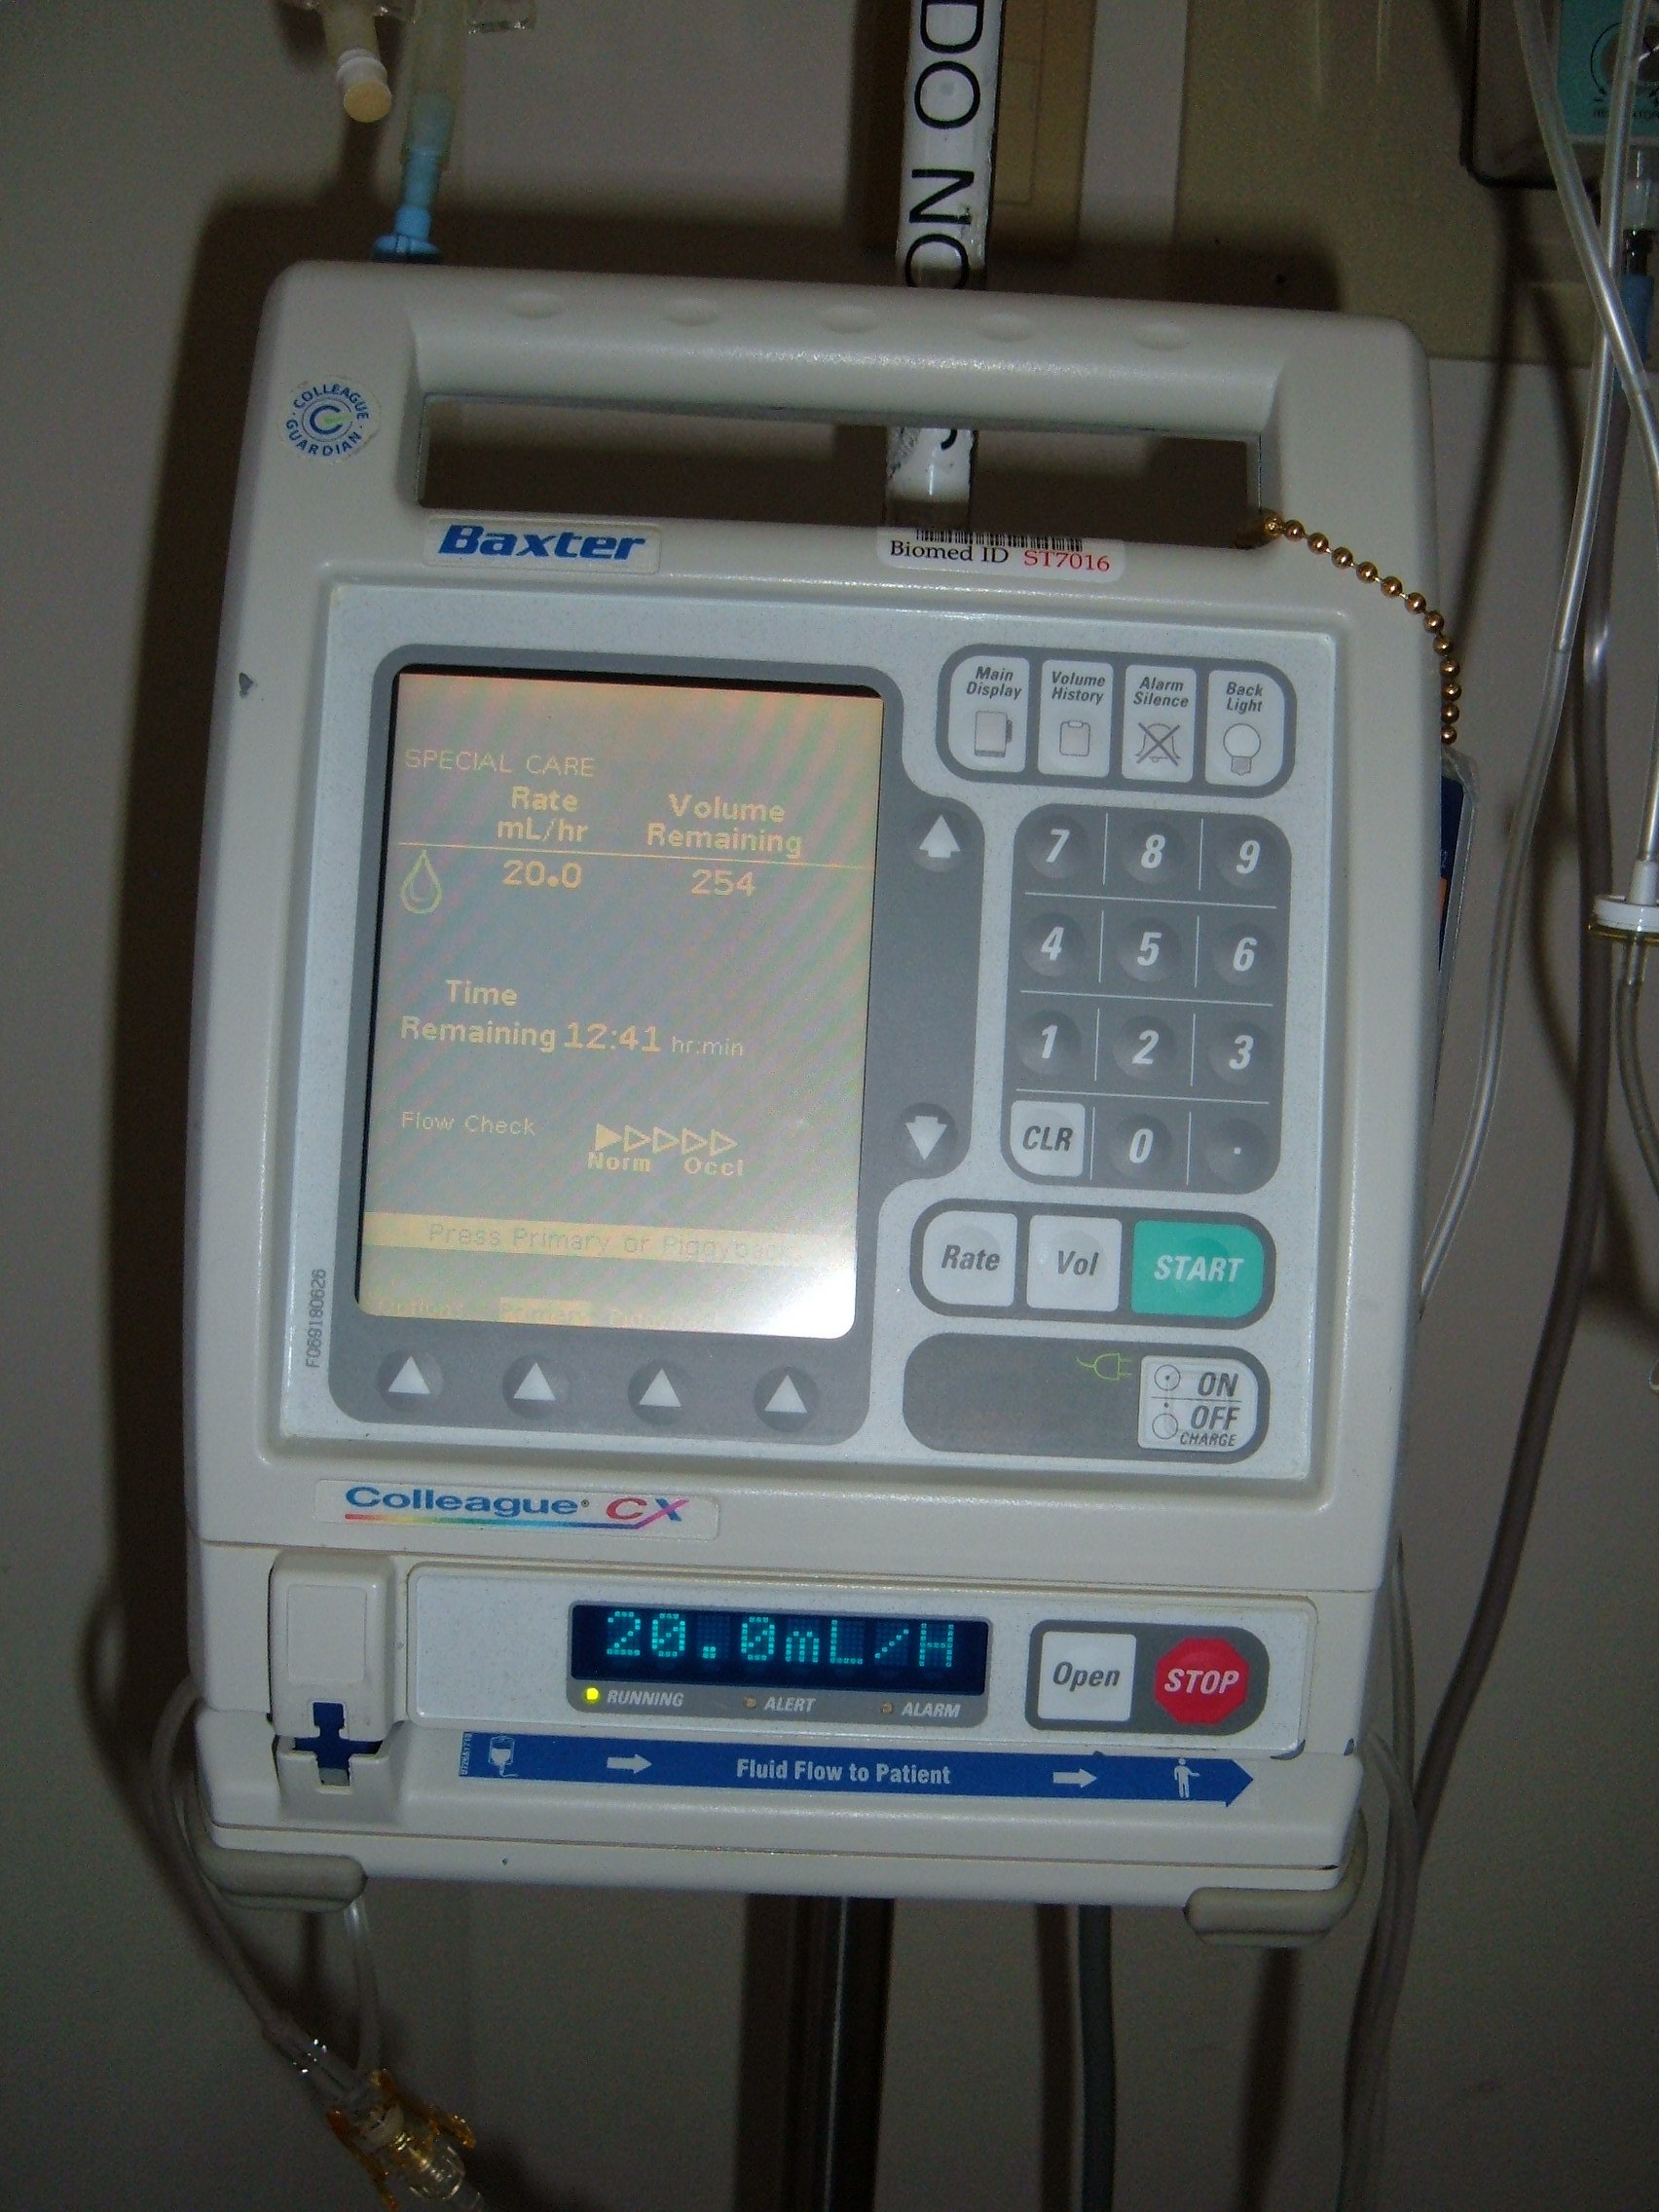
Percentages and applications and estimation, proportions, and rates are the most nursing-relevant topics on the test, because dosage and dilution are proportions. The reliable method is to set one up and cross-multiply:
Write the known ratio →
set it equal to the unknown ratio →
cross-multiply and solve.
Master that single move and a large slice of the section becomes mechanical.
Data, geometry, and units
Interpreting graphs and statistics asks you to pull values off a scatter plot or histogram and compute mean, median, and mode. Geometry and measurement covers basic area, perimeter, and volume formulas. Unit conversion — mL to L, kg to lb, mg dosing — is pure setup: line up the units so the unwanted ones cancel out.
How it shows up on the exam
Math is 23% of your scored questions with 57 minutes on the clock — a hair over a minute per question. The calculator is on-screen and four-function only (no personal calculators), and it's provided for Math alone. That design choice tells you what's being graded: not whether you can multiply by hand, but whether you can translate a real-world scenario into the right operation.
Because the topics build on each other, study them in order rather than jumping around:
Fractions, decimals, percentages →
rational-number operations and order of operations →
equations, proportions, and rates →
graphs, geometry, and unit conversion.
Budget around 15 study hours here — the same as Reading, and more than English — because word problems reward repetition. Expect alternate formats too. Some answers are fill-in-the-blank numeric, where you type a value instead of picking a choice. A "close enough" estimate won't earn the point there, so work each one through. Every topic maps to a short 15-minute unit on Only Ever, and the practice questions are free where other tools charge for them.
Common questions
Can I convert between fractions, decimals, and percentages efficiently? That's the readiness check for this section — if it's slow or shaky, start there. It's the foundation the proportion, percentage, and data questions all sit on.
Is a calculator allowed? Yes, an on-screen four-function calculator is provided for the Math section only. You can't bring your own. Because the calculator handles the arithmetic, questions are built around setup and reasoning, not manual computation.
What kind of math is on it? Arithmetic and pre-algebra: fractions, decimals, percentages, one-variable equations, proportions and rates, basic geometry, unit conversions, and reading graphs. No trigonometry, no calculus.
How do I calculate mean, median, and mode from a graph? Read the values off the chart first, then apply each definition: mean is the average, median is the middle value in order, mode is the most frequent. The hard part is extracting the right numbers from a scatter plot or histogram — practice that reading step.
Want to find your weak topics fast? Try the free practice questions and let your results steer your study hours.